(this page is only viewable from a desktop, and not mobile)

Random matrix theory (RMT) and covariance matrix shrinkage were used to develop weights for 2-,5-, and 10-year portfolios using assets from various sectors. Collar hedge portfolios were also constructed using assets assumed to be optimal for wealth preservation during high volatilty and market downturns (recessions).
There were 8 techniques used for portfolio weight construction:
-MinVar - Minimum variance portfolio, tangency is used for unbalanced, whereas minimum variance is use for rebalanced portfolios.
-EWMA - Exponential weighted moving average determination of returns and standard deviation.
-RES - Component subtraction used to remove effect of the first principal component of the correlation matrix on returns.
-MP - Component subtraction used to remove effect of noise eigenvectors (below Marcenko-Pastur cutoff, lambda+), on returns.
-RESMP - Component subtraction employed to remove effects of greatest principal component and noise eigenvectors below MP cutoff.
-DK - Daniels-Kass shrinkage of correlation matrix.
-LW - Ledoit-Wolf shrinkage of correlation matrix.
-SS - Schafer-Strimmer shrinkage of correlation matrix.
Each portfolio generated includes the years duration (2,5,10), quarterly rebalancing (y/n), metrics (log-returns, fractal dimension, tail return, value at risk and CVaR), covariance and correlation (Pearson, Spearman) matrices, and initial investment of 100,000 USD. The collar hedge portfolios have a shorter duration of 2, 5, and 6 years, due to the life of assets used. Aside from the various RMT approaches, within each portfolio for a given duration and rebalancing approach, there are weights and wealth charts for the MinVar, right-tail weighted, Hurst exponent weighted, and Right-tail-Hurst weighted results. All wealth charts use the S&P 500 index as a comparison based on buy and hold.
All portfolios were generated for an ending calendar year of 2013, going back either 2, 5, or 10 years. The 10-year portfolios offer the best opportunity to gauge whether a given RMT approach can hedge during times of increased volatility because these portfolios include the subprime mortgage crisis, which occurred in 2008-2009.
Conclusions: Altogether, when rebalancing every quarter, the 5- and 10-year dividend portfolios performed the best, with little downturn during the great recession (2008-2009). Ledoit-Wolf (LW, yellow wealth line) covariance shrinkage (right-tail weighted) was the best performer for the 5-year, while the Marcenko-Pastur (MP, navy wealth line) noise removal portfolio performed the best over 10 years (right-tail-Hurst-weighted). The 5- and 10-year (not rebalanced) dividend portfolios resulted in nearly 4x the wealth when compared with the rebalanced; however, this is unrealistic because the well-performing dividend payers over the time frames looked at received heavier weights in the unbalanced only because of historical information, which is not predictive. Thus, rebalancing is more of a real-world scenario, since companies that drop their dividends can be assigned lower or near-zero weights. Lastly, wealth preservation of the Fidelity fund portfolios during the great recession was quite poor, since these portfolios had significant downturns. In consideration of the greater performance of dividend portfolios compared with the e.g. poorer performing Fidelity fund portfolios, results don't imply you can invest in dividend seeking mutual funds and not worry about wealth preservation. The dividend portfolios that were used were hinged to rebalanced self-investment in individual high-quality dividend payers -- which may be more optimal in the long run for wealth preservation and growth.


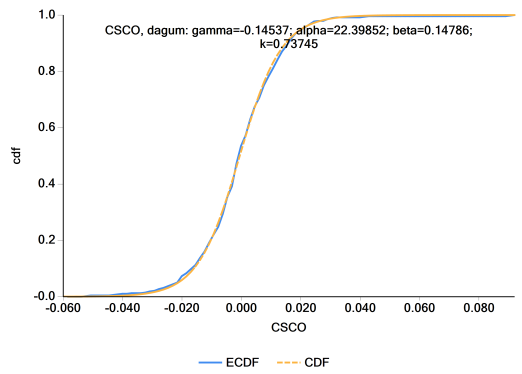
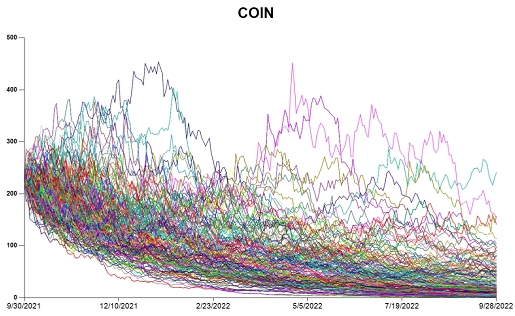
Price return traces are constructed from random quantiles drawn from the best fitting cdf. A trading day is then randomly selected in a randomly selected trace. If the e.g. DEMA(15) is above the DEMA(50) on that day, an entry is made, otherwise a new trace and new day are randomly selected. Entered (long) trades are exited when a randomly selected stop-loss is triggered or the end of trace is hit, and profit is calculated. Profit (net return, profit factor, Sharpe, Sortino) is then maximized using swarm intelligence until convergence - yielding the optimized stop-loss.
Swarm intelligence methods are used to optimize fit of continuous probability distributions to simple- or log-returns. The plot above shows that the 4-parameter Dagum distribution best fit the returns for CSCO stock.
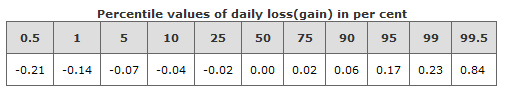
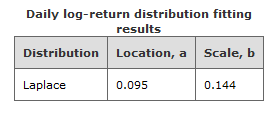
Percentile distributions are determined for each asset, along with the density fit results for log-returns, and Hurst exponent for the price return time series.
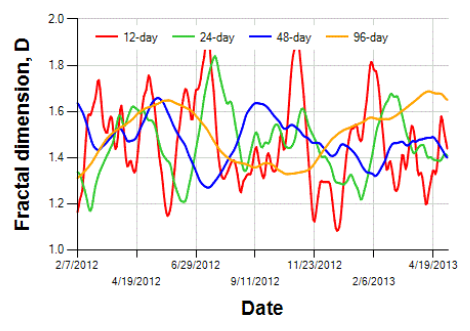
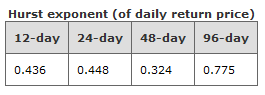
Fractal dimensions for various time-lags are determined in order to reflect stability of the price return. The Hurst exponent is determined from the FD.
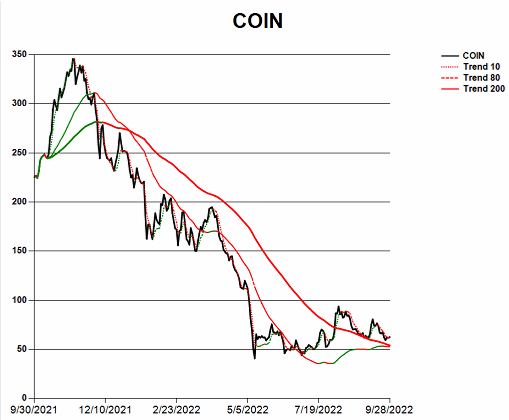
Price trends based on EMA and DEMA can be viewed for any asset.
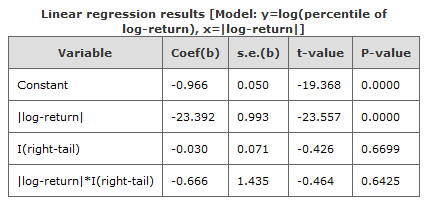
Linear regression is performed for the log-percentiles of left and right tail of the return distribution. Statistical significance of the intercept term for the right-tail, i.e., abs(log-return)*I(right-tail) is identified. If the intercept term is positive and significant, the the right tail has significantly greater log-return values.
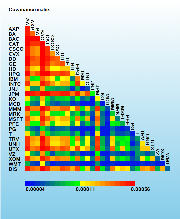
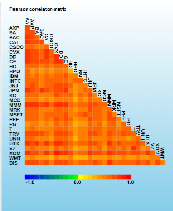
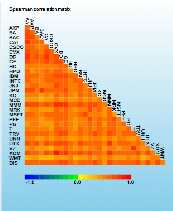
Between-asset covariance and correlation (Pearson and Spearman) of log-returns are provided for portfolio construction. Eigendecomposition is performed on each matrix along with determination of noise threshold for eigenvectors. Component subtraction is performed to remove effects of the greatest eigenvector, noise eigenvectors, or both. Shrinkage techniques are also applied to matrices.
Wealth charts are presented for unbalanced (tangency) and rebalanced (MinVar) portfolios. Asset weights are also adjusted for the Hurst exponent and tail probabilities for the right-tail linear regression fits to weight for stability and/or greater positive returns.
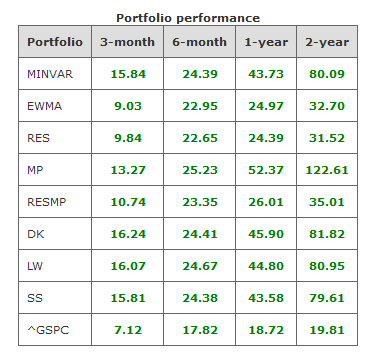
Cumulative returns for each portfolio are presented for the 3-month, 6-month, 1-year, 2-year, 5-year, and 10-year timeframes.
Weight charts are provided for quarterly-balanced portfolios.
DISCLAIMER - This webpage is provided for general information only, and nothing contained within the material constitutes a recommendation for the purchase or sale of any security. Although the data used for portfolio construction are considered reliable, we do not guarantee their accuracy, and any such information may be incomplete or condensed. Also, risk information and portfolios expressed on these pages, are based on research materials available from sources considered reliable. Views are subject to change on the basis of additional or new research, new facts or developments. The investment risks described herein are not purported to be exhaustive, any person considering an investment should seek independent advice on the suitability or otherwise of the particular investment. Investment products are not bank deposits or obligations or guaranteed by NXG Logic, LLC unless specifically stated. Investment products are not insured by government or governmental agencies. Investment and Treasury products are subject to Investment risk, including possible loss of principal amount invested. Past performance is not indicative of future results: prices can go up or down. Investors investing in investments and/or treasury products denominated in foreign (non-local) currency should be aware of the risk of exchange rate fluctuations that may cause loss of principal when foreign currency is converted into the investor's home currency. All use of information is subject to Terms and Conditions of the individual investment and Treasury products. Users understand that it is their responsibility to seek legal and/or tax advice regarding the legal and tax consequences of his or her investment transactions. If a customer changes residence, citizenship, nationality, or place of work, it is his or her responsibility to understand how his or her investment transactions are affected by such change and comply with all applicable laws and regulations as and when such becomes applicable. Customer understands that NXG Logic, LLC does not provide legal and/or tax advice and is not responsible for advising him/her on the laws pertaining to his/her potential investment transactions.