Stop wasting time using your data analysis software
Data analysts and scientists often overlook how much time they are truly wasting when analyzing data. Most of these inefficiencies span a wide range of component issues, but predominantly partition into shortcomings of the software and unawareness of time-related issues among users.
Software-specific shortcomings:
Most software houses only develop a method from a one-dimensional perspective, as a means to an end for getting results to the user.
What the user does with the results is the user's responsibility, not the developer's.
Software design of computer-generated outputs are not linked to time efficiency and user productivity.
The over-programmed software houses, who developed everything they could get their hands on in the 70's, 80's and 90's, are now stuck with millions of lines of legacy code which is rarely used -- but users still pay for this.
The over-programming hasn't stopped: the introduction of new modules is ever-increasing in order to remain competitive.
User-specific shortcomings:
Software users only know what they have been taught in school, on the job, or from example runs in user guides, or blog posts.
Example runs for tackling a problem are usually based on the already-suffering software issues enumerated above.
Most users are unaware of the large amount of time they waste for performing routine analyses, including summarizing data, hypothesis testing, and model building.
Altogether, the sum total of these user-centric issues is time inefficiency and high levels of lost productivity.
Let's look at a specific example of what's involved for running a simple independent 2-sample t-test on a continuously scaled variable.
Using other software (not NXG Logic Explorer) to run a single t-test:
Import the data. If the data have already been cleaned, then there shouldn't be any problems. However, if not the user will need to get back to the data provider and inform them that the data has a lot of issues, such as text strings where numbers should occur, empty rows in the data set, and non-uniform coding techniques. It is not over yet: if the analyst doesn't clean data, then the user will need to wait for the data to be cleaned -- so how much time will this take?
Normality assumptions, range, scale, skewness, and kurtosis of the continuous variable being considered. Does the user know how to evaluate these summary statistics with the software being used? If not, all the command syntax or pull-down menu commands need to be looked up. How much time will this take?
What should the user do if the distribution of the continuous variable is nowhere near being normal, and takes on a multimodal distribution or has a triangle-type distribution which is not amenable for the t-test? This would most likely converge to use of a non-parametric Wilcoxon rank sum test, or Mann-Whitney test (these are almost identical test, but have slightly different numerators for the test-statistic). Does the user know how to implement these tests with the software being used? If not, how much time will be required to learn how to make such runs?
Select the appropriate t-test regarding variance assumed equal or unequal. This involves knowing whether the variance of the values of the continuous variable within each group is equal or unequal. This is commonly determined using a F-ratio test, Levene's test, or Bartlett's test. Does the user know how to run either of these variance equality tests with the software being used? If not, the user needs to look up run examples, and then learn how to interpret the results. How much time will this require?
Once the equality (inequality) of variances is known, the user must consider whether a one-tailed or two-tailed test is to be considered. What is the decision rule if a one-tailed test is significant, but not the two-tailed test?
Finally, the appropriate t-test can be run.
Are the results of the t-test needed by the data provider, or used in a manuscript or presentation? Either way, the user must transpose the test statistic and p-value to an email, manuscript or presentation. How much time will this require?
The above criteria were considered for just one t-test for a single variable. What if there are mutliple variables which are to be tested across the two groups? This would require evaluation of 4 assumptions (normality/skewness, distribution/multimodal, equality of variances, one-tailed vs two-tailed) for each variable considered.
Using NXG Logic Explorer for a single t-test:
Firstly, Explorer was designed to perform parallel feature analysis (PFA) by simultaneously generating summary statistics, Shapiro-Wilk tests, histograms, and count frequencies for multiple continuous and categorical variables. The following describes a PFA run of several variables (features).
Import the data. NXG Logic has an auto-cleaning feature for Excel (.csv) files. If the data are administrative and weren't generated from research but rather a database or electronic medical records, the user could simply import using autoclean. If not, the user could still get back to the data provider and suggest that the data has issues, but a cursory run could still be made on an exploratory basis to see what obtains given the current (uncleaned) data. Time potentially saved: 1-2 hours to days.
Normality assumptions, range, scale, skewness, and kurtosis of the continuous variable being considered. Explorer can select multiple variable and generate summary statistics for all variables a single table, including average, s.d., min, max, quartiles, skewness, kurtosis, and p-value for the normality test. Time potentially saved: 1-2 hours.
Explorer provides in a single output results for the t-test, Mann-Whitney, and Bartlett's homogeneity of variance for multiple variables. Using results from Bartlett's test, Explorer identifies, selects, and runs the appropriate t-test (equal or unequal variance assumed) for multiple variables.
Are the results of the t-test needed by the data provider, or used in a manuscript or presentation? The single output table for multiple variables (containing test statistics and p-values for appropriate t-test, Mann-Whitney, and Bartlett's test) can be directly pasted into a manuscript/presentation or e-mailed to the data provider.
In sum total, running t-tests for multiple variables with Explorer, including automatic identification and use of the appropriate t-test for homogeneity of variance, Mann-Whitney test results, and Bartlett's test results can be done in less than a minute. See an example comparison table for specific descriptions involved in a fair comparison.
Data analysts will be much better prepared for a meeting with data provider(s) to discuss test results when using output from Explorer. The amount of information encapsulated into Explorer results is tremendous, and its generation can be accomplished in under a minute. Once users become accustomed to the increased productivity involved when using Explorer, it is common to never go back to using other software.
What's output by Explorer from a single Summary Statistics run for multiple variables?
1. Summary statistics table:
2. Automatically run table of category counts (frequencies) for categorical variables:
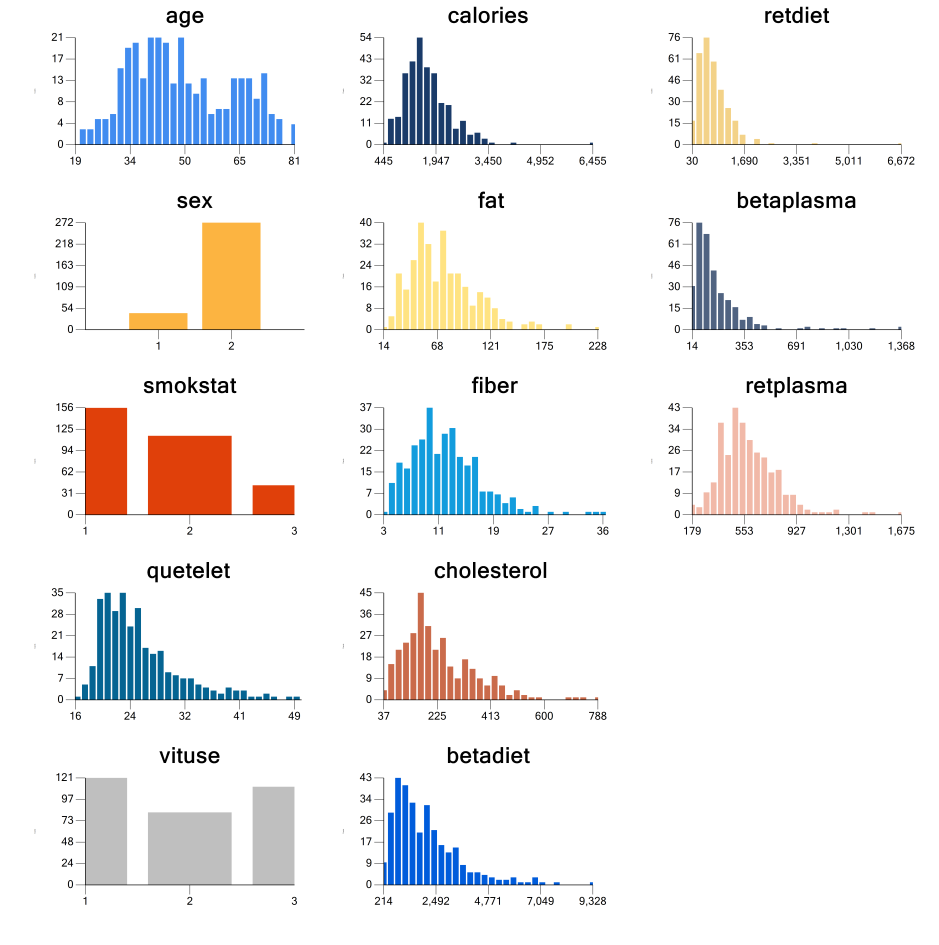
3. Automatically run panel of histograms:
What's output by Explorer from a single run for 2-sample tests for multiple variables?
1. Single table of t-test, Mann-Whitney test, and Bartlett's test for each variable:
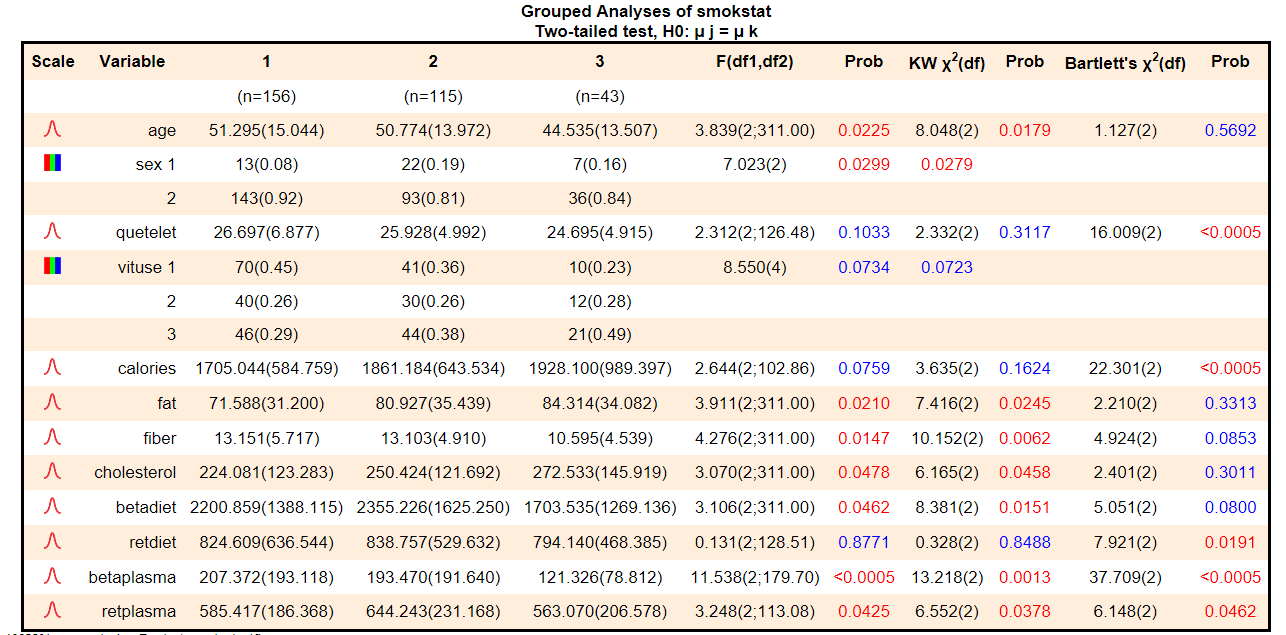
What's output by Explorer from a single run for k-sample tests for multiple variables?
1. Single table of t-test, Mann-Whitney test, and Bartlett's test for each variable:
What's output by Explorer from a single linear (logistic, Cox PH, Poisson) regression run for multiple predictors?
1. Univariate regression results, automatically-generated multiple variable model using univariate models whose p-value is less than cutoff (e.g. 0.25), coefficients of partial determination:
2. Table of overly influential observations (multiple residuals, DFFITS, etc.):