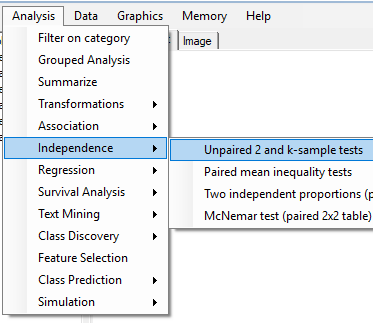
The table below provides a comparison between NXG Logic Explorer and other software of the time involved to perform a single t-test for one variable (2 groups) and the accompanying tests surrounding the necessary assumptions for applying the t-test.   As you can see, NXG Logic Explorer can simultaneously perform multiple tests for multiple variables, including parametric and non-parametric tests on continuously-scaled variables and chi-squared tests of association for multiple categorical variables across the same two groups.   Thus, many tests for continuous and categorical are performed, which typically takes less than a minute.   The output involves a single table for which fonts and colors can be changed, based on the needs of the user -- using a pastable html or graphic image. 

All this in under a minute.   What's more, these features are available in the free Standard edition, along with many types of regression analyses and their automated runs and outputs.

Also see the background information related to software design and loss of productivity.
Support      Solutions        Blog        News       Contact 
DOWNLOAD   /   DISCOVER   /   TUTORIALS    /   VIDEOS   /   STORE   /   ABOUT
Example time comparison for other software vs. NXG Logic Explorer
The table below provides a comparison between NXG Logic Explorer and other software of the time involved to perform a single t-test for one variable (2 groups) and the accompanying tests surrounding the necessary assumptions for applying the t-test.   As you can see, NXG Logic Explorer can simultaneously perform multiple tests for multiple variables, including parametric and non-parametric tests on continuously-scaled variables and chi-squared tests of association for multiple categorical variables across the same two groups.   Thus, many tests for continuous and categorical are performed, which typically takes less than a minute.   The output involves a single table for which fonts and colors can be changed, based on the needs of the user -- using a pastable html or graphic image. 

All this in under a minute.  What's more, these features are available in the free Standard edition, along with many types of regression analyses and their automated runs and outputs.
Also see the background information related to software design and loss of productivity.


Other software

NXG Logic Explorer

Task/assumptions

Description

Time required

Remarks

Description

Time required

Remarks

Import data

If data not clean, get back to provider

Minutes to 2,3 days

May result in long delays

Automatic data cleaning

N/A


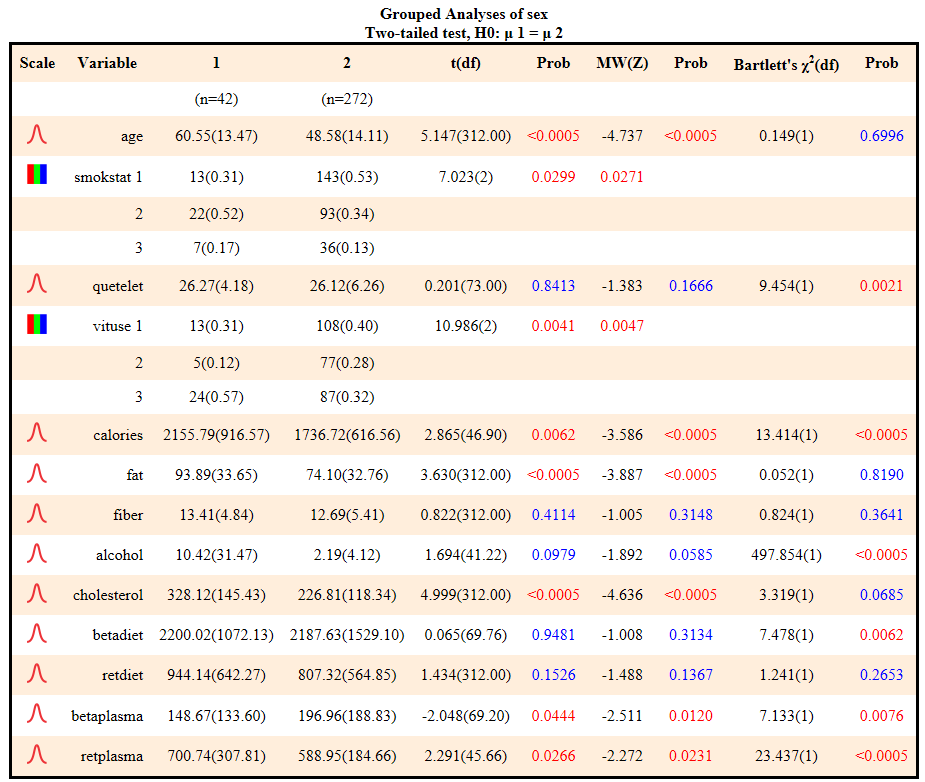
Run summary statistics on variable

Evaluate average, s.d., min, max, median, quartiles, separately from skewness, kurtosis

<1 hour, need to develop syntax language for command line usage, manually run


Results are in separate output

Each run automatically includes avg, s.d., min. max range, quartiles, skewness, kurtosis, and p-value for normality

5-10 seconds, automatically run

Can run multiple variables, no syntax needed

Test normality assumption, evaluate distribution

Run separate test of normality (Lilliefors, Shapiro-Wilk)

Few minutes, manually run


Can’t make single run on multiple variables, Results are in separate output

N/A

N/A

Performed during summary statistics run

Test equality of variance

Run separate Levene’s or Bartlett’s test

Few minutes, manually run

Can’t make single run on multiple variables; Results are in separate output

N/A

N/A

Performed during testing

Run t-test on single variable


Few seconds, manually run

Results are in separate output

Automatically runs Bartlett’s test, t-test, and Mann-Whitney

Few seconds, automatically run

Results for multiple variables in single output

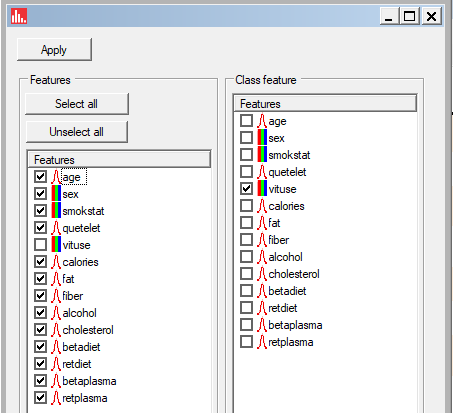
Association tests for single categorical variable

Need to make additional runs

< 1 hour, but need to set up runs separately, manually run

Must transpose results from individual runs into useable table or format

Automatically runs chi-squared tests for multiple variables

Few seconds, automatically run

Chi-squared tests run on categorical variables during parametric, non-parametric testing

Use output


<1 hour, depending of format

Must transpose results from individual runs into useable table or format

N/A

N/A

Readily publishable/presentable format


Total time

Several minutes (e.g. 10-20) for one variable (parametric)

Hundreds of keystrokes & debugging, loss of productivity, not ergonomic


< 1 minute for multiple variables (parametric, non-parametric, categorical)

Few mouse clicks

Step 1: Start Explorer, and input the Retinol dataset (5 seconds).
(C) 2019 NXG Logic, LLC
Step 2: Select independence tests, unpaired 2-sample (2 seconds).
(C) 2019 NXG Logic, LLC
Step 3: Select SEX as the 2-group variable, and the remaining continuous and categorical variables (5 seconds).
(C) 2019 NXG Logic, LLC
Step 4: Select the Grouped analysis icon and view the output table (5 seconds)Notice the adjustment to the d.f. of the t-test when Bartlett's test is significant.  This implies that the Welch t-test for unequal variances was used. The categorical tests for vitamin use and smoking provide the asymptotic p-values along with the Fisher exact test based on a set limit of 10,000 iterations.  This can be increased to 100,000 if necessary, but 10,000 has shown to converge on results from 100,000 iterations.   
(C) 2019 NXG Logic, LLC
Chi-squared tests are run the same time parametric and non-parametric tests are run on the continuous variables.
(C) 2019 NXG Logic, LLC
© 2018 NXG Logic, LLC
Step 5: A 3-group ANOVA (Kruskal-Wallis) set of tests along with chi-squared tests for SEX and SMOKING can be quickly run by simply selecting the 3-group VITUSE (vitamin use) variable as the grouping variable, with all remaining variables as the test variables (5 seconds).
(C) 2019 NXG Logic, LLC
Step 6: Select the Grouped analysis icon and view the output table (5 seconds)Note that Welch ANOVA is used when Bartlett's test is significant, due to heteroscedasticity (unequal variances).   This can be noticed by a change in the denominator d.f. of the F-ratio test - shown in the table.  Again, you can see the asymptotic p-value for the chi-squared tests along with the Fisher exact test (10,000) iterations.  
(C) 2019 NXG Logic, LLC
In summary, the total time required to run the 6 steps was less than a minute, and the results included a dozen variables and dozens of tests, while all the necessary tests concerning equality of variances were ran behind the scenes, with Welch tests employed if heteroscedasticity was present.  The chi-squared tests were also performed on the categorical variables which happened to be included in the 2-group and k-group tests.  

The above runs are ideal for generating demographic tables for intervention studies, case-control, cohort and prospective, and baseline variables for randomized clinical trials and longitudinal studies with k-treatment groups.  Group labels can be easily input using the label editor or by input of text files containing categorical group labels.  

The analyses presented above are also available in the free Standard edition of Explorer.   Once you become accustomed to the time-savings offered by using Explorer, you will begin to realize how much time you have wasted with your current software.  We also use Explorer whenever possible, since we can't afford to waste time and lose the productivity associated with use of so many other platforms.  


(C) 2019 NXG Logic, LLC