By pull-down menu:
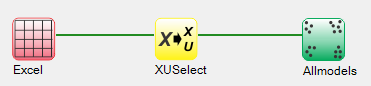
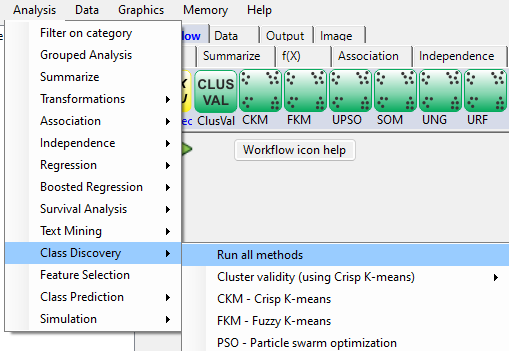
For this example run, we are using the 3-class wine.xlsx dataset, which is distributed with Explorer CE. To run all of the class discovery methods, in the Analysis pull-down menu, select Class Discovery and then Run all methods:
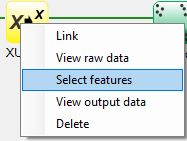
To select features, right-click on the yellow XUSelect icon, and select Select features:
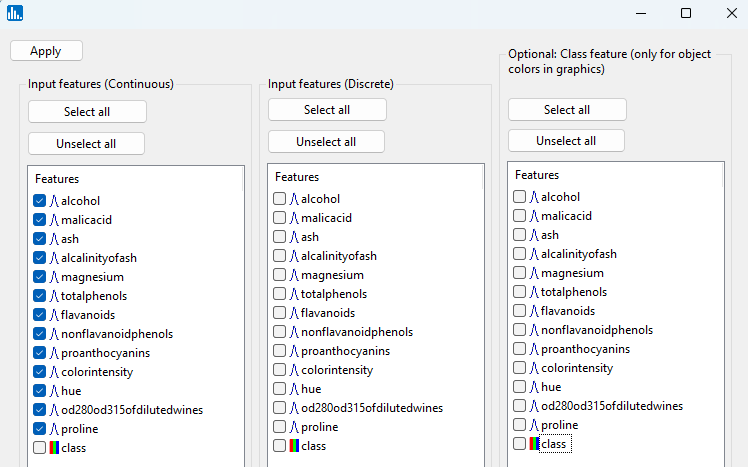
A popup window for feature selection will then appear (left, below):
Select the features that are highlighted in the left panel below:
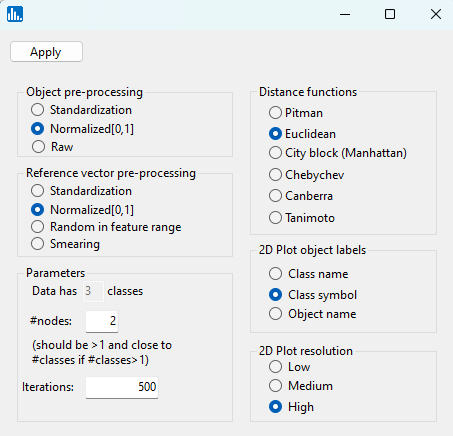
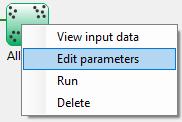
When using the workflow (icons) for a run, to see the parameter selection popup window shown to the left, right-click on the green-colored run icon, and select Edit parameters:
Click on Apply, and the following popup window for parameter settings will appear. For this run, change the number of nodes (dimensions) to 2:
When using the workflow (icons) for a pipeline, you can run all the tasks in the current workflow by clicking on the green-colored button shown below:
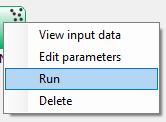
Otherwise, to run a single task in the workflow, then right-click on the specific green run-icon, and select Run:
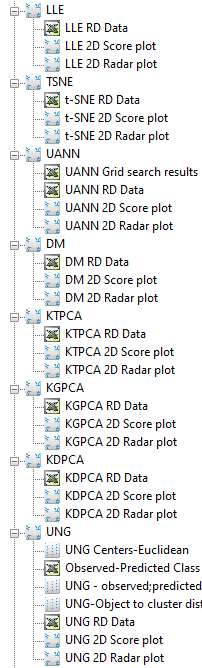
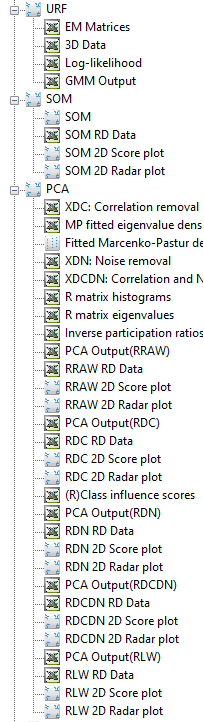
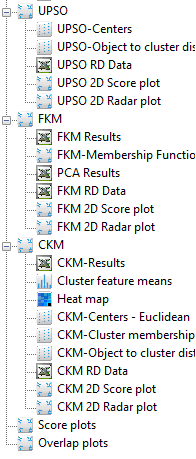
After you click on Apply (above popup window), the run will start, and the following output icons will appear:
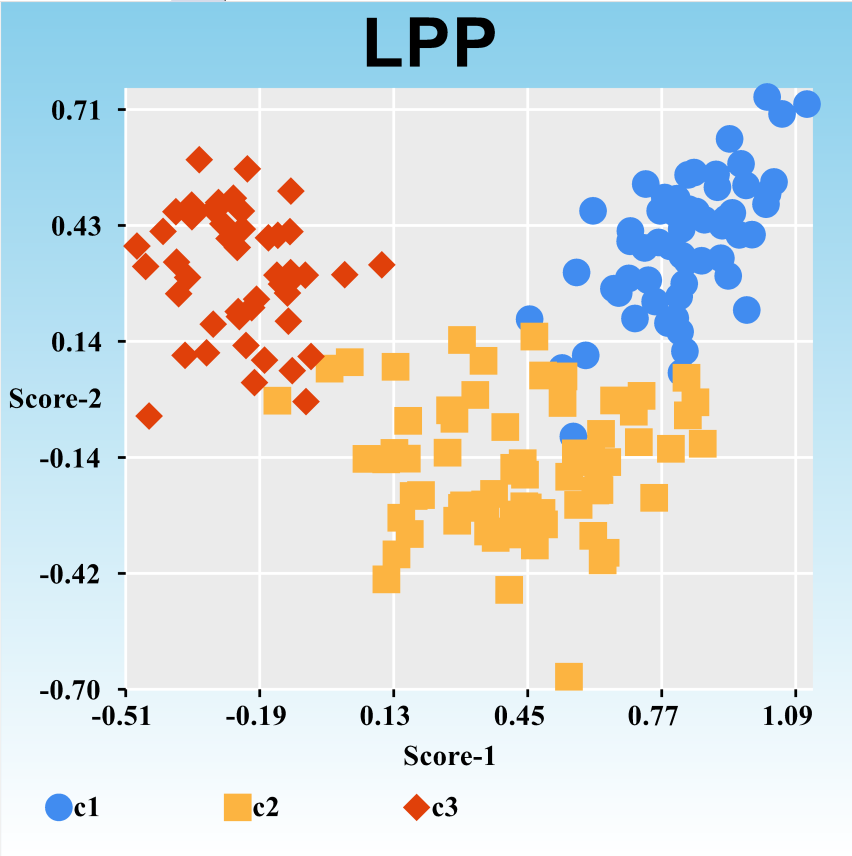
Click on the LPP Score plot, which shows the 2D dimensional reduction score plot for the Locality Preserving Projections (LPP) method:
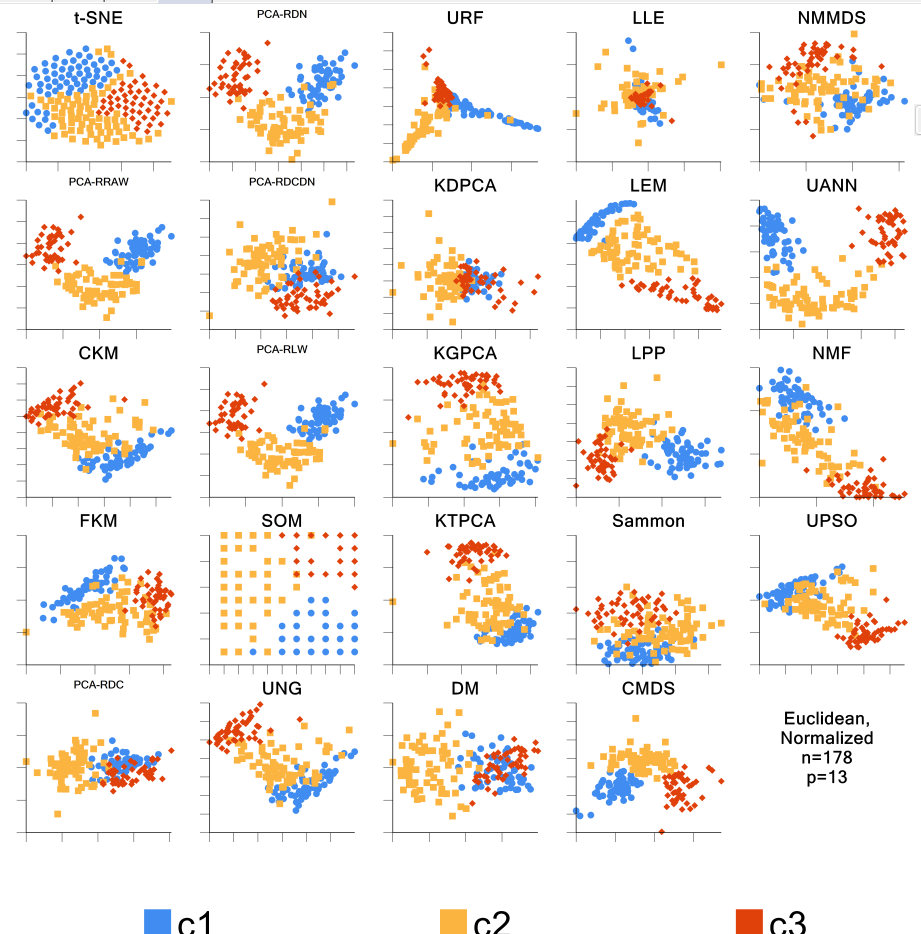
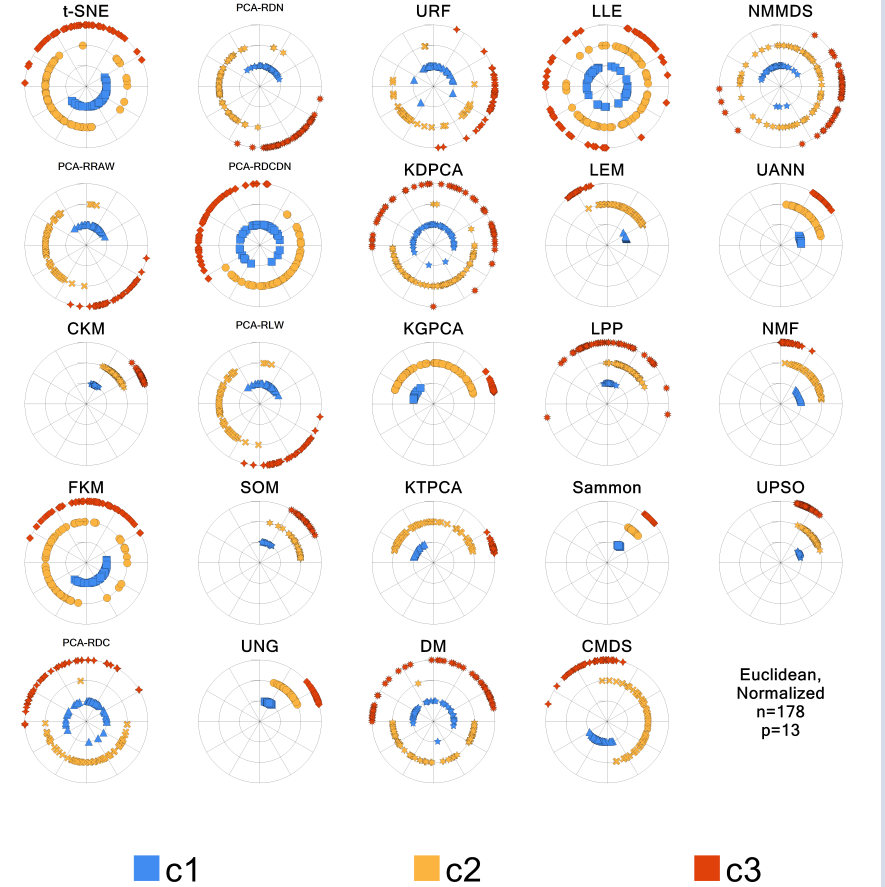
Click on the Score plots and Overlap plots icons (see red arrows above). The Score plot shows the 2D dimensional reduction results from each method in the form of an X-Y scatterplot of scores for each object. Whereas the Overlap plot shows the direction cosines for each object, based on each object's 2D score-based distance to the origin.