By pull-down menu:
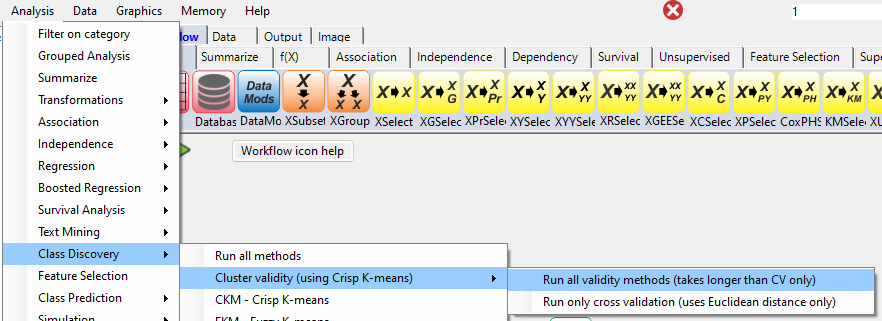
For this example run, we are using the 3-class wine.xlsx dataset, which is distributed with Explorer CE. To perform Cluster validity analysis, in the Analysis pull-down menu, select Class Discovery and then Cluster Validity (using Crisp K-means):
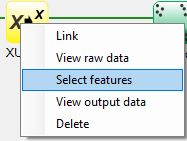
To select features, right-click on the yellow XUSelect icon, and select Select features:
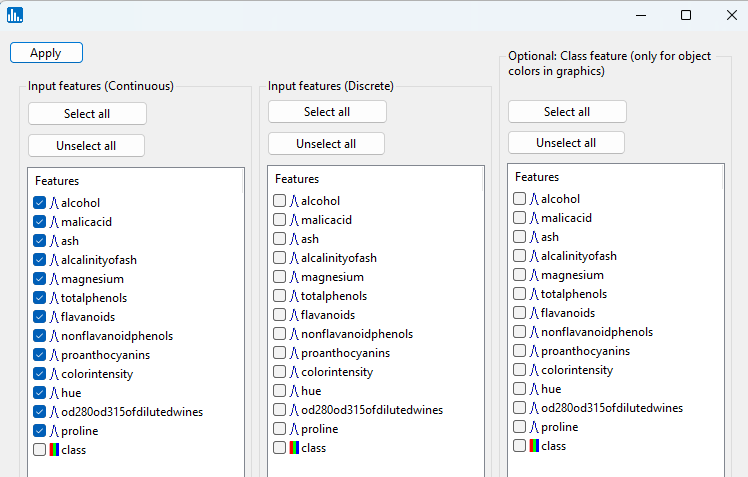
A popup window for feature selection will then appear (left, below):
Select the features that are highlighted in the left panel below:
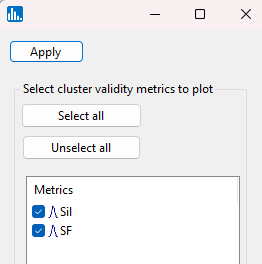
Click on Apply, and the following popup window for the Silhouette distance ("Sil") and Saitta score function ("SF") and will appear. Accept the default values and click on Apply:
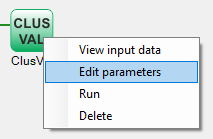
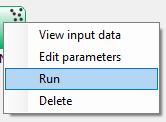
When using the workflow (icons) for a run, to see the parameter selection popup window shown to the left, right-click on the green-colored run icon, and select Edit parameters:
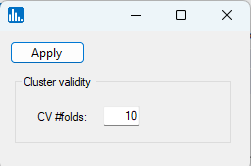
Click on Apply, and the following popup window for the number of cross-validation folds will appear. Accept the default value of 10 and click on Apply:
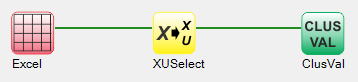
When using the workflow (icons) for a pipeline, you can run all the tasks in the current workflow by clicking on the green-colored button shown below:
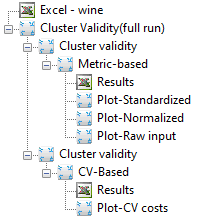
After you click on Apply (above popup window), the run will start, and the following output icons will appear:
Otherwise, to run a single task in the workflow, then right-click on the specific green run-icon, and select Run:
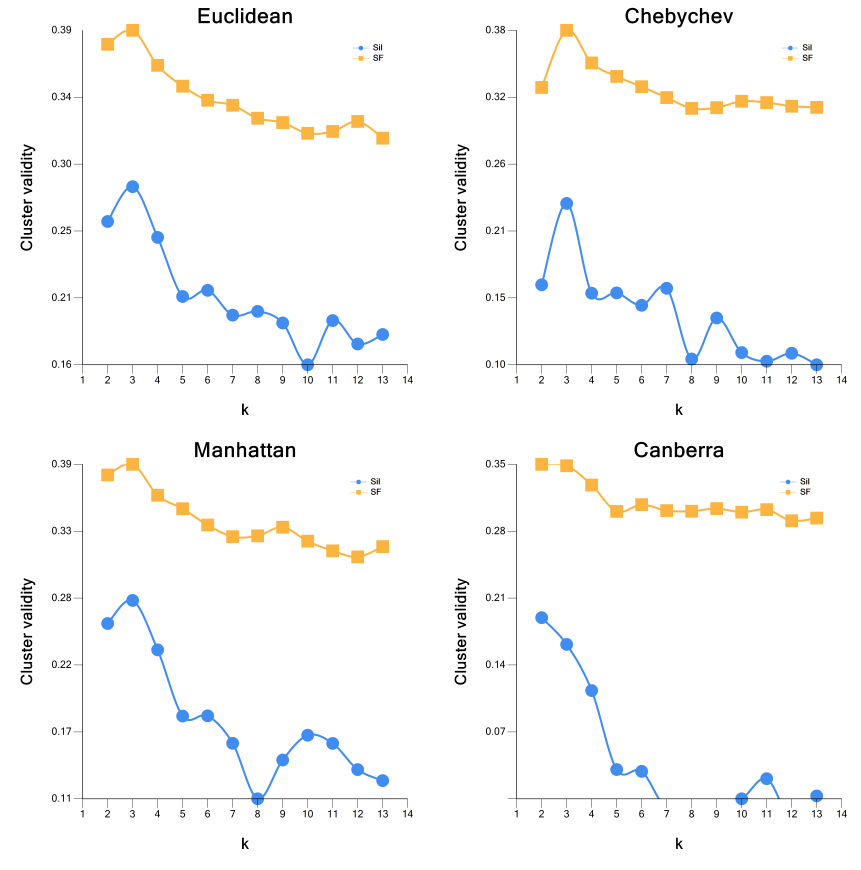
Click on Plot standardized, and you will see the image below. Notice that the SF score reveals a peak at a value of k=3, which is the same as the number of classes in the dataset.
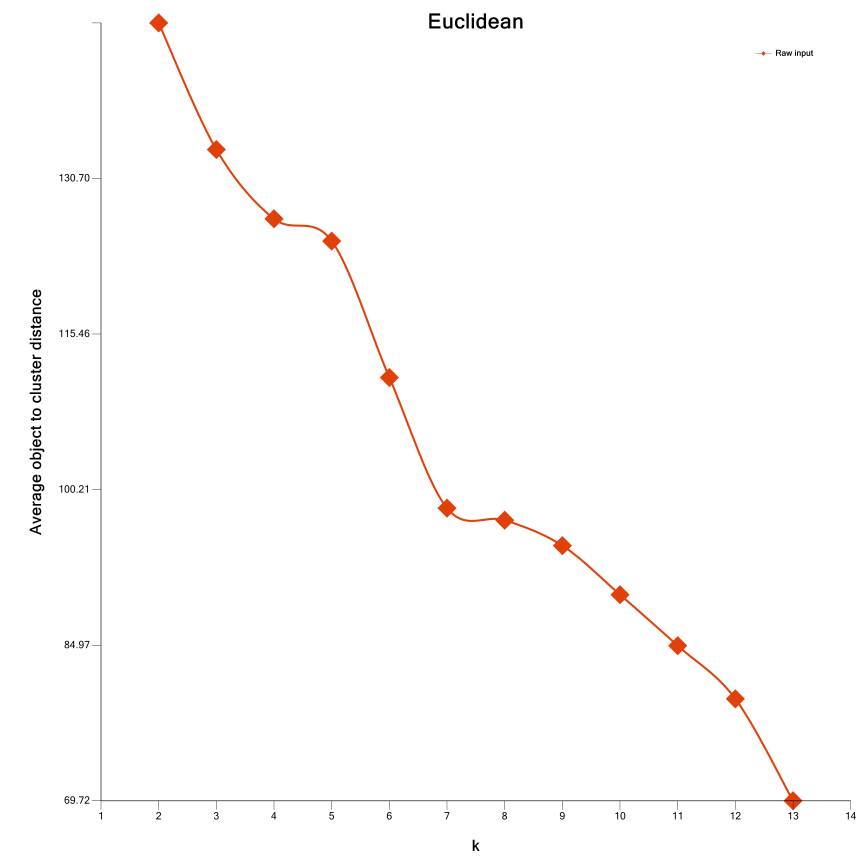
After clicking on the Plot CV costs, the following image will appear. Results indicate that a "knee" starts forming at a value of 4, which is close to the known number of classes of 3.