By pull-down menu:
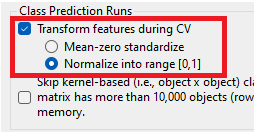
Before starting the run, ensure that feature transformations (normalization or standardization) are turned on for class prediction runs. These options will instruct Explorer to use the results (min/max, and mean & s.d.) from the training data in training folds for normalization/standardization of feature values in test objects. It's inappropriate to normalize or standardize all objects in the dataset together, since this results in information leakage. By using results from training data for normalizing/standardizing feature values in the test fold, there is no information from training that's used in testing.
Therefore, select Preferences, then General default settings, and then select the following options which are outlined:
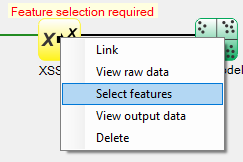
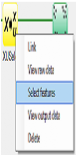
To select features, right-click on the yellow XUSelect icon, and select Select features:
A popup window for feature selection will then appear (left, below):
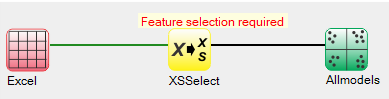
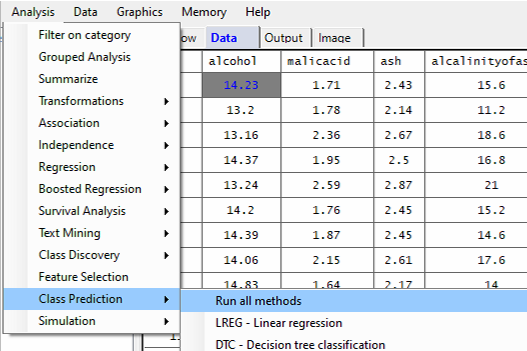
For this example run, we are using the 3-class wine.xlsx dataset, which is distributed with Explorer CE. To perform class prediction using all models or methods, in the Analysis pull-down menu, select Class Prediction and then Run all methods:
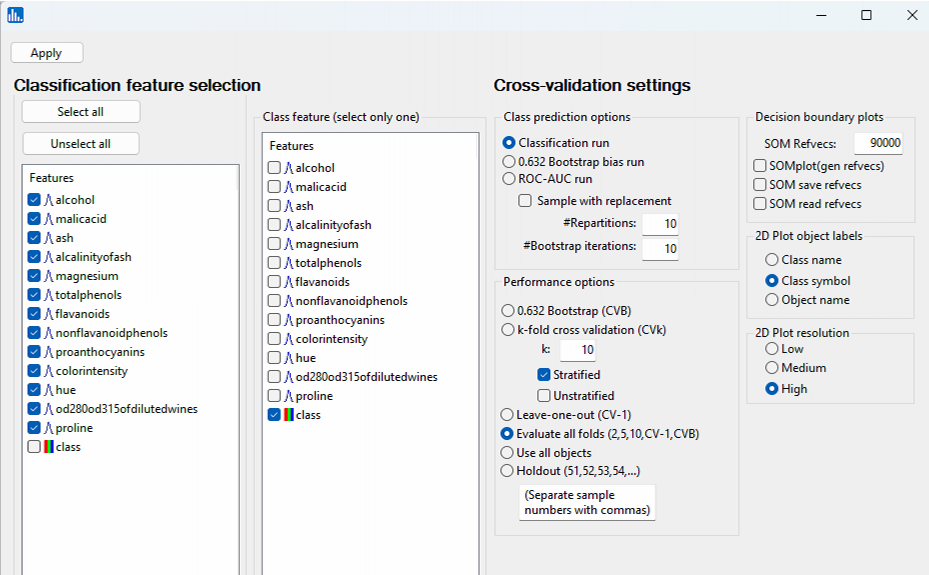
Select the features that are highlighted in the left panel below,and select class as the class feature, and accept all the other options:
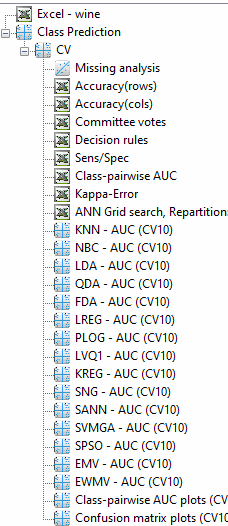
Click on Apply, and the run will begin. When the run has completed, the following icons will be visible:
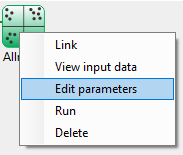
When using the workflow (icons) for a run, to see the parameter selection popup window shown to the left, right-click on the green-colored run icon, and select Edit parameters:
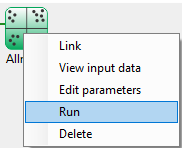
When using the workflow (icons) for a pipeline, you can run all the tasks in the current workflow by clicking on the green-colored button shown below:
Otherwise, to run a single task in the workflow, then right-click on the specific green run-icon, and select Run:
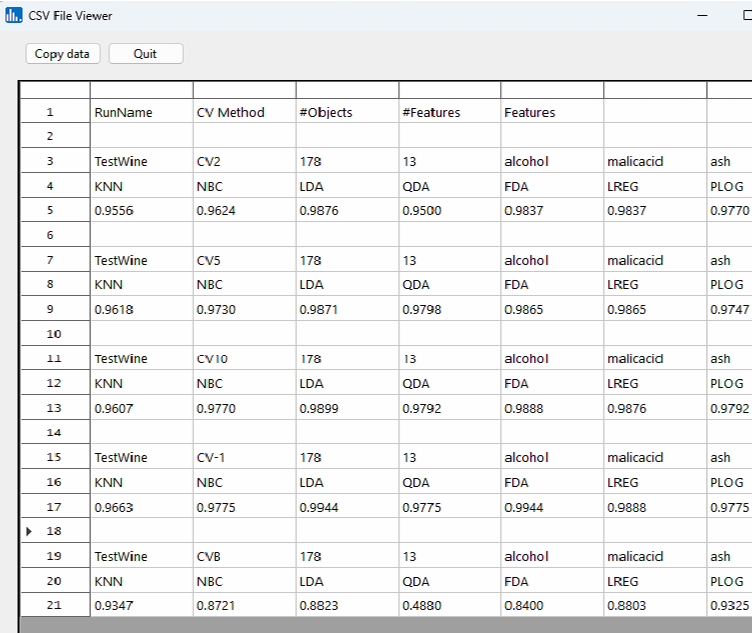
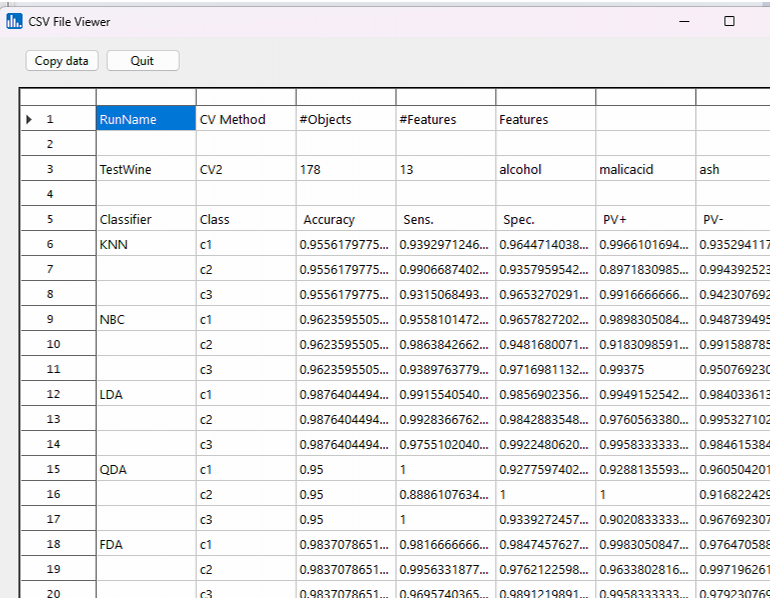
Click on the Accuracy(rows) icon, and you will notice the average classifier accuracy over all the repartitions for the number of folds used. For CV-1 and CVB, the number of repartitions is set to 1. Whereas for CV2, CV5, and CV10 it was 10:
Click on the Sens/Spec icon, and you will notice the class-specific sensitivity and specificity for each of the CV fold runs:
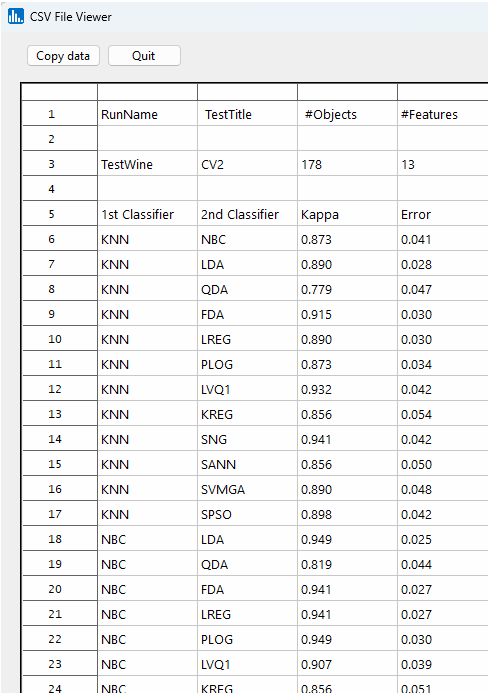
Click on the Kappa-Error icon to see the diversity for all possible pairs of classifiers used:
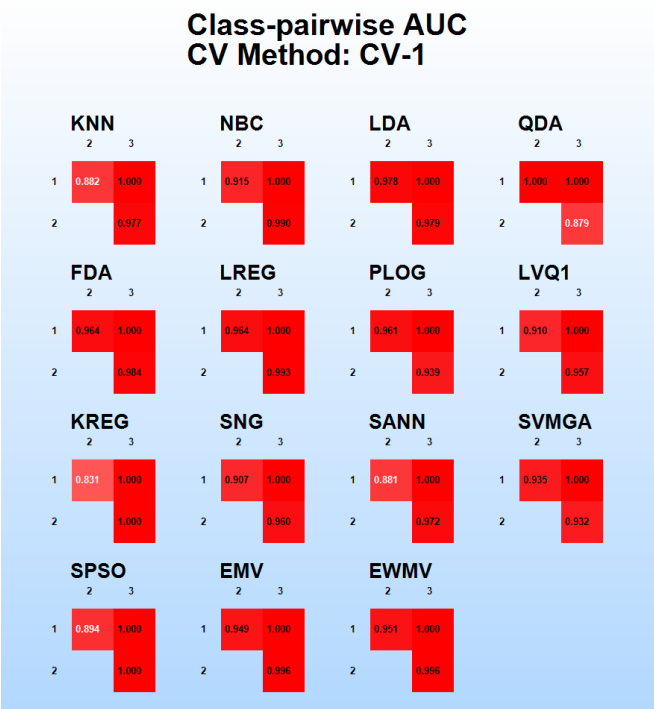
For the LOOCV run, i.e., leave one out ("CV-1"), click on the Class-pairwise AUC plots icon:
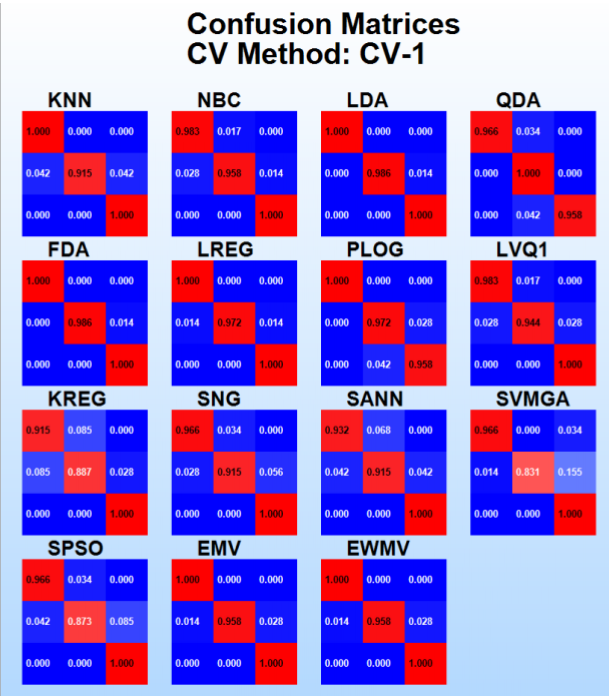
Also for the CV-1 run, click on the Confusion matrix plots icon: