By pull-down menu:
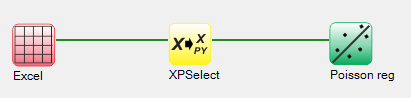
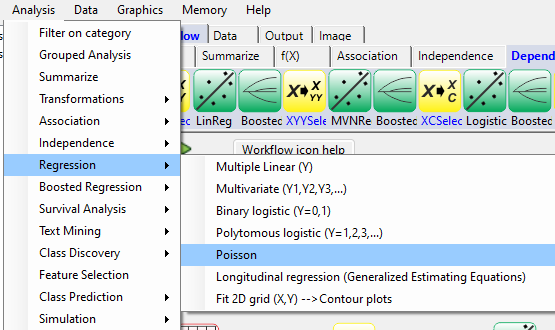
For this example run, we are using the British_doctors.xlsx dataset, which is distributed with Explorer CE. To perform Poisson regression, in the Analysis pull-down menu, select Regression and then Poisson:
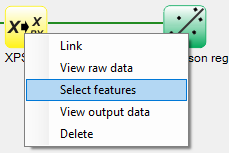
To select features for binary logistic regression, right-click on the yellow XPSelect icon, and click on Select features:
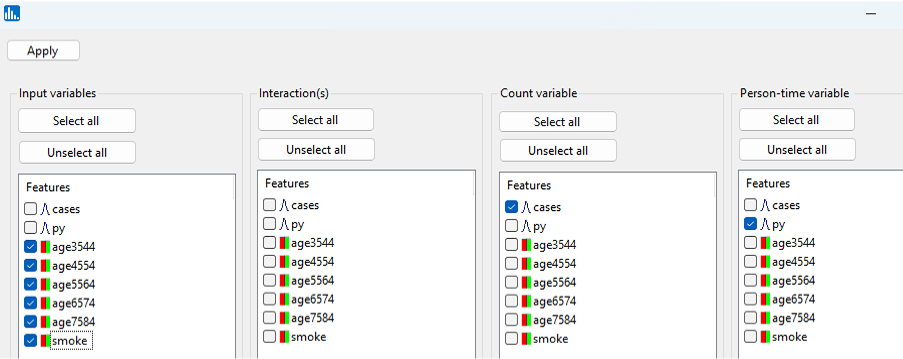
A popup window for feature selection will then appear (left, below):
Select py as the person-time feature, cases and the count feature, and all the binary features as predictors:
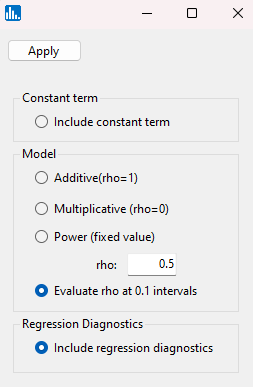
Click on Apply in the feature selection window, and then the following popup window with options will appear:
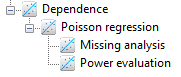
Select Evaluate rho at 0.1 intervals and then click on Apply, and the run will start. When the run is complete, the following output icons will appear:
When using the workflow (icons) for a pipeline, you can run all the tasks in the current workflow by clicking on the green-colored button shown below:
Otherwise, to run a single task in the workflow, then right-click on the specific green run-icon, and select Run:
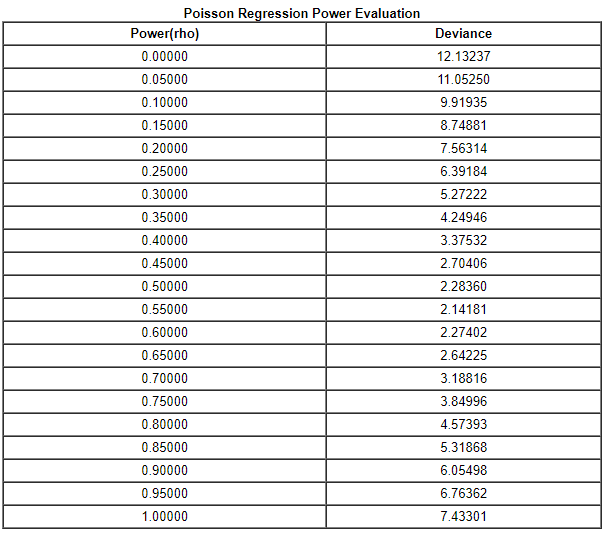
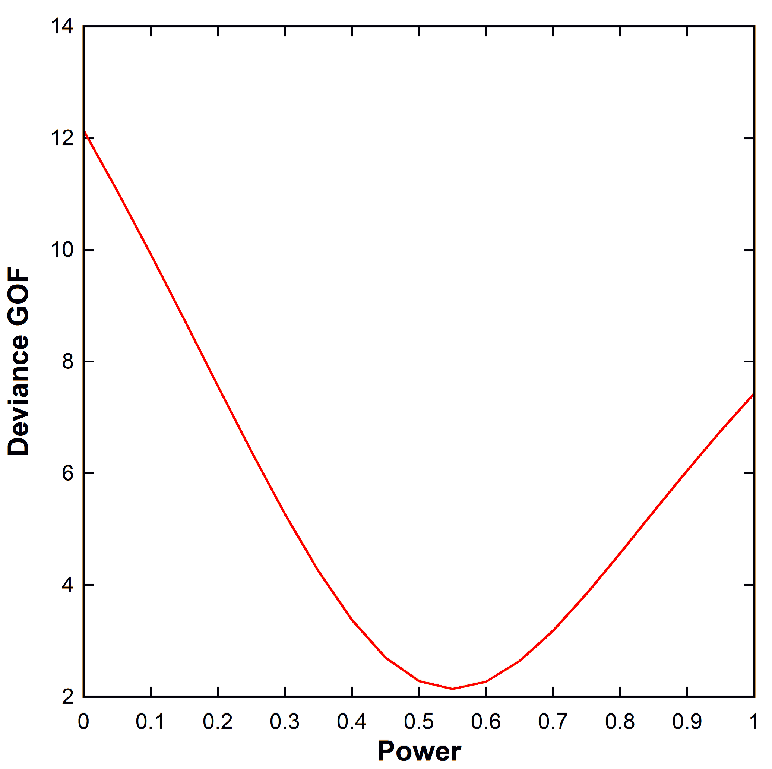
Click on Power evaluation icon, and you will see a list of deviance goodness-of-fit as a function of the power (rho) for the geometric mixture model. A purely multiplicative model occurs when rho=1, whereas a pure additive model occurs when rho=1:
Looking at the output above, the lowest deviance value occurs at rho=0.55, which is approximately a geometric mixture model that's about half multiplicative and half additive. The model deviance as a function of rho is shown below: