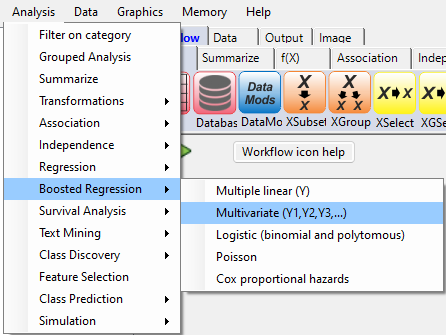
By pull-down menu:
For this example run, we are using the Retinol.xlsx dataset, which is distributed with Explorer CE. To perform boosted multiple linear regression, in the Analysis pull-down menu, select Boosted Regression and then Multivariate(Y1,Y2,Y3,...):
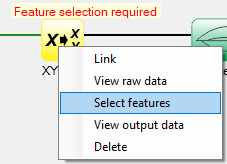
To select features for boosted multivariate linear regression, right-click on the yellow XYYSelect icon, and click on Select features:
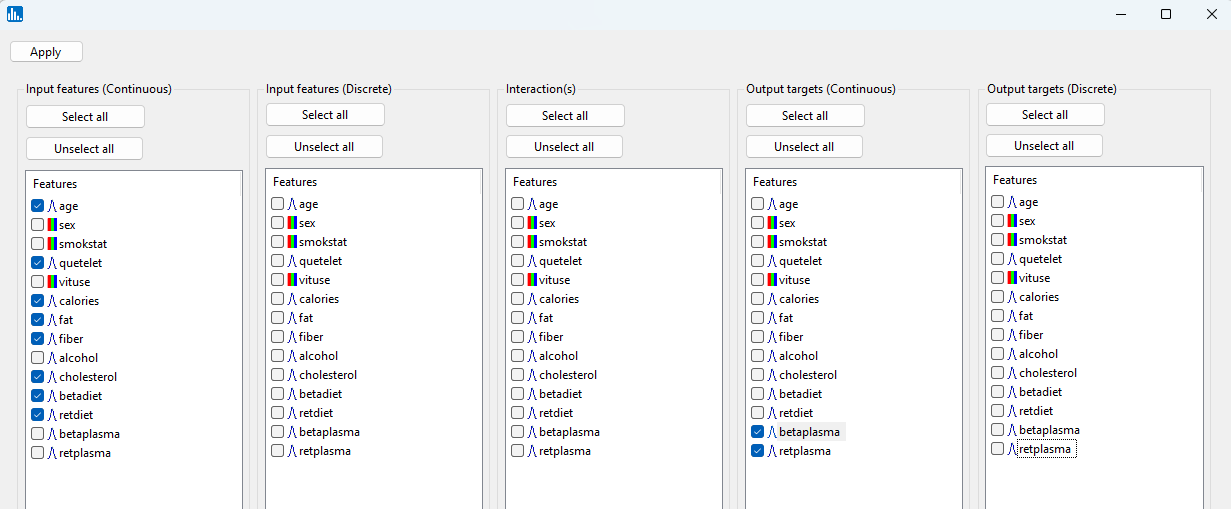
A popup window for feature selection will then appear (left, below):
Select the features that are highlighted in the various panels listed below:
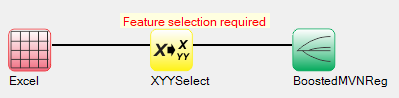
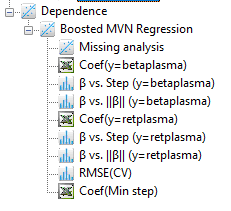
After you click on Apply (above popup window), the run will start, and the following output icons will appear:
When using the workflow (icons) for a pipeline, you can run all the tasks in the current workflow by clicking on the green-colored button shown below:
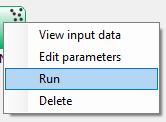
Otherwise, to run a single task in the workflow, then right-click on the specific green run-icon, and select Run:
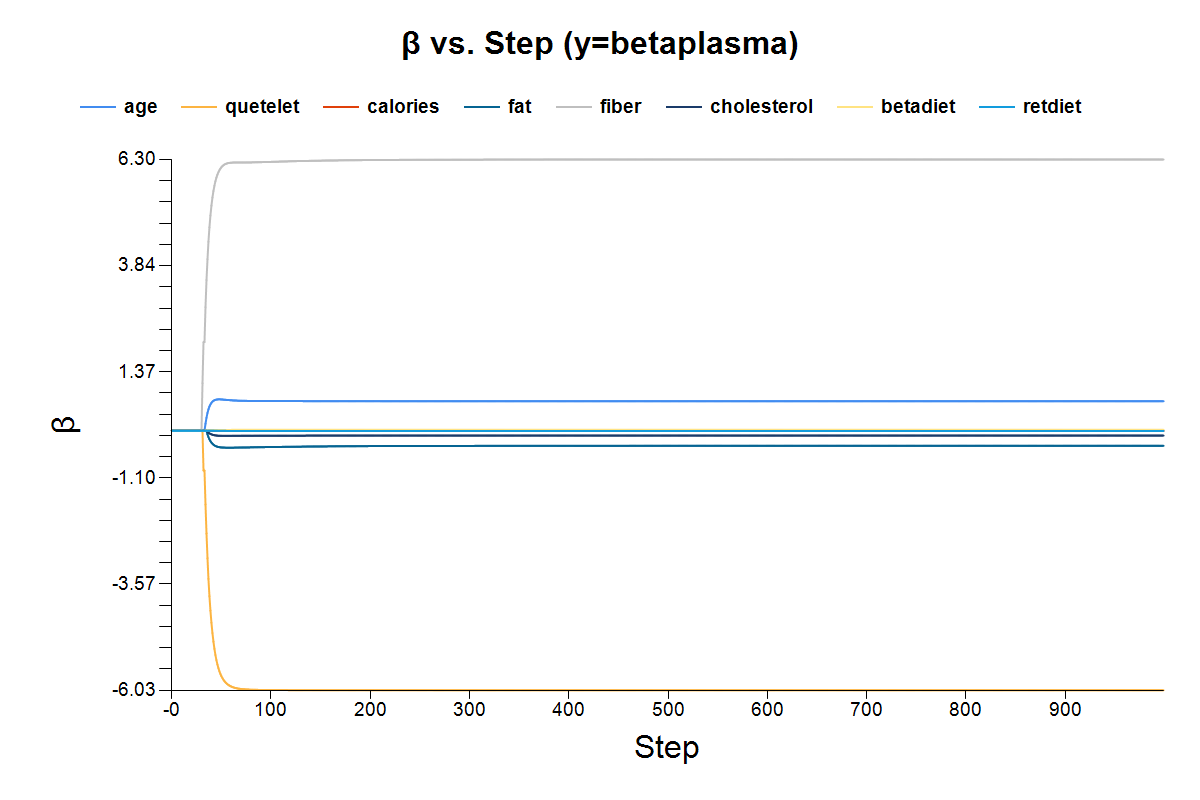
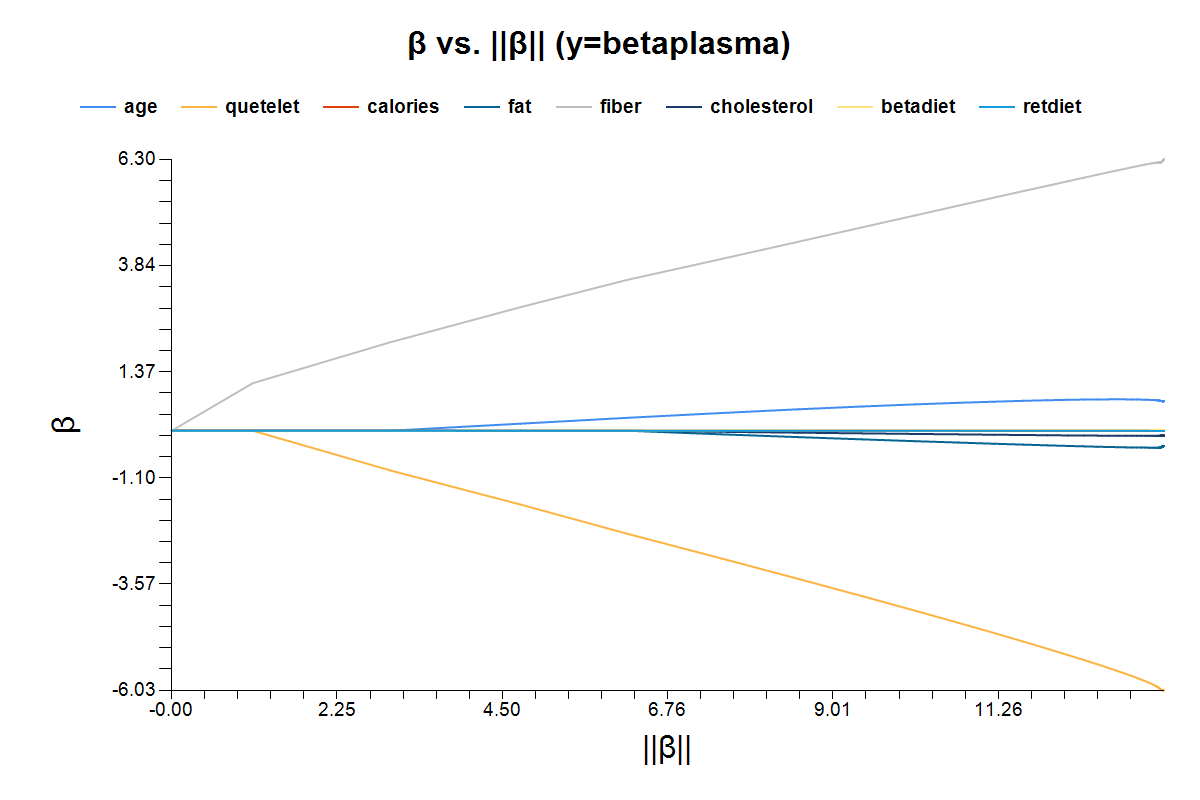
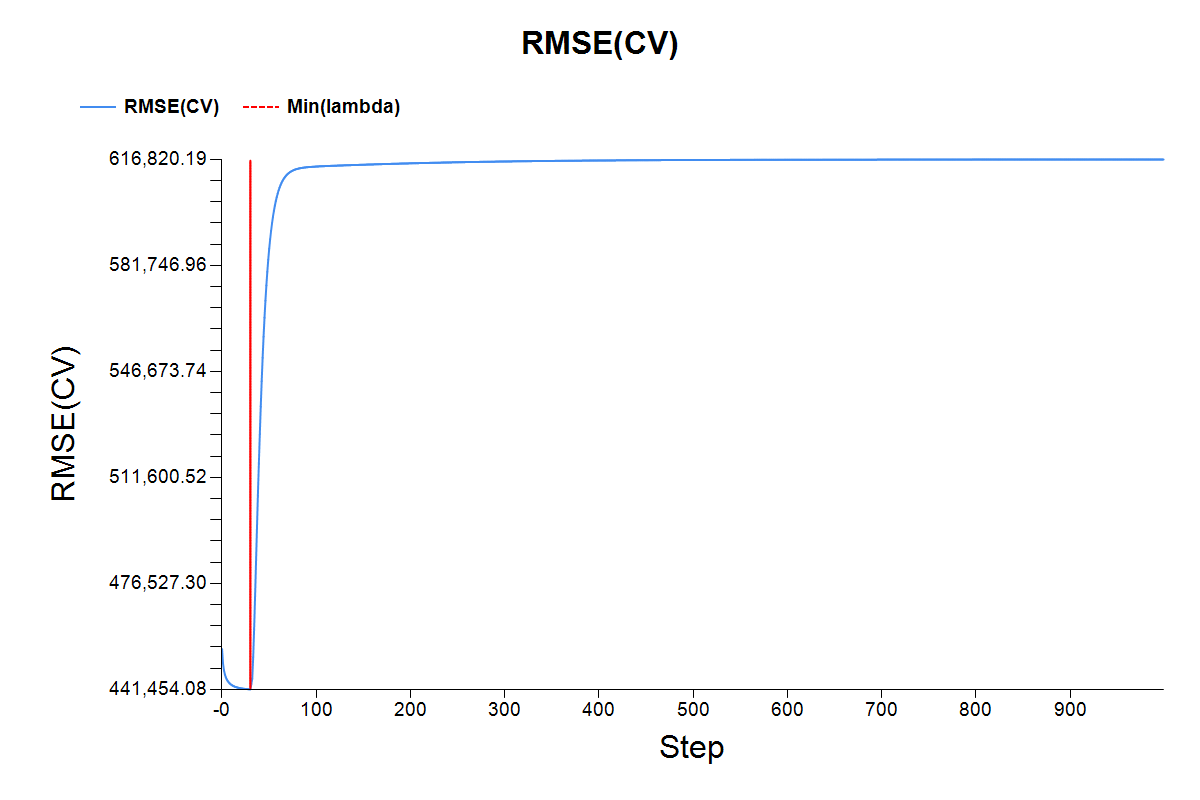
The images below show the result for clicking on the various output icons: