By pull-down menu:
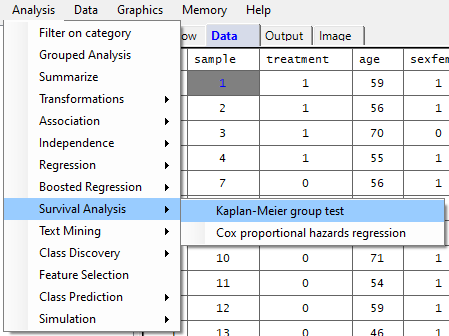
For this example run, we are using the PBC.xlsx dataset, which is distributed with Explorer CE. To perform Kaplan-Meier analysis, in the Analysis pull-down menu, select Survival Analysis and then Kaplan-Meier Group Test:
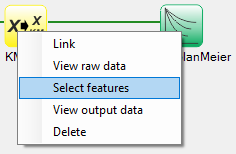
To select features for Kaplan-Meier analysis, right-click on the yellow KMSelect icon, and click on Select features:
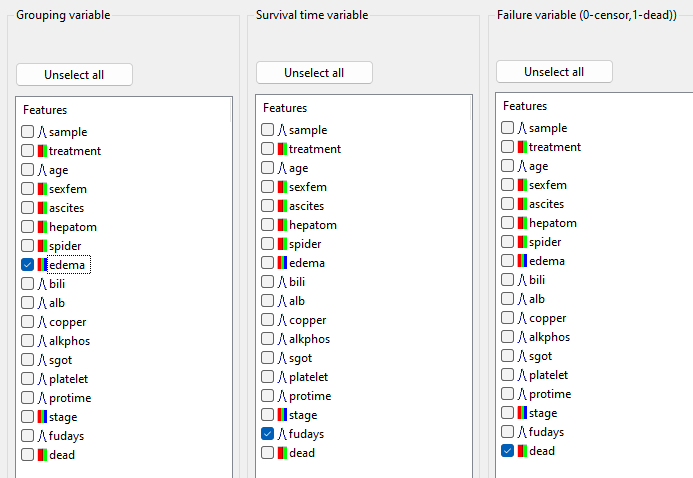
A popup window for feature selection will then appear (left, below):
Select the features that are highlighted in the various panels listed below:
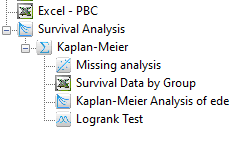
After you click on Apply (above popup window), the run will start, and the following output icons will appear:
When using the workflow (icons) for a pipeline, you can run all the tasks in the current workflow by clicking on the green-colored button shown below:
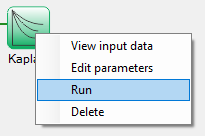
Otherwise, to run a single task in the workflow, then right-click on the specific green run-icon, and select Run:
The images below show the result for clicking on the various output icons:
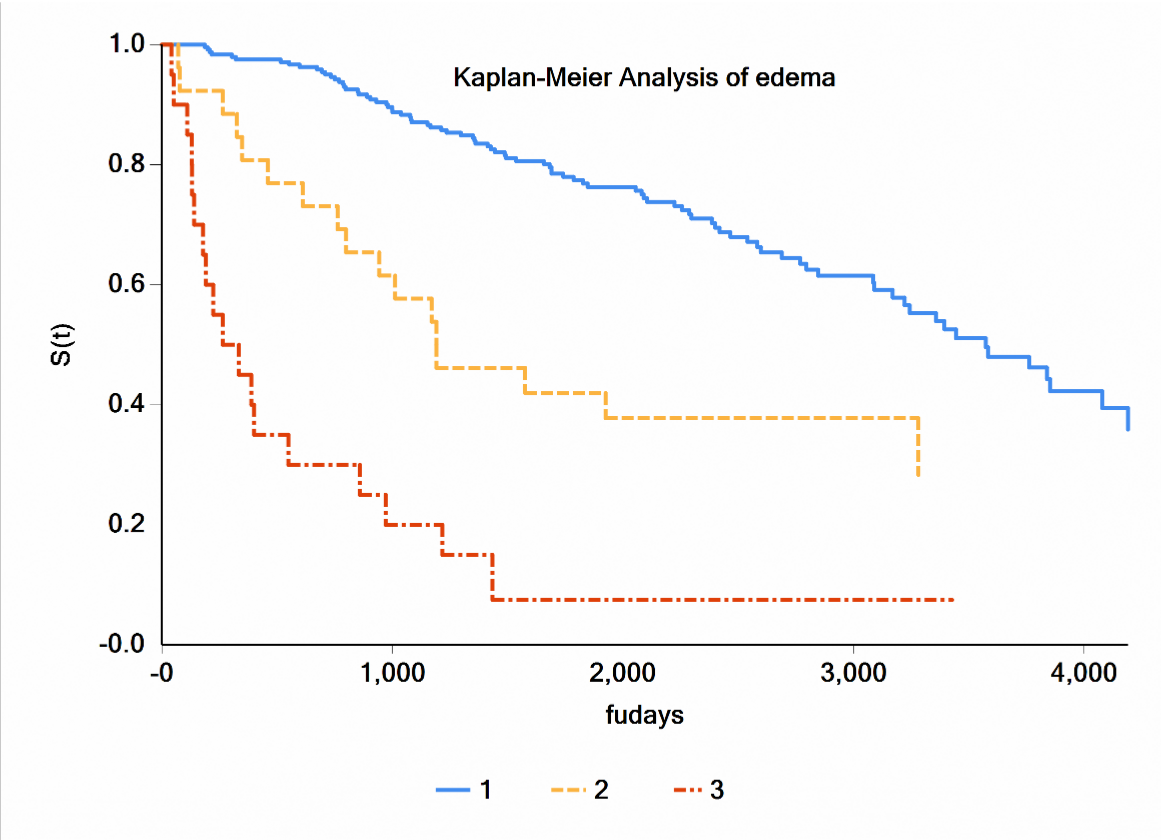
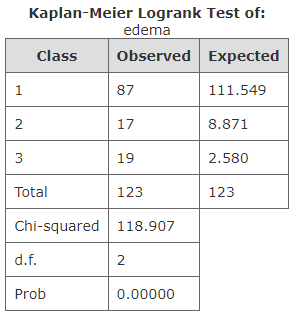
For this analysis, the number of groups for the edema categorical (group) variable is k=3. Since the logrank test is based on k-1 degrees of freedom, the calculated test statistic of 118.91 is compared with a quantile value from a 2 degree-of-freedom chi-squared distribution when the tail probability of 0.05, which is 5.99. Since the calculated test statistic of 118.91 is significantly greater than 5.99, we reject the null hypothesis that the survuval curves are not different, and accept the alternative hypothesis that the curves are significantly different from one another without any overlap.