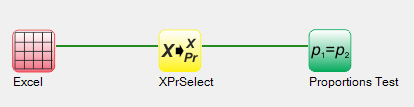
By pull-down menu:
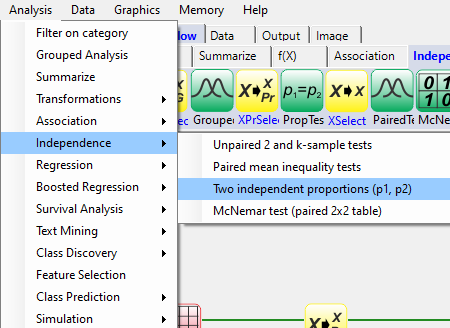
The data used for this example run of McNemar's test is the McNemer_data.xlsx Excel file, which is distributed with Explorer CE. To test for equality between two proportions, in the Analysis pull-down menu, select Independence and then Two independent proportions (p1, p2)
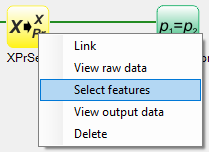
To select features to the proportions test, right-click on the yellow XPrSelect icon, and click on Select features:
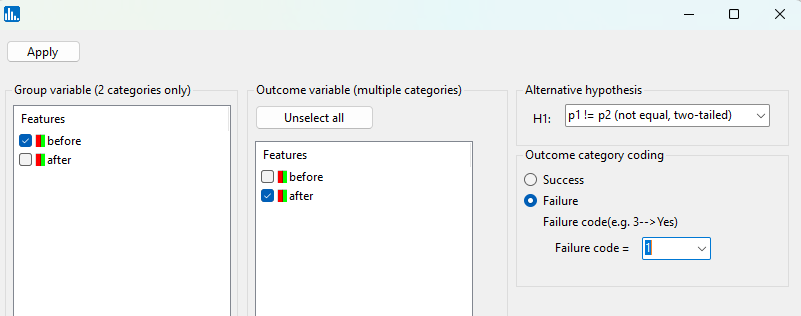
A popup window for feature selection will then appear (left, below):
The first popup you will see will show the features available. Select the features shown, and then specify a 1 as a failure, and leave the default two-tail test option:
Click on Apply, run the analysis, and then you will observe the following output icons:
When using the workflow (icons) for a pipeline, you can run all the tasks in the current workflow by clicking on the green-colored button shown below:
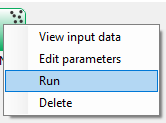
Otherwise, to run a single task in the workflow, then right-click on the specific green run-icon, and select Run:
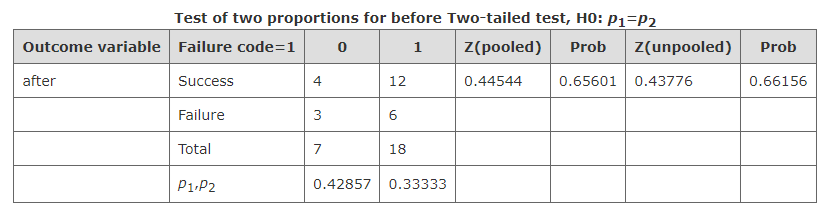
During the analysis, two tests are performed, one using unpooled standard error of p1 and p2, and one using pooled standard error. The test statistics for both are standard normal distributed (Z) as shown in the following table: