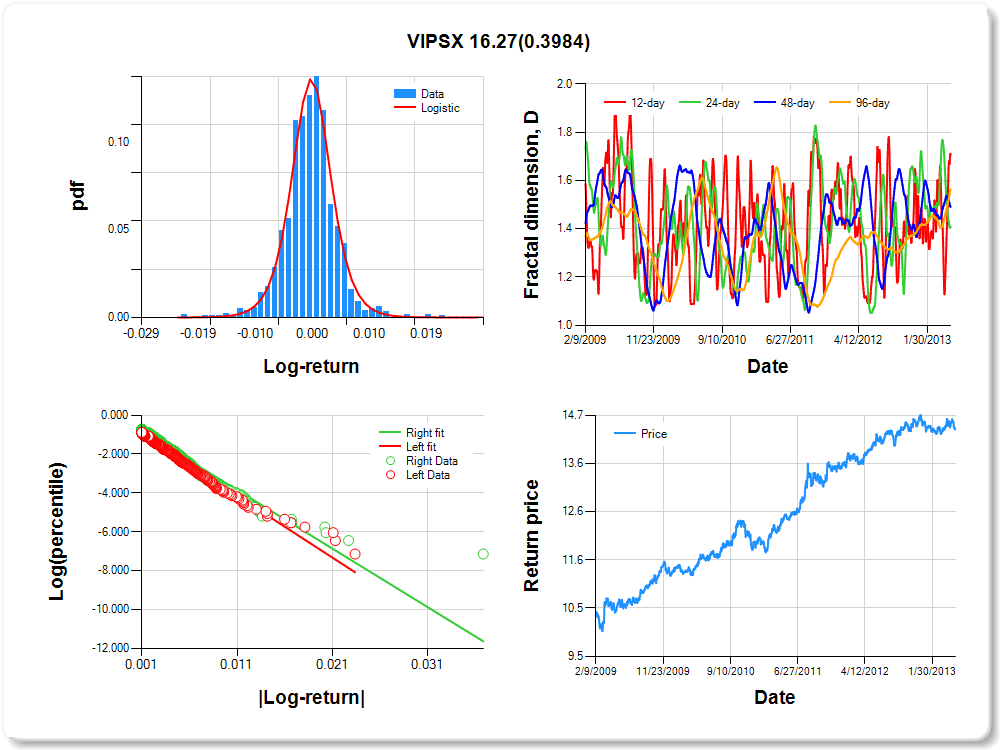
VPACX
Percentile values of daily loss(gain) in per cent
| 0.5 | 1 | 5 | 10 | 25 | 50 | 75 | 90 | 95 | 99 | 99.5 |
| -0.06 |
-0.05 |
-0.02 |
-0.02 |
-0.01 |
0.00 |
0.01 |
0.02 |
0.04 |
0.06 |
0.88 |
Daily log-return distribution fitting results
| Distribution | Location, a | Scale, b |
| Logistic |
-0.265 |
0.105 |
Linear regression results [Model: y=log(percentile of log-return), x=|log-return|]
| Variable | Coef(b) | s.e.(b) | t-value | P-value |
| Constant |
-0.885 |
0.058 |
-15.161 |
0.0000 |
|log-return| |
-79.328 |
3.469 |
-22.871 |
0.0000 |
I(right-tail) |
0.065 |
0.079 |
0.819 |
0.4128 |
|log-return|*I(right-tail) |
-3.629 |
4.919 |
-0.738 |
0.4607 |
Hurst exponent (of daily return price)
| 12-day | 24-day | 48-day | 96-day |
| 0.707 |
0.678 |
0.922 |
0.847 |
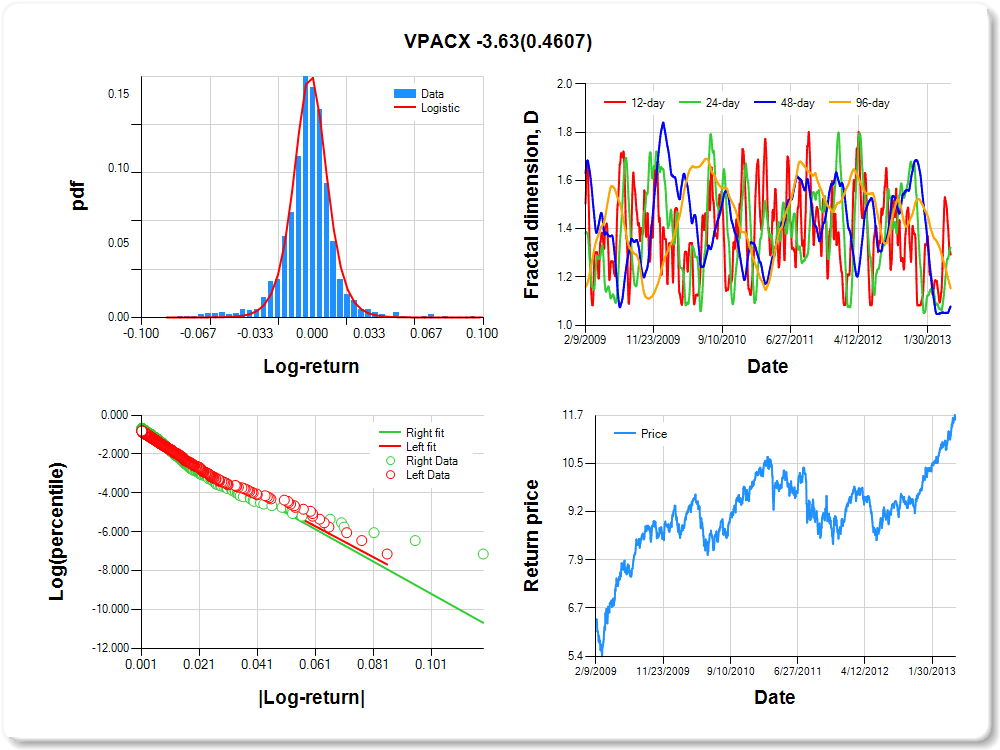
VWEHX
Percentile values of daily loss(gain) in per cent
| 0.5 | 1 | 5 | 10 | 25 | 50 | 75 | 90 | 95 | 99 | 99.5 |
| -0.02 |
-0.01 |
-0.01 |
0.00 |
0.00 |
0.00 |
0.00 |
0.01 |
0.02 |
0.02 |
0.00 |
Daily log-return distribution fitting results
| Distribution | Location, a | Scale, b |
| Laplace |
0.047 |
0.067 |
Linear regression results [Model: y=log(percentile of log-return), x=|log-return|]
| Variable | Coef(b) | s.e.(b) | t-value | P-value |
| Constant |
-1.487 |
0.088 |
-16.858 |
0.0000 |
|log-return| |
-238.060 |
15.283 |
-15.577 |
0.0000 |
I(right-tail) |
0.395 |
0.110 |
3.575 |
0.0004 |
|log-return|*I(right-tail) |
34.221 |
18.375 |
1.862 |
0.0630 |
Hurst exponent (of daily return price)
| 12-day | 24-day | 48-day | 96-day |
| 0.851 |
0.949 |
0.706 |
0.847 |
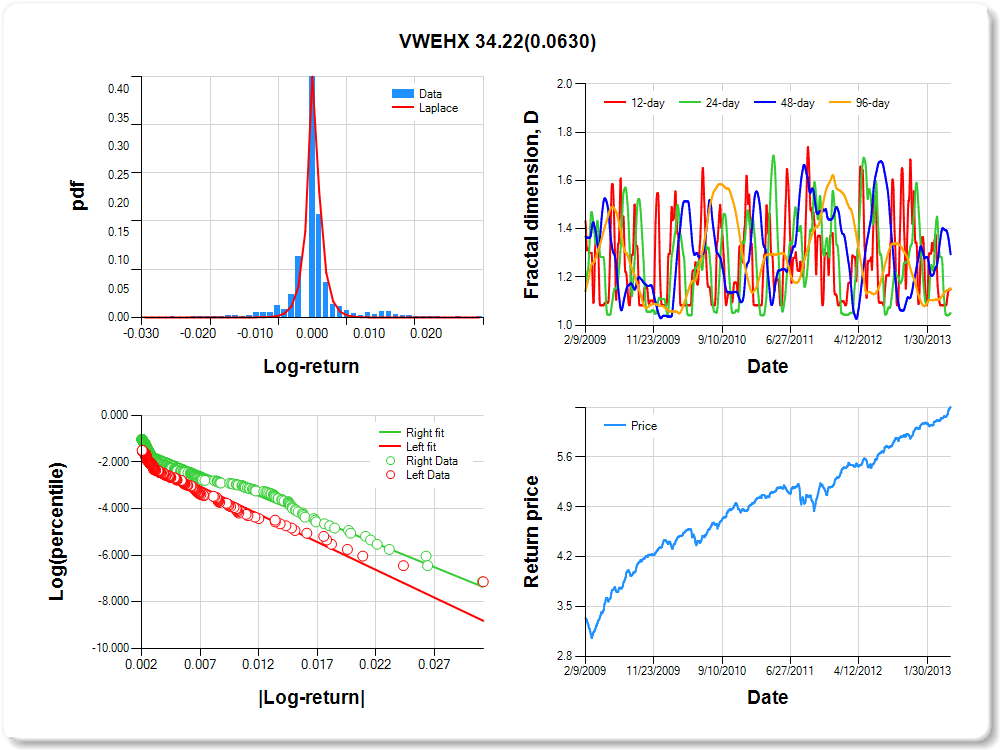
VFSTX
Percentile values of daily loss(gain) in per cent
| 0.5 | 1 | 5 | 10 | 25 | 50 | 75 | 90 | 95 | 99 | 99.5 |
| -0.01 |
0.00 |
0.00 |
0.00 |
0.00 |
0.00 |
0.00 |
0.00 |
0.01 |
0.01 |
0.84 |
Daily log-return distribution fitting results
| Distribution | Location, a | Scale, b |
| Cauchy |
0.105 |
0.047 |
Linear regression results [Model: y=log(percentile of log-return), x=|log-return|]
| Variable | Coef(b) | s.e.(b) | t-value | P-value |
| Constant |
-1.206 |
0.094 |
-12.817 |
0.0000 |
|log-return| |
-761.247 |
47.985 |
-15.864 |
0.0000 |
I(right-tail) |
0.259 |
0.123 |
2.111 |
0.0351 |
|log-return|*I(right-tail) |
135.881 |
58.112 |
2.338 |
0.0196 |
Hurst exponent (of daily return price)
| 12-day | 24-day | 48-day | 96-day |
| NaN |
0.889 |
0.754 |
0.834 |
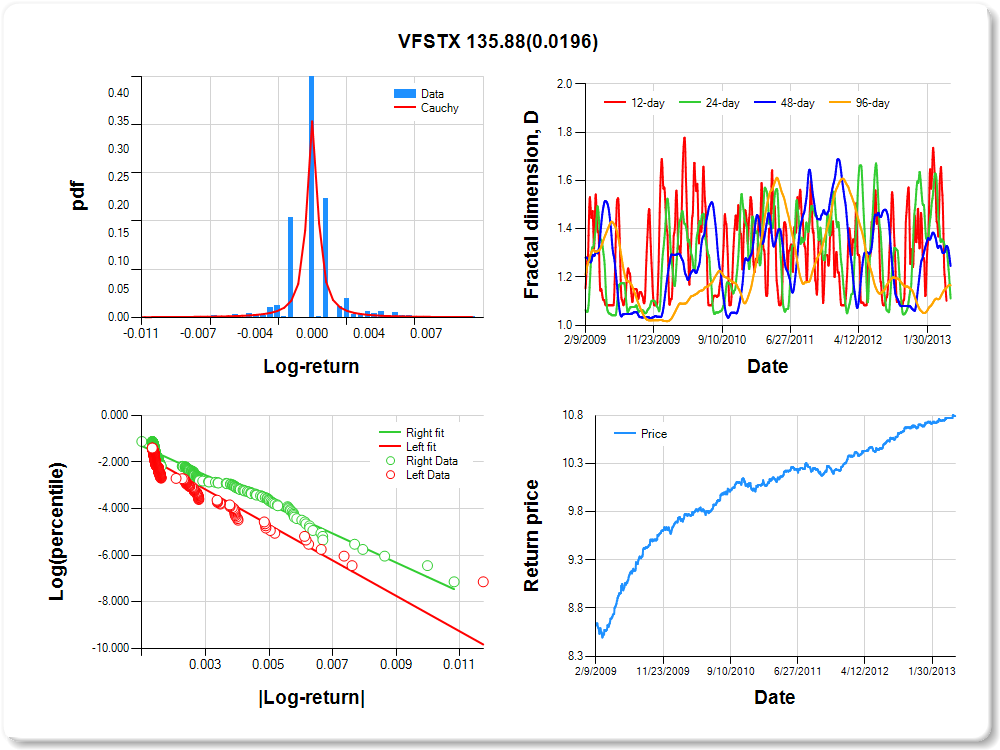
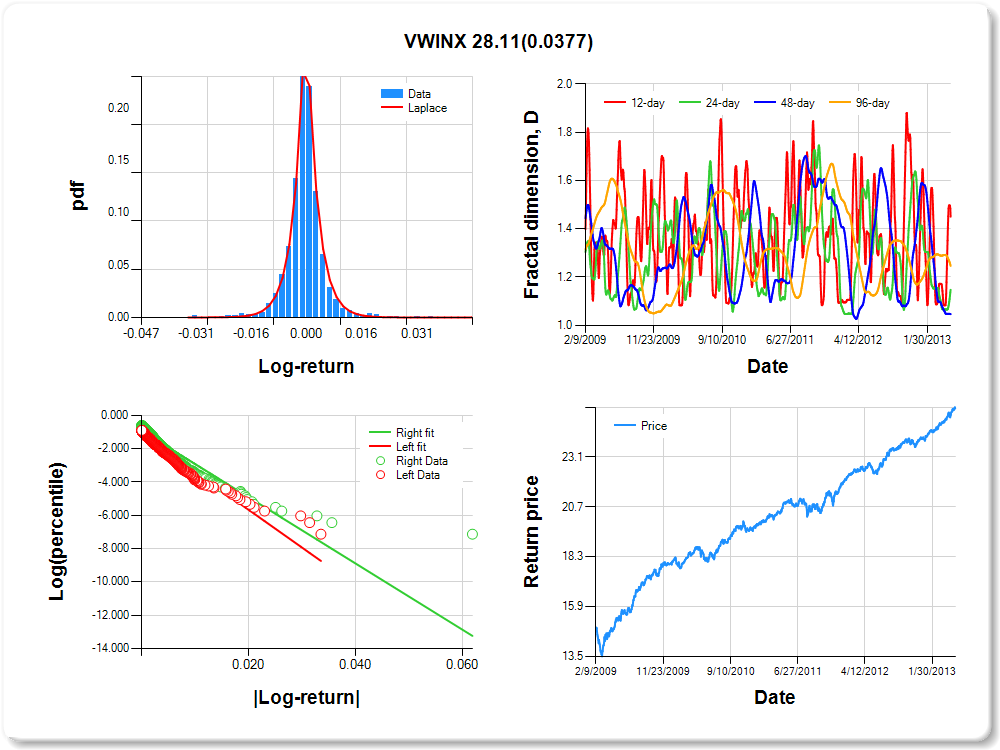
VWINX
Percentile values of daily loss(gain) in per cent
| 0.5 | 1 | 5 | 10 | 25 | 50 | 75 | 90 | 95 | 99 | 99.5 |
| -0.02 |
-0.02 |
-0.01 |
0.00 |
0.00 |
0.00 |
0.00 |
0.01 |
0.02 |
0.02 |
0.90 |
Daily log-return distribution fitting results
| Distribution | Location, a | Scale, b |
| Laplace |
-0.484 |
0.113 |
Linear regression results [Model: y=log(percentile of log-return), x=|log-return|]
| Variable | Coef(b) | s.e.(b) | t-value | P-value |
| Constant |
-1.053 |
0.059 |
-17.720 |
0.0000 |
|log-return| |
-226.901 |
10.591 |
-21.423 |
0.0000 |
I(right-tail) |
0.183 |
0.077 |
2.359 |
0.0185 |
|log-return|*I(right-tail) |
28.107 |
13.511 |
2.080 |
0.0377 |
Hurst exponent (of daily return price)
| 12-day | 24-day | 48-day | 96-day |
| 0.550 |
0.853 |
0.954 |
0.754 |
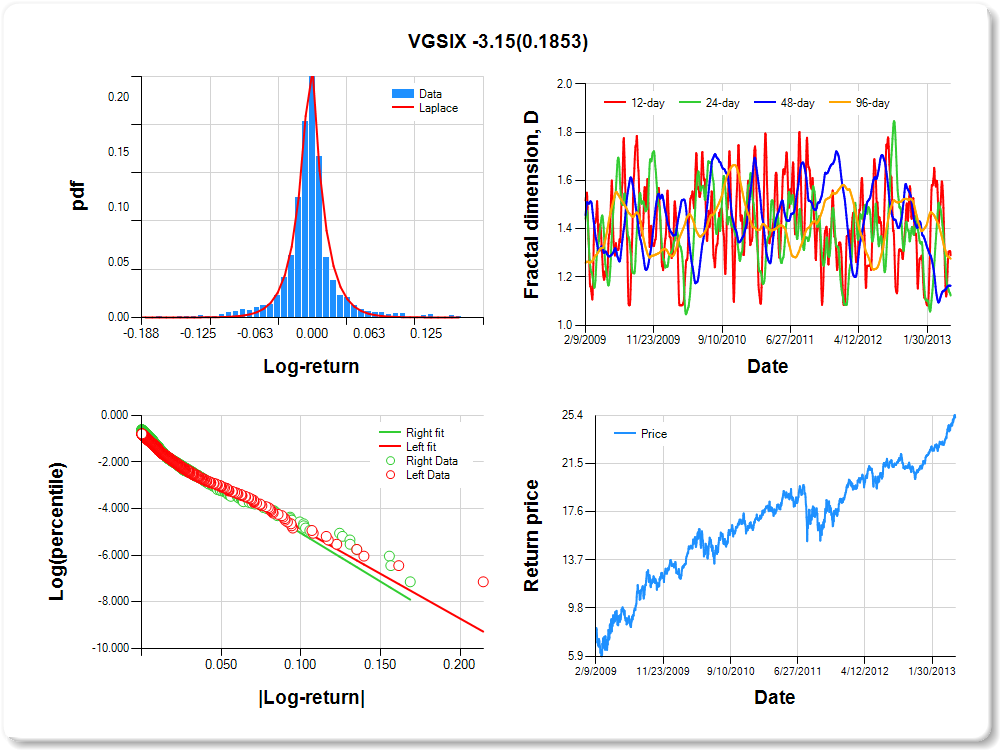
VGSIX
Percentile values of daily loss(gain) in per cent
| 0.5 | 1 | 5 | 10 | 25 | 50 | 75 | 90 | 95 | 99 | 99.5 |
| -0.11 |
-0.09 |
-0.05 |
-0.03 |
-0.01 |
0.00 |
0.01 |
0.05 |
0.10 |
0.13 |
0.35 |
Daily log-return distribution fitting results
| Distribution | Location, a | Scale, b |
| Laplace |
0.219 |
0.131 |
Linear regression results [Model: y=log(percentile of log-return), x=|log-return|]
| Variable | Coef(b) | s.e.(b) | t-value | P-value |
| Constant |
-1.024 |
0.054 |
-19.039 |
0.0000 |
|log-return| |
-38.401 |
1.680 |
-22.860 |
0.0000 |
I(right-tail) |
0.140 |
0.072 |
1.933 |
0.0534 |
|log-return|*I(right-tail) |
-3.146 |
2.373 |
-1.325 |
0.1853 |
Hurst exponent (of daily return price)
| 12-day | 24-day | 48-day | 96-day |
| 0.710 |
0.876 |
0.836 |
0.724 |
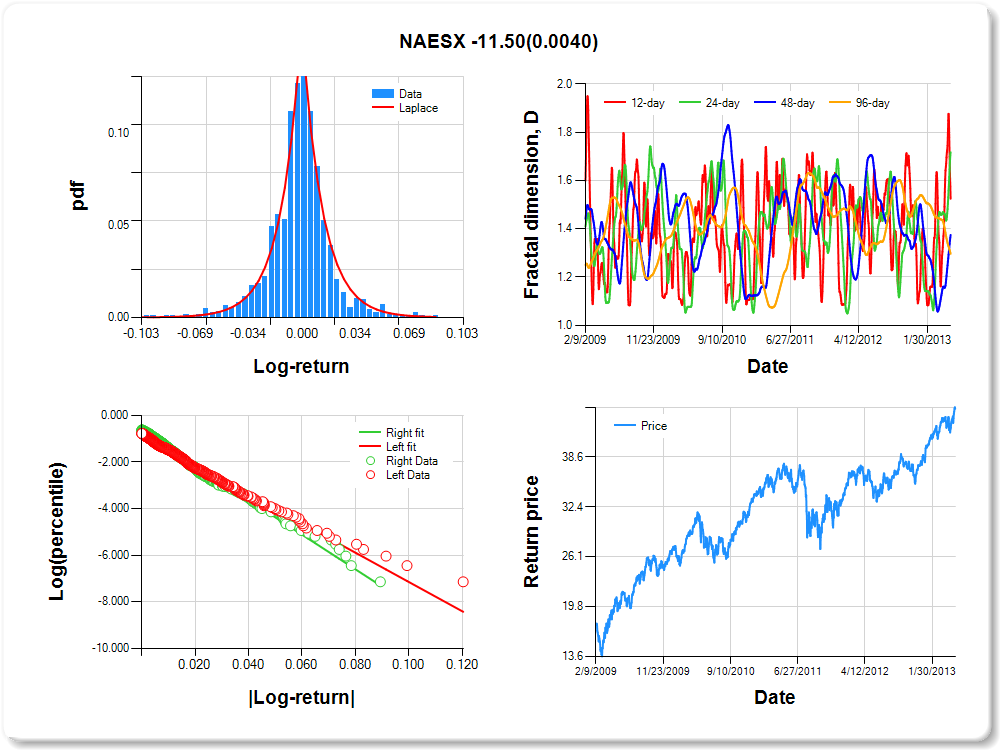
NAESX
Percentile values of daily loss(gain) in per cent
| 0.5 | 1 | 5 | 10 | 25 | 50 | 75 | 90 | 95 | 99 | 99.5 |
| -0.07 |
-0.06 |
-0.03 |
-0.02 |
-0.01 |
0.00 |
0.01 |
0.03 |
0.06 |
0.07 |
0.93 |
Daily log-return distribution fitting results
| Distribution | Location, a | Scale, b |
| Laplace |
0.279 |
0.217 |
Linear regression results [Model: y=log(percentile of log-return), x=|log-return|]
| Variable | Coef(b) | s.e.(b) | t-value | P-value |
| Constant |
-0.863 |
0.057 |
-15.089 |
0.0000 |
|log-return| |
-62.725 |
2.687 |
-23.343 |
0.0000 |
I(right-tail) |
0.212 |
0.079 |
2.677 |
0.0075 |
|log-return|*I(right-tail) |
-11.500 |
3.984 |
-2.887 |
0.0040 |
Hurst exponent (of daily return price)
| 12-day | 24-day | 48-day | 96-day |
| 0.475 |
0.283 |
0.625 |
0.704 |
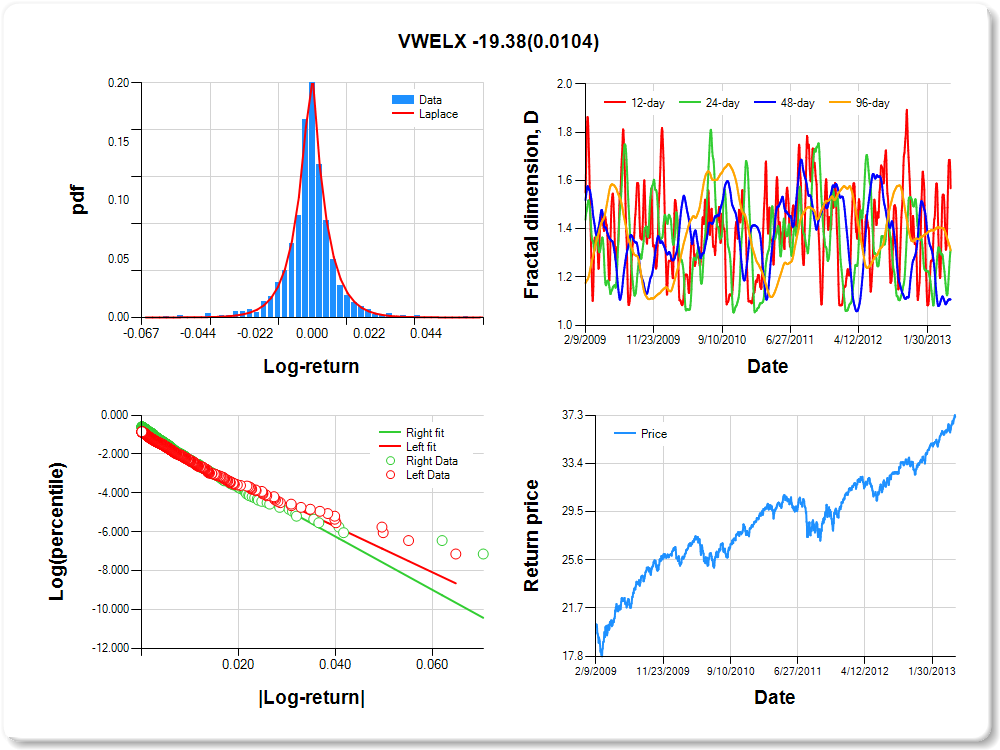
VWELX
Percentile values of daily loss(gain) in per cent
| 0.5 | 1 | 5 | 10 | 25 | 50 | 75 | 90 | 95 | 99 | 99.5 |
| -0.04 |
-0.03 |
-0.01 |
-0.01 |
0.00 |
0.00 |
0.00 |
0.01 |
0.03 |
0.03 |
0.00 |
Daily log-return distribution fitting results
| Distribution | Location, a | Scale, b |
| Laplace |
-0.051 |
0.150 |
Linear regression results [Model: y=log(percentile of log-return), x=|log-return|]
| Variable | Coef(b) | s.e.(b) | t-value | P-value |
| Constant |
-0.997 |
0.057 |
-17.458 |
0.0000 |
|log-return| |
-117.531 |
5.248 |
-22.394 |
0.0000 |
I(right-tail) |
0.265 |
0.077 |
3.459 |
0.0006 |
|log-return|*I(right-tail) |
-19.380 |
7.555 |
-2.565 |
0.0104 |
Hurst exponent (of daily return price)
| 12-day | 24-day | 48-day | 96-day |
| 0.432 |
0.688 |
0.893 |
0.690 |
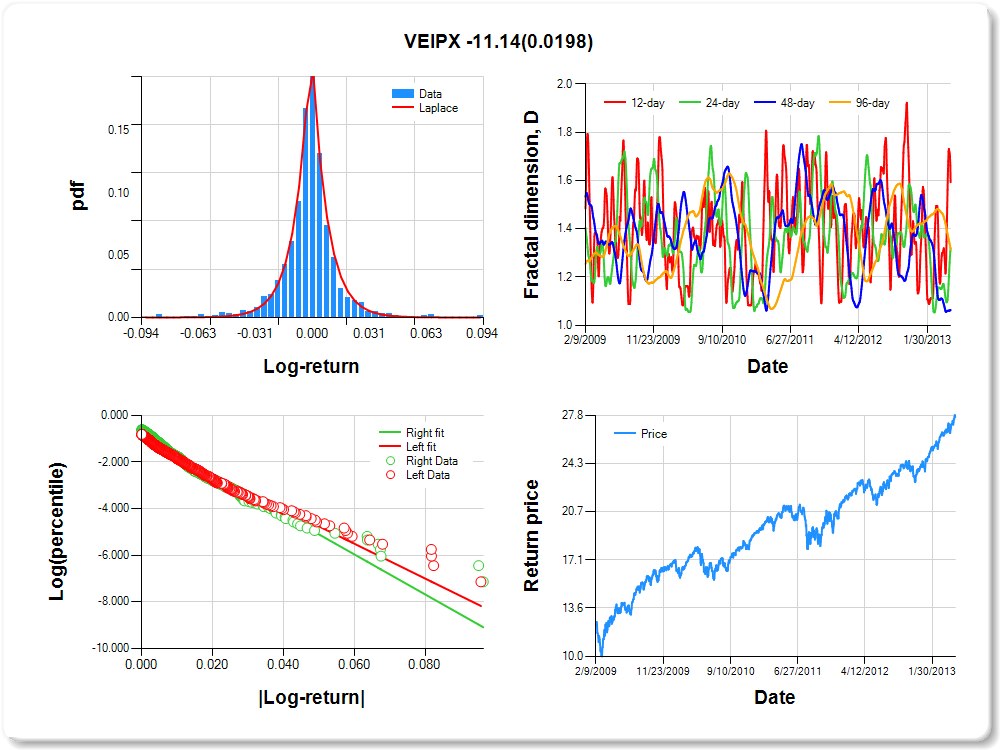
VEIPX
Percentile values of daily loss(gain) in per cent
| 0.5 | 1 | 5 | 10 | 25 | 50 | 75 | 90 | 95 | 99 | 99.5 |
| -0.06 |
-0.05 |
-0.02 |
-0.02 |
-0.01 |
0.00 |
0.01 |
0.02 |
0.04 |
0.07 |
0.04 |
Daily log-return distribution fitting results
| Distribution | Location, a | Scale, b |
| Laplace |
0.014 |
0.152 |
Linear regression results [Model: y=log(percentile of log-return), x=|log-return|]
| Variable | Coef(b) | s.e.(b) | t-value | P-value |
| Constant |
-1.002 |
0.056 |
-18.002 |
0.0000 |
|log-return| |
-74.672 |
3.297 |
-22.646 |
0.0000 |
I(right-tail) |
0.215 |
0.075 |
2.848 |
0.0045 |
|log-return|*I(right-tail) |
-11.143 |
4.775 |
-2.333 |
0.0198 |
Hurst exponent (of daily return price)
| 12-day | 24-day | 48-day | 96-day |
| 0.407 |
0.681 |
0.937 |
0.686 |
VTI
Percentile values of daily loss(gain) in per cent
| 0.5 | 1 | 5 | 10 | 25 | 50 | 75 | 90 | 95 | 99 | 99.5 |
| -0.06 |
-0.05 |
-0.03 |
-0.02 |
-0.01 |
0.00 |
0.01 |
0.02 |
0.05 |
0.06 |
0.27 |
Daily log-return distribution fitting results
| Distribution | Location, a | Scale, b |
| Laplace |
-0.152 |
0.144 |
Linear regression results [Model: y=log(percentile of log-return), x=|log-return|]
| Variable | Coef(b) | s.e.(b) | t-value | P-value |
| Constant |
-0.967 |
0.056 |
-17.157 |
0.0000 |
|log-return| |
-72.491 |
3.174 |
-22.837 |
0.0000 |
I(right-tail) |
0.209 |
0.076 |
2.763 |
0.0058 |
|log-return|*I(right-tail) |
-11.767 |
4.618 |
-2.548 |
0.0110 |
Hurst exponent (of daily return price)
| 12-day | 24-day | 48-day | 96-day |
| 0.431 |
0.500 |
0.829 |
0.686 |

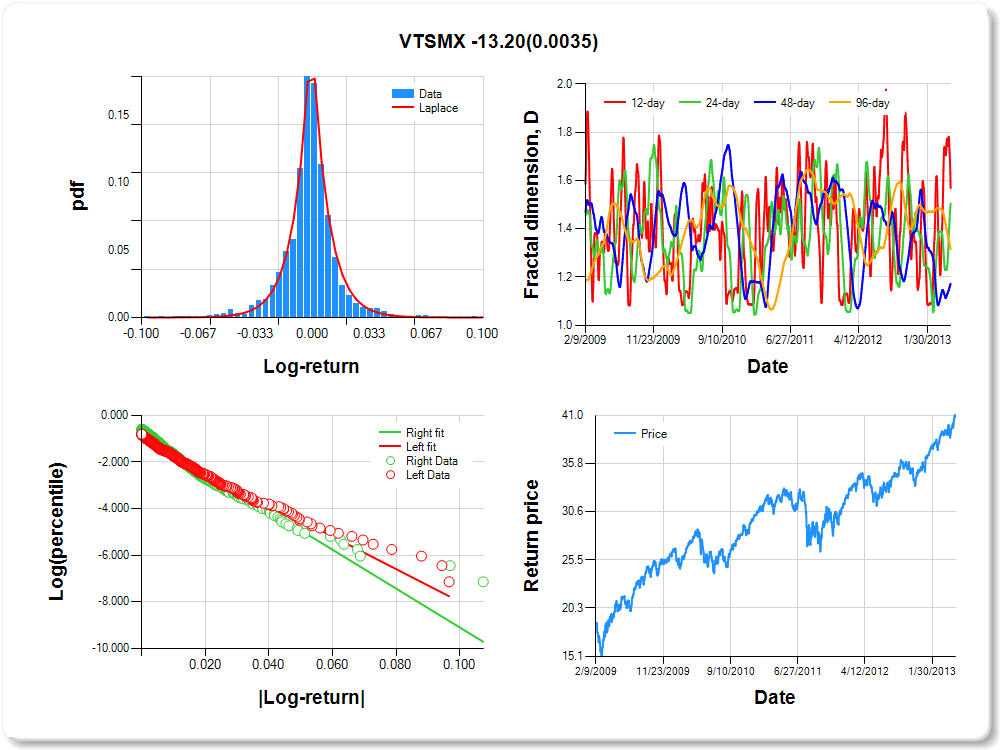
VTSMX
Percentile values of daily loss(gain) in per cent
| 0.5 | 1 | 5 | 10 | 25 | 50 | 75 | 90 | 95 | 99 | 99.5 |
| -0.07 |
-0.05 |
-0.03 |
-0.02 |
-0.01 |
0.00 |
0.01 |
0.02 |
0.05 |
0.06 |
1.06 |
Daily log-return distribution fitting results
| Distribution | Location, a | Scale, b |
| Laplace |
-0.068 |
0.158 |
Linear regression results [Model: y=log(percentile of log-return), x=|log-return|]
| Variable | Coef(b) | s.e.(b) | t-value | P-value |
| Constant |
-0.981 |
0.056 |
-17.607 |
0.0000 |
|log-return| |
-69.966 |
3.063 |
-22.843 |
0.0000 |
I(right-tail) |
0.224 |
0.075 |
2.969 |
0.0030 |
|log-return|*I(right-tail) |
-13.200 |
4.509 |
-2.927 |
0.0035 |
Hurst exponent (of daily return price)
| 12-day | 24-day | 48-day | 96-day |
| 0.431 |
0.495 |
0.828 |
0.685 |
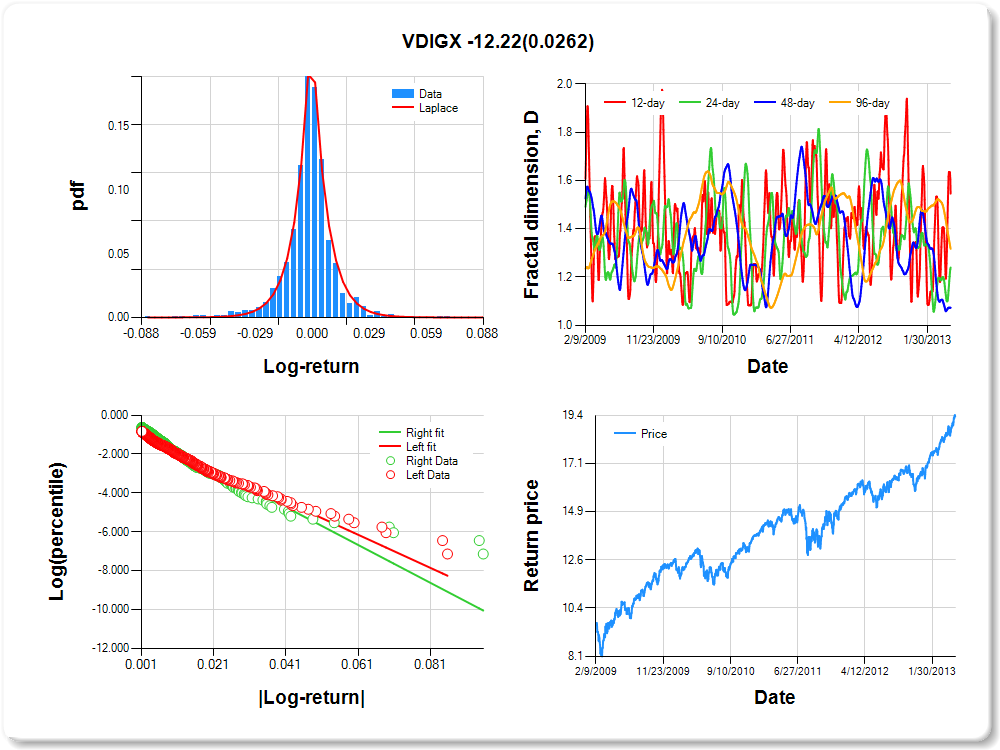
VDIGX
Percentile values of daily loss(gain) in per cent
| 0.5 | 1 | 5 | 10 | 25 | 50 | 75 | 90 | 95 | 99 | 99.5 |
| -0.06 |
-0.04 |
-0.02 |
-0.01 |
0.00 |
0.00 |
0.01 |
0.02 |
0.04 |
0.04 |
1.03 |
Daily log-return distribution fitting results
| Distribution | Location, a | Scale, b |
| Laplace |
-0.071 |
0.146 |
Linear regression results [Model: y=log(percentile of log-return), x=|log-return|]
| Variable | Coef(b) | s.e.(b) | t-value | P-value |
| Constant |
-1.006 |
0.056 |
-17.942 |
0.0000 |
|log-return| |
-84.983 |
3.773 |
-22.522 |
0.0000 |
I(right-tail) |
0.215 |
0.076 |
2.825 |
0.0048 |
|log-return|*I(right-tail) |
-12.223 |
5.491 |
-2.226 |
0.0262 |
Hurst exponent (of daily return price)
| 12-day | 24-day | 48-day | 96-day |
| 0.454 |
0.760 |
0.927 |
0.683 |
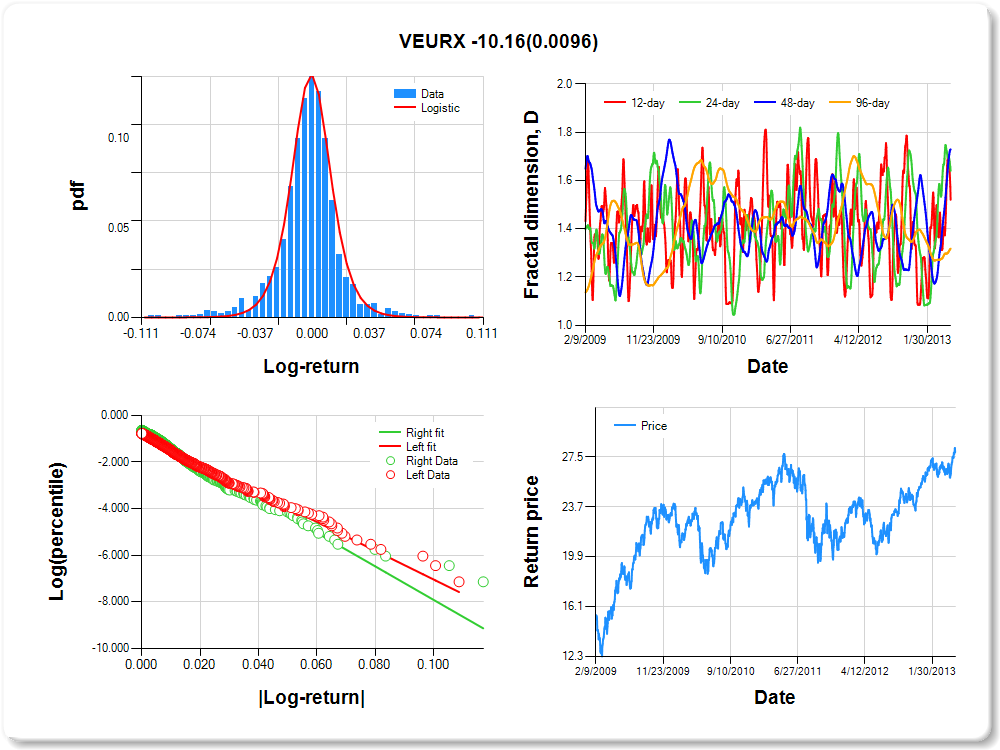
VEURX
Percentile values of daily loss(gain) in per cent
| 0.5 | 1 | 5 | 10 | 25 | 50 | 75 | 90 | 95 | 99 | 99.5 |
| -0.07 |
-0.06 |
-0.03 |
-0.02 |
-0.01 |
0.00 |
0.01 |
0.03 |
0.06 |
0.07 |
2.55 |
Daily log-return distribution fitting results
| Distribution | Location, a | Scale, b |
| Logistic |
-0.041 |
0.126 |
Linear regression results [Model: y=log(percentile of log-return), x=|log-return|]
| Variable | Coef(b) | s.e.(b) | t-value | P-value |
| Constant |
-0.855 |
0.057 |
-14.956 |
0.0000 |
|log-return| |
-61.627 |
2.636 |
-23.379 |
0.0000 |
I(right-tail) |
0.147 |
0.079 |
1.865 |
0.0625 |
|log-return|*I(right-tail) |
-10.155 |
3.912 |
-2.596 |
0.0096 |
Hurst exponent (of daily return price)
| 12-day | 24-day | 48-day | 96-day |
| 0.480 |
0.359 |
0.271 |
0.682 |
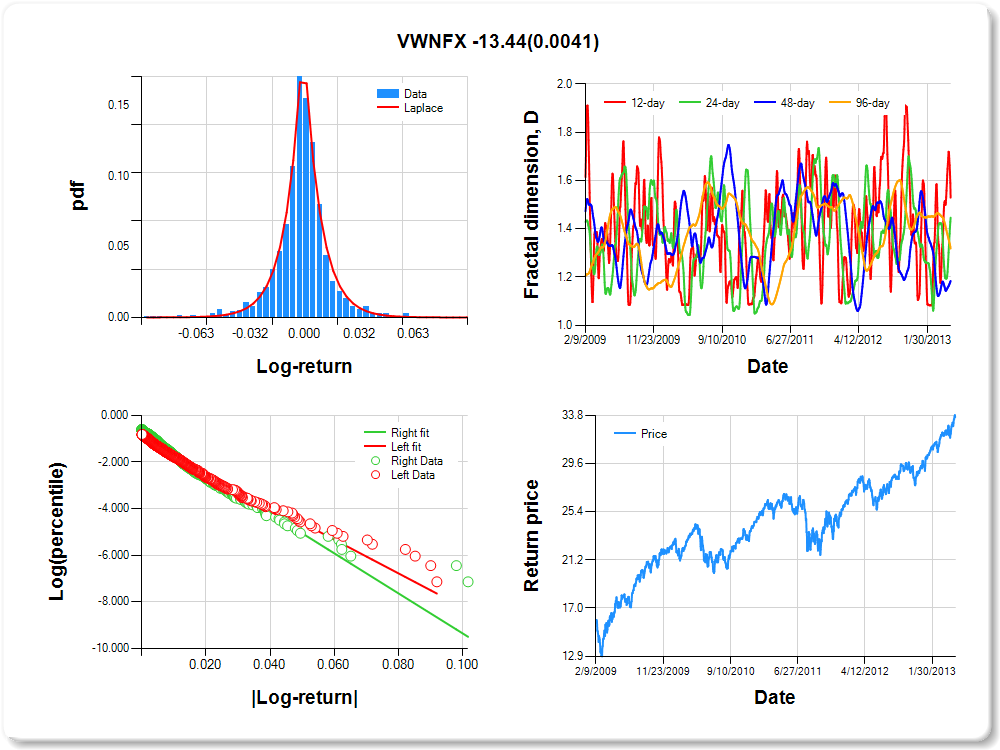
VWNFX
Percentile values of daily loss(gain) in per cent
| 0.5 | 1 | 5 | 10 | 25 | 50 | 75 | 90 | 95 | 99 | 99.5 |
| -0.07 |
-0.05 |
-0.02 |
-0.02 |
-0.01 |
0.00 |
0.01 |
0.02 |
0.04 |
0.06 |
0.68 |
Daily log-return distribution fitting results
| Distribution | Location, a | Scale, b |
| Laplace |
-0.069 |
0.170 |
Linear regression results [Model: y=log(percentile of log-return), x=|log-return|]
| Variable | Coef(b) | s.e.(b) | t-value | P-value |
| Constant |
-0.972 |
0.057 |
-17.191 |
0.0000 |
|log-return| |
-72.284 |
3.186 |
-22.690 |
0.0000 |
I(right-tail) |
0.223 |
0.076 |
2.919 |
0.0036 |
|log-return|*I(right-tail) |
-13.445 |
4.673 |
-2.877 |
0.0041 |
Hurst exponent (of daily return price)
| 12-day | 24-day | 48-day | 96-day |
| 0.471 |
0.554 |
0.816 |
0.682 |
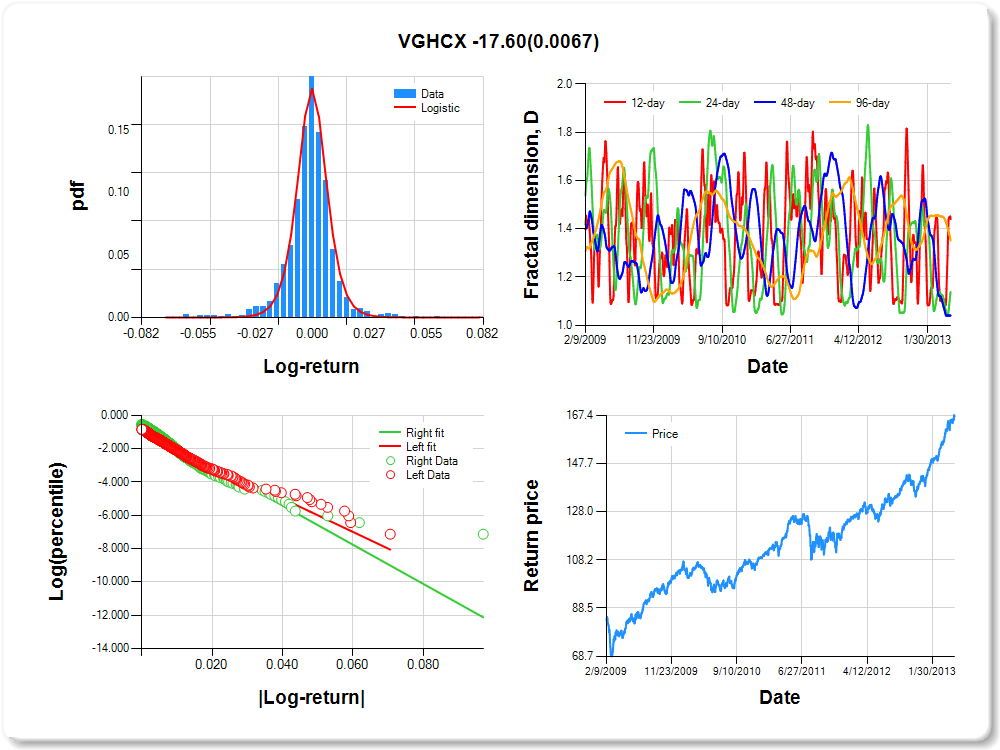
VGHCX
Percentile values of daily loss(gain) in per cent
| 0.5 | 1 | 5 | 10 | 25 | 50 | 75 | 90 | 95 | 99 | 99.5 |
| -0.05 |
-0.04 |
-0.02 |
-0.01 |
0.00 |
0.00 |
0.01 |
0.02 |
0.03 |
0.04 |
0.82 |
Daily log-return distribution fitting results
| Distribution | Location, a | Scale, b |
| Logistic |
-0.241 |
0.094 |
Linear regression results [Model: y=log(percentile of log-return), x=|log-return|]
| Variable | Coef(b) | s.e.(b) | t-value | P-value |
| Constant |
-0.995 |
0.058 |
-17.308 |
0.0000 |
|log-return| |
-100.017 |
4.485 |
-22.301 |
0.0000 |
I(right-tail) |
0.288 |
0.077 |
3.753 |
0.0002 |
|log-return|*I(right-tail) |
-17.597 |
6.482 |
-2.715 |
0.0067 |
Hurst exponent (of daily return price)
| 12-day | 24-day | 48-day | 96-day |
| 0.559 |
0.862 |
0.959 |
0.649 |
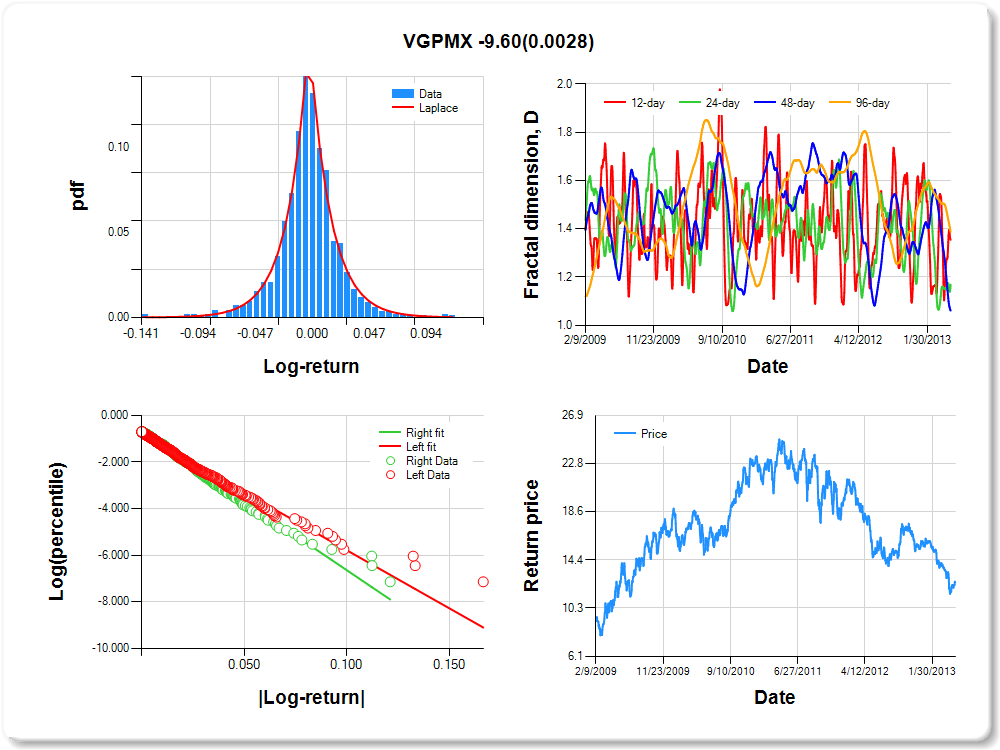
VGPMX
Percentile values of daily loss(gain) in per cent
| 0.5 | 1 | 5 | 10 | 25 | 50 | 75 | 90 | 95 | 99 | 99.5 |
| -0.09 |
-0.08 |
-0.04 |
-0.03 |
-0.01 |
0.00 |
0.01 |
0.04 |
0.06 |
0.08 |
1.28 |
Daily log-return distribution fitting results
| Distribution | Location, a | Scale, b |
| Laplace |
0.270 |
0.207 |
Linear regression results [Model: y=log(percentile of log-return), x=|log-return|]
| Variable | Coef(b) | s.e.(b) | t-value | P-value |
| Constant |
-0.795 |
0.055 |
-14.517 |
0.0000 |
|log-return| |
-49.758 |
2.056 |
-24.196 |
0.0000 |
I(right-tail) |
0.108 |
0.080 |
1.351 |
0.1770 |
|log-return|*I(right-tail) |
-9.595 |
3.204 |
-2.995 |
0.0028 |
Hurst exponent (of daily return price)
| 12-day | 24-day | 48-day | 96-day |
| 0.645 |
0.832 |
0.939 |
0.613 |
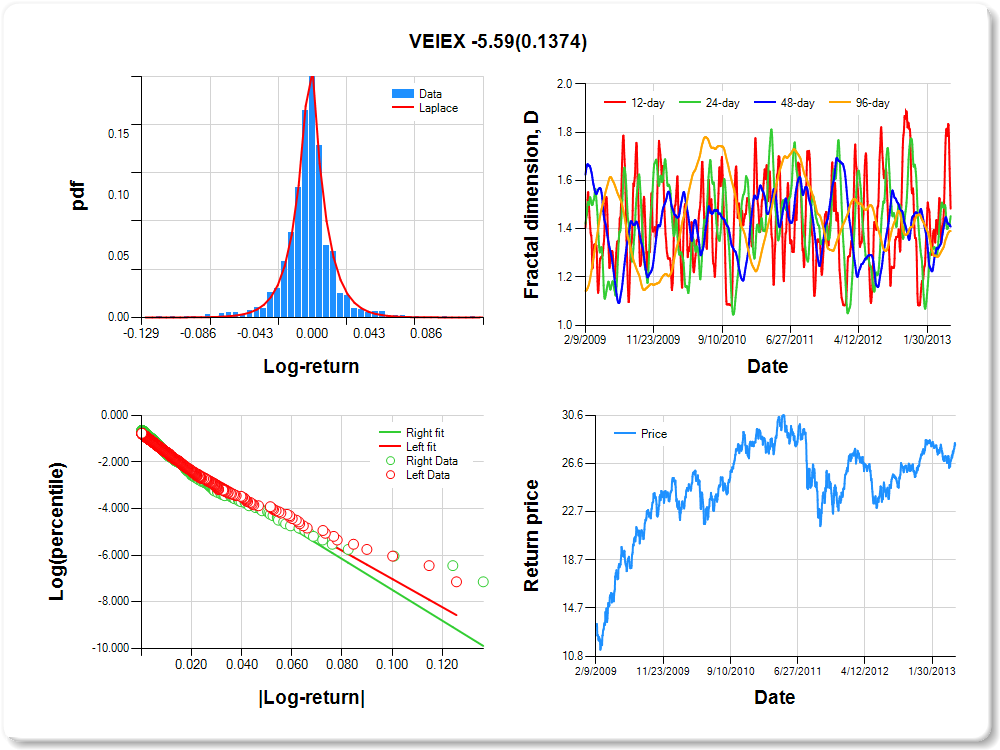
VEIEX
Percentile values of daily loss(gain) in per cent
| 0.5 | 1 | 5 | 10 | 25 | 50 | 75 | 90 | 95 | 99 | 99.5 |
| -0.08 |
-0.06 |
-0.03 |
-0.02 |
-0.01 |
0.00 |
0.01 |
0.03 |
0.06 |
0.07 |
0.33 |
Daily log-return distribution fitting results
| Distribution | Location, a | Scale, b |
| Laplace |
-0.058 |
0.146 |
Linear regression results [Model: y=log(percentile of log-return), x=|log-return|]
| Variable | Coef(b) | s.e.(b) | t-value | P-value |
| Constant |
-0.951 |
0.054 |
-17.503 |
0.0000 |
|log-return| |
-60.448 |
2.608 |
-23.179 |
0.0000 |
I(right-tail) |
0.093 |
0.074 |
1.253 |
0.2104 |
|log-return|*I(right-tail) |
-5.593 |
3.763 |
-1.486 |
0.1374 |
Hurst exponent (of daily return price)
| 12-day | 24-day | 48-day | 96-day |
| 0.516 |
0.547 |
0.591 |
0.609 |
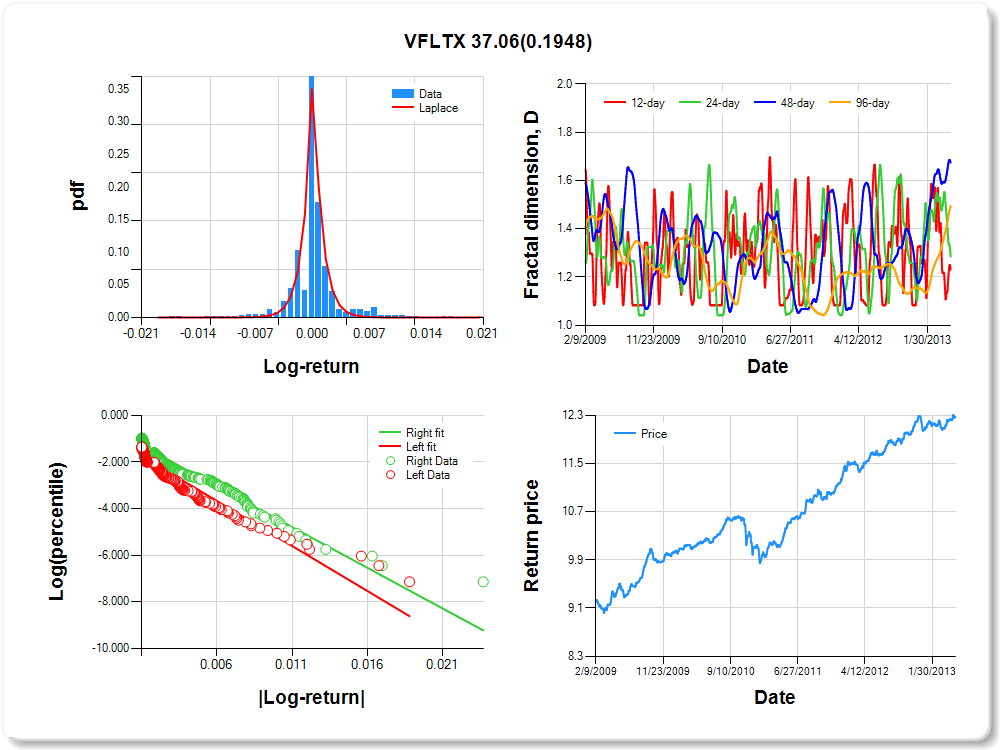
VFLTX
Percentile values of daily loss(gain) in per cent
| 0.5 | 1 | 5 | 10 | 25 | 50 | 75 | 90 | 95 | 99 | 99.5 |
| -0.01 |
-0.01 |
0.00 |
0.00 |
0.00 |
0.00 |
0.00 |
0.01 |
0.01 |
0.01 |
0.29 |
Daily log-return distribution fitting results
| Distribution | Location, a | Scale, b |
| Laplace |
-0.162 |
0.087 |
Linear regression results [Model: y=log(percentile of log-return), x=|log-return|]
| Variable | Coef(b) | s.e.(b) | t-value | P-value |
| Constant |
-1.441 |
0.078 |
-18.410 |
0.0000 |
|log-return| |
-385.102 |
23.096 |
-16.674 |
0.0000 |
I(right-tail) |
0.407 |
0.101 |
4.012 |
0.0001 |
|log-return|*I(right-tail) |
37.057 |
28.558 |
1.298 |
0.1948 |
Hurst exponent (of daily return price)
| 12-day | 24-day | 48-day | 96-day |
| 0.769 |
0.715 |
0.325 |
0.505 |
VIPSX
Percentile values of daily loss(gain) in per cent
| 0.5 | 1 | 5 | 10 | 25 | 50 | 75 | 90 | 95 | 99 | 99.5 |
| -0.02 |
-0.01 |
-0.01 |
0.00 |
0.00 |
0.00 |
0.00 |
0.01 |
0.01 |
0.01 |
0.42 |
Daily log-return distribution fitting results
| Distribution | Location, a | Scale, b |
| Logistic |
-0.364 |
0.126 |
Linear regression results [Model: y=log(percentile of log-return), x=|log-return|]
| Variable | Coef(b) | s.e.(b) | t-value | P-value |
| Constant |
-0.758 |
0.067 |
-11.357 |
0.0000 |
|log-return| |
-317.833 |
14.362 |
-22.131 |
0.0000 |
I(right-tail) |
0.127 |
0.091 |
1.405 |
0.1602 |
|log-return|*I(right-tail) |
16.269 |
19.257 |
0.845 |
0.3984 |
Hurst exponent (of daily return price)
| 12-day | 24-day | 48-day | 96-day |
| 0.293 |
0.591 |
0.508 |
0.435 |
