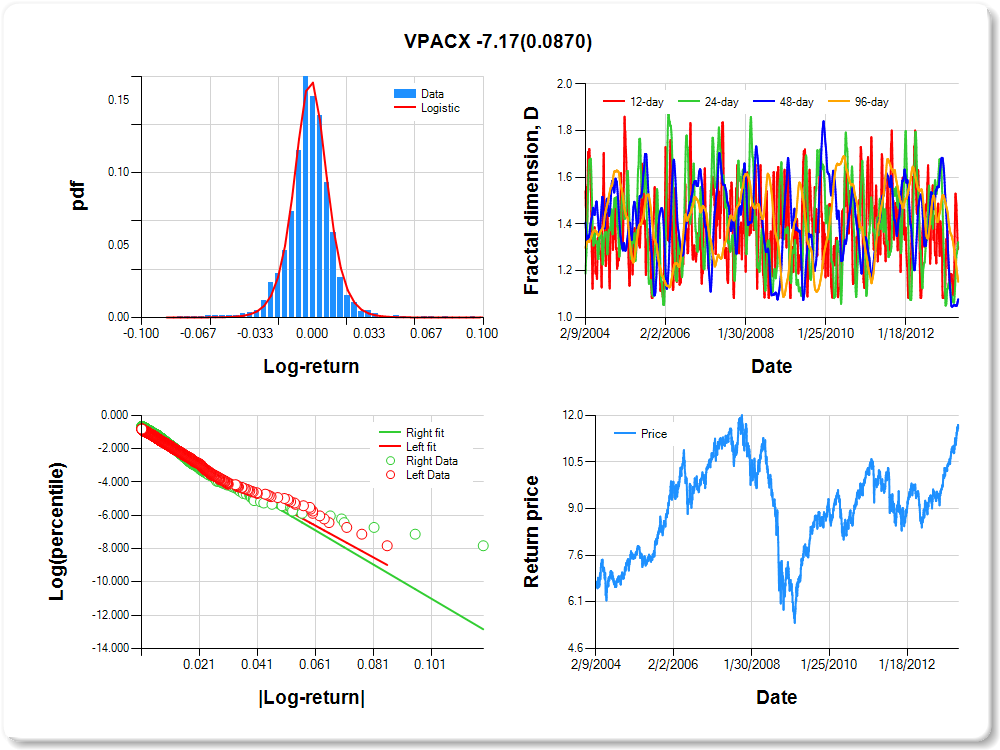
VPACX
Percentile values of daily loss(gain) in per cent
| 0.5 | 1 | 5 | 10 | 25 | 50 | 75 | 90 | 95 | 99 | 99.5 |
| -0.05 |
-0.04 |
-0.02 |
-0.01 |
-0.01 |
0.00 |
0.01 |
0.02 |
0.04 |
0.04 |
0.60 |
Daily log-return distribution fitting results
| Distribution | Location, a | Scale, b |
| Logistic |
-0.262 |
0.104 |
Linear regression results [Model: y=log(percentile of log-return), x=|log-return|]
| Variable | Coef(b) | s.e.(b) | t-value | P-value |
| Constant |
-0.837 |
0.043 |
-19.485 |
0.0000 |
|log-return| |
-95.176 |
2.941 |
-32.358 |
0.0000 |
I(right-tail) |
0.153 |
0.059 |
2.610 |
0.0091 |
|log-return|*I(right-tail) |
-7.173 |
4.190 |
-1.712 |
0.0870 |
Hurst exponent (of daily return price)
| 12-day | 24-day | 48-day | 96-day |
| 0.707 |
0.678 |
0.922 |
0.847 |
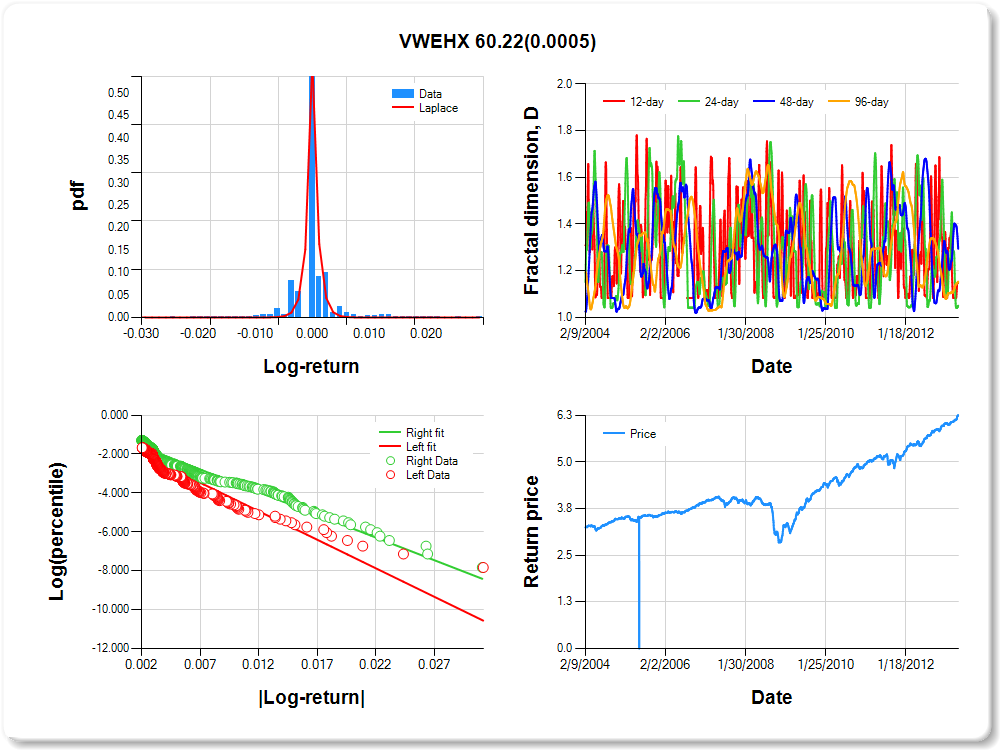
VWEHX
Percentile values of daily loss(gain) in per cent
| 0.5 | 1 | 5 | 10 | 25 | 50 | 75 | 90 | 95 | 99 | 99.5 |
| -0.01 |
-0.01 |
0.00 |
0.00 |
0.00 |
0.00 |
0.00 |
0.01 |
0.01 |
0.02 |
0.52 |
Daily log-return distribution fitting results
| Distribution | Location, a | Scale, b |
| Laplace |
0.036 |
0.052 |
Linear regression results [Model: y=log(percentile of log-return), x=|log-return|]
| Variable | Coef(b) | s.e.(b) | t-value | P-value |
| Constant |
-1.539 |
0.073 |
-21.190 |
0.0000 |
|log-return| |
-293.353 |
14.628 |
-20.055 |
0.0000 |
I(right-tail) |
0.281 |
0.092 |
3.069 |
0.0022 |
|log-return|*I(right-tail) |
60.219 |
17.342 |
3.472 |
0.0005 |
Hurst exponent (of daily return price)
| 12-day | 24-day | 48-day | 96-day |
| 0.851 |
0.949 |
0.706 |
0.847 |
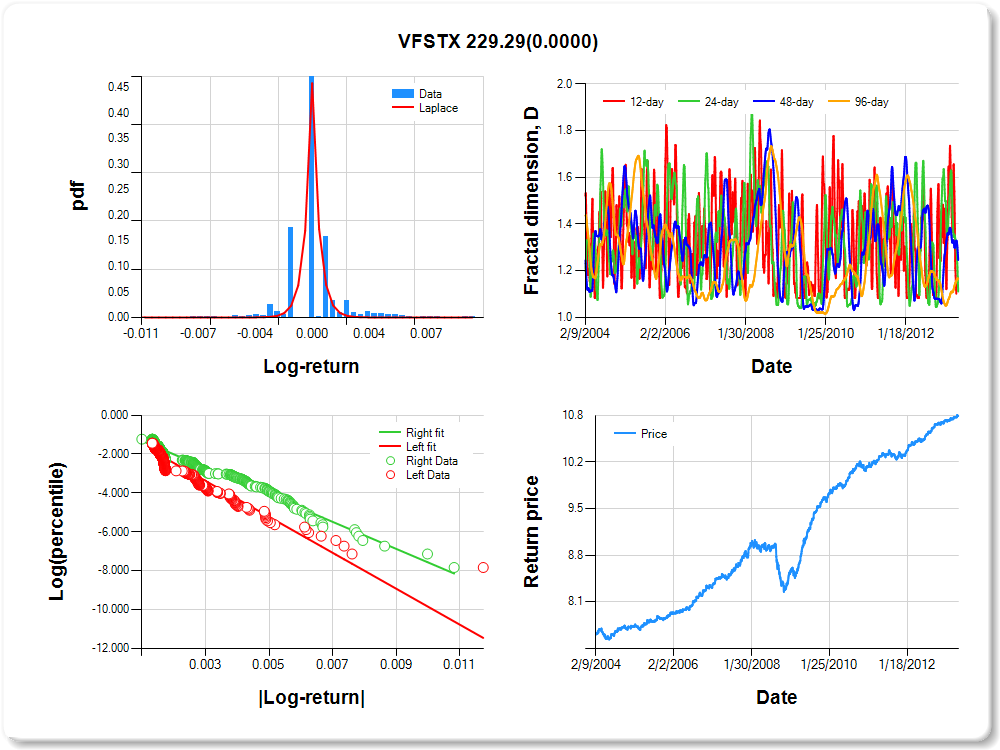
VFSTX
Percentile values of daily loss(gain) in per cent
| 0.5 | 1 | 5 | 10 | 25 | 50 | 75 | 90 | 95 | 99 | 99.5 |
| 0.00 |
0.00 |
0.00 |
0.00 |
0.00 |
0.00 |
0.00 |
0.00 |
0.01 |
0.01 |
0.76 |
Daily log-return distribution fitting results
| Distribution | Location, a | Scale, b |
| Laplace |
0.104 |
0.069 |
Linear regression results [Model: y=log(percentile of log-return), x=|log-return|]
| Variable | Coef(b) | s.e.(b) | t-value | P-value |
| Constant |
-0.977 |
0.076 |
-12.830 |
0.0000 |
|log-return| |
-925.221 |
40.807 |
-22.673 |
0.0000 |
I(right-tail) |
0.079 |
0.099 |
0.804 |
0.4215 |
|log-return|*I(right-tail) |
229.292 |
48.763 |
4.702 |
0.0000 |
Hurst exponent (of daily return price)
| 12-day | 24-day | 48-day | 96-day |
| NaN |
0.889 |
0.754 |
0.834 |
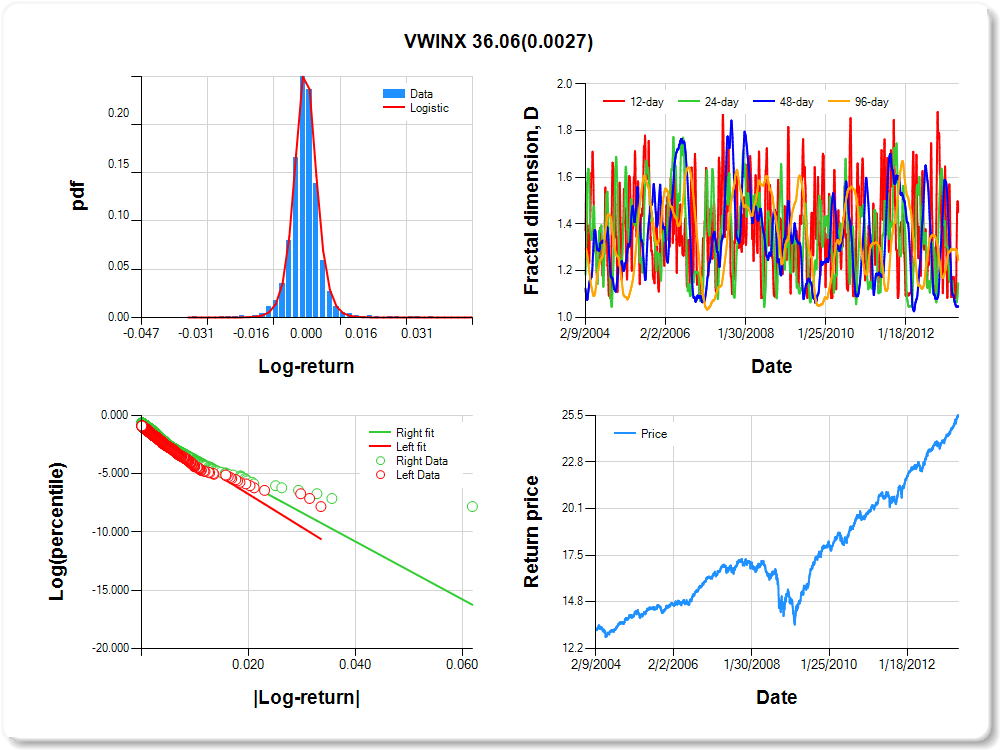
VWINX
Percentile values of daily loss(gain) in per cent
| 0.5 | 1 | 5 | 10 | 25 | 50 | 75 | 90 | 95 | 99 | 99.5 |
| -0.02 |
-0.01 |
-0.01 |
0.00 |
0.00 |
0.00 |
0.00 |
0.01 |
0.01 |
0.02 |
0.68 |
Daily log-return distribution fitting results
| Distribution | Location, a | Scale, b |
| Logistic |
-0.488 |
0.070 |
Linear regression results [Model: y=log(percentile of log-return), x=|log-return|]
| Variable | Coef(b) | s.e.(b) | t-value | P-value |
| Constant |
-0.989 |
0.044 |
-22.553 |
0.0000 |
|log-return| |
-283.896 |
9.354 |
-30.351 |
0.0000 |
I(right-tail) |
0.160 |
0.058 |
2.789 |
0.0053 |
|log-return|*I(right-tail) |
36.059 |
11.987 |
3.008 |
0.0027 |
Hurst exponent (of daily return price)
| 12-day | 24-day | 48-day | 96-day |
| 0.550 |
0.853 |
0.954 |
0.754 |
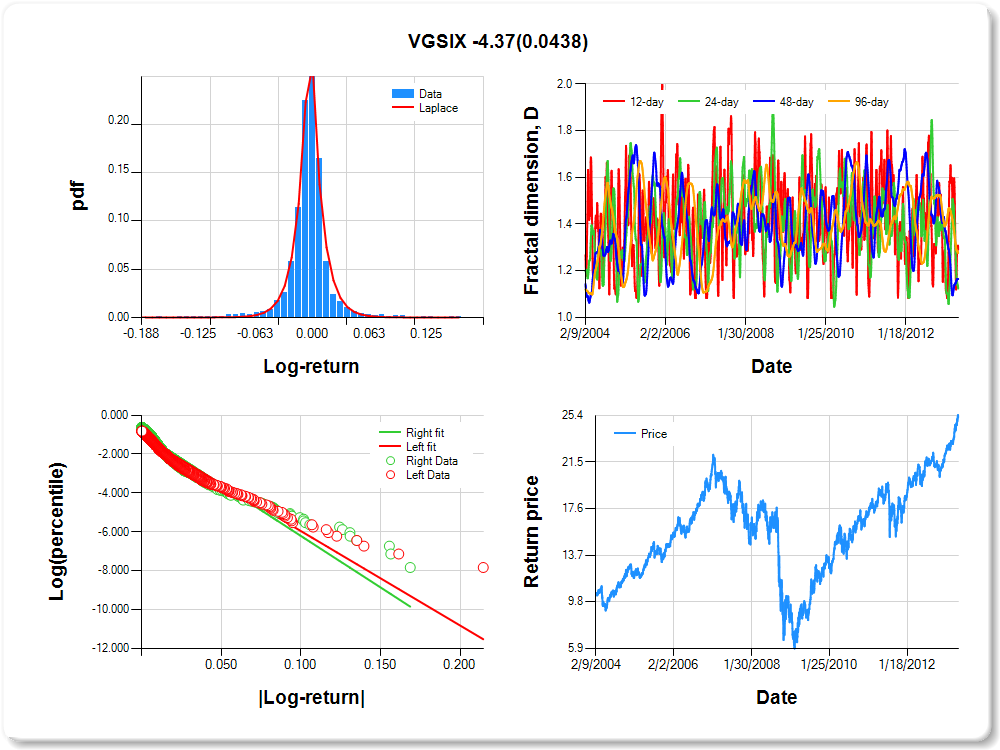
VGSIX
Percentile values of daily loss(gain) in per cent
| 0.5 | 1 | 5 | 10 | 25 | 50 | 75 | 90 | 95 | 99 | 99.5 |
| -0.09 |
-0.08 |
-0.03 |
-0.02 |
-0.01 |
0.00 |
0.01 |
0.03 |
0.08 |
0.10 |
0.00 |
Daily log-return distribution fitting results
| Distribution | Location, a | Scale, b |
| Laplace |
0.214 |
0.107 |
Linear regression results [Model: y=log(percentile of log-return), x=|log-return|]
| Variable | Coef(b) | s.e.(b) | t-value | P-value |
| Constant |
-1.087 |
0.038 |
-28.838 |
0.0000 |
|log-return| |
-48.563 |
1.530 |
-31.745 |
0.0000 |
I(right-tail) |
0.187 |
0.051 |
3.665 |
0.0003 |
|log-return|*I(right-tail) |
-4.368 |
2.166 |
-2.017 |
0.0438 |
Hurst exponent (of daily return price)
| 12-day | 24-day | 48-day | 96-day |
| 0.710 |
0.876 |
0.836 |
0.724 |
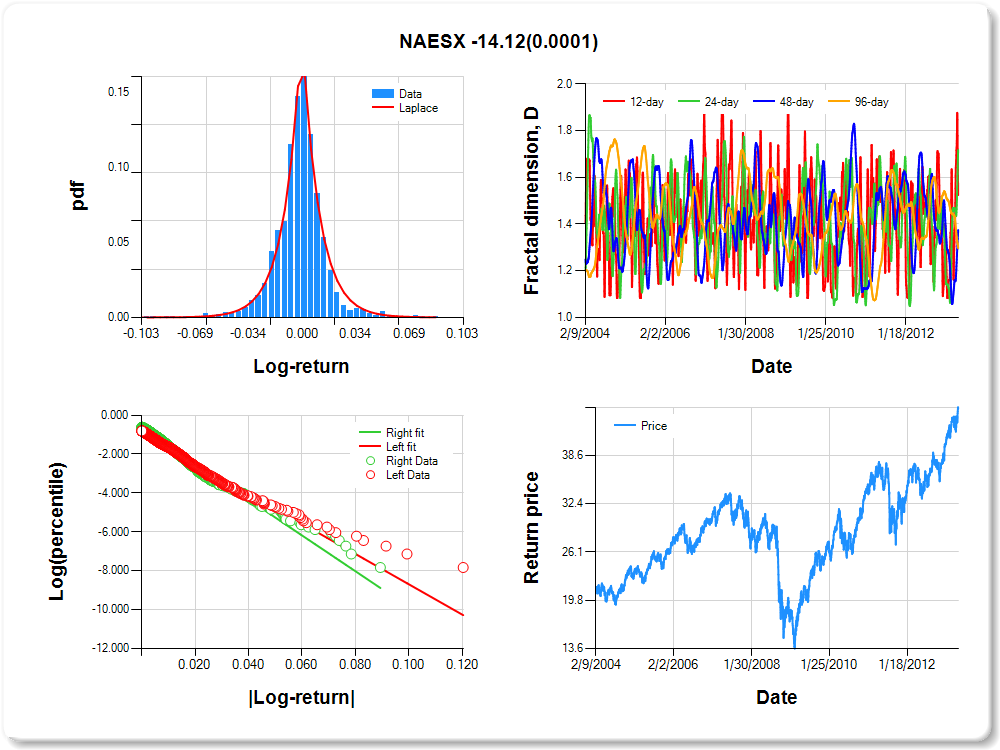
NAESX
Percentile values of daily loss(gain) in per cent
| 0.5 | 1 | 5 | 10 | 25 | 50 | 75 | 90 | 95 | 99 | 99.5 |
| -0.06 |
-0.05 |
-0.02 |
-0.02 |
-0.01 |
0.00 |
0.01 |
0.02 |
0.05 |
0.06 |
0.73 |
Daily log-return distribution fitting results
| Distribution | Location, a | Scale, b |
| Laplace |
0.280 |
0.180 |
Linear regression results [Model: y=log(percentile of log-return), x=|log-return|]
| Variable | Coef(b) | s.e.(b) | t-value | P-value |
| Constant |
-0.880 |
0.041 |
-21.356 |
0.0000 |
|log-return| |
-78.007 |
2.389 |
-32.647 |
0.0000 |
I(right-tail) |
0.243 |
0.056 |
4.308 |
0.0000 |
|log-return|*I(right-tail) |
-14.118 |
3.499 |
-4.035 |
0.0001 |
Hurst exponent (of daily return price)
| 12-day | 24-day | 48-day | 96-day |
| 0.475 |
0.283 |
0.625 |
0.704 |
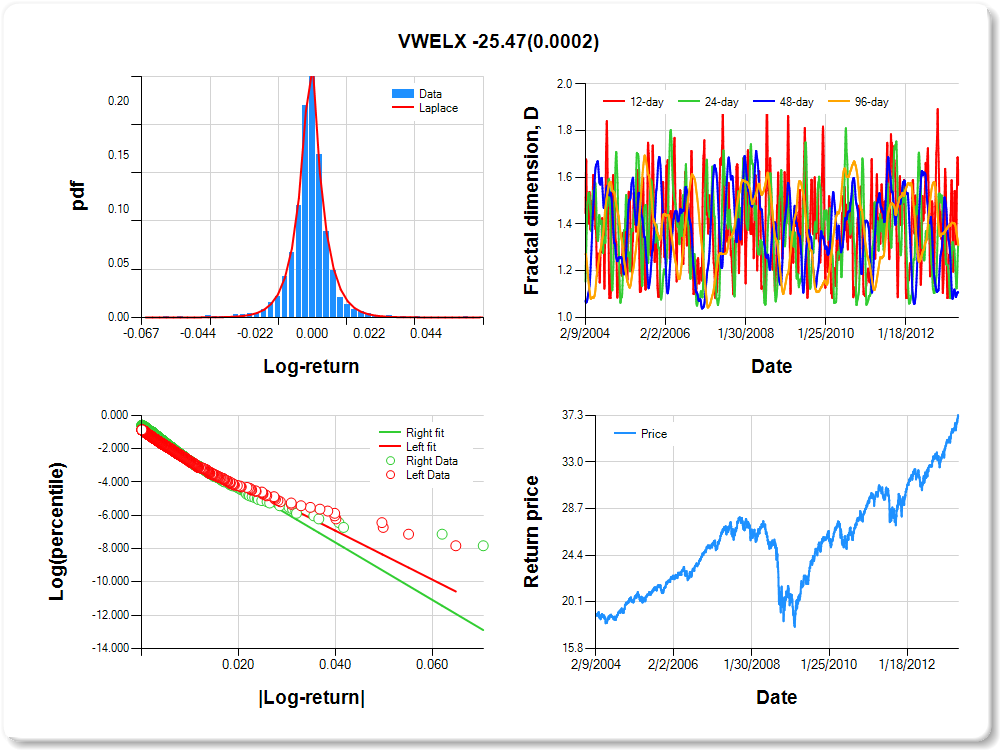
VWELX
Percentile values of daily loss(gain) in per cent
| 0.5 | 1 | 5 | 10 | 25 | 50 | 75 | 90 | 95 | 99 | 99.5 |
| -0.03 |
-0.02 |
-0.01 |
-0.01 |
0.00 |
0.00 |
0.00 |
0.01 |
0.02 |
0.03 |
0.00 |
Daily log-return distribution fitting results
| Distribution | Location, a | Scale, b |
| Laplace |
-0.056 |
0.125 |
Linear regression results [Model: y=log(percentile of log-return), x=|log-return|]
| Variable | Coef(b) | s.e.(b) | t-value | P-value |
| Constant |
-1.031 |
0.041 |
-25.138 |
0.0000 |
|log-return| |
-146.636 |
4.704 |
-31.176 |
0.0000 |
I(right-tail) |
0.316 |
0.055 |
5.749 |
0.0000 |
|log-return|*I(right-tail) |
-25.473 |
6.748 |
-3.775 |
0.0002 |
Hurst exponent (of daily return price)
| 12-day | 24-day | 48-day | 96-day |
| 0.432 |
0.688 |
0.893 |
0.690 |
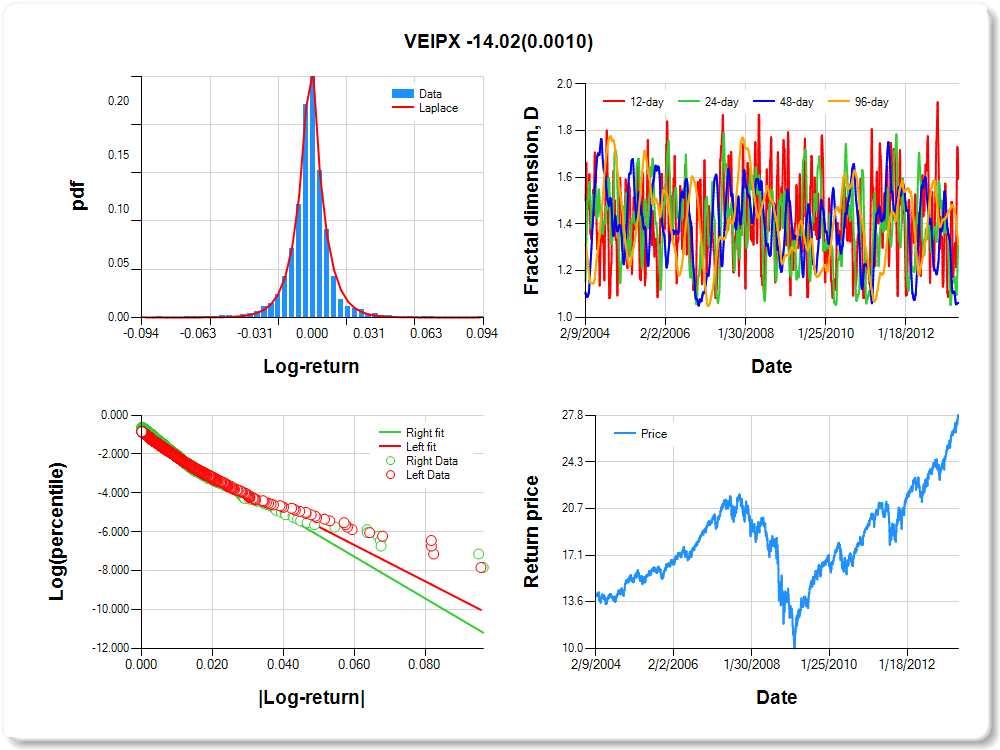
VEIPX
Percentile values of daily loss(gain) in per cent
| 0.5 | 1 | 5 | 10 | 25 | 50 | 75 | 90 | 95 | 99 | 99.5 |
| -0.05 |
-0.04 |
-0.02 |
-0.01 |
0.00 |
0.00 |
0.01 |
0.02 |
0.04 |
0.04 |
-0.11 |
Daily log-return distribution fitting results
| Distribution | Location, a | Scale, b |
| Laplace |
0.010 |
0.125 |
Linear regression results [Model: y=log(percentile of log-return), x=|log-return|]
| Variable | Coef(b) | s.e.(b) | t-value | P-value |
| Constant |
-1.035 |
0.040 |
-26.084 |
0.0000 |
|log-return| |
-93.458 |
2.957 |
-31.601 |
0.0000 |
I(right-tail) |
0.247 |
0.054 |
4.587 |
0.0000 |
|log-return|*I(right-tail) |
-14.020 |
4.264 |
-3.288 |
0.0010 |
Hurst exponent (of daily return price)
| 12-day | 24-day | 48-day | 96-day |
| 0.407 |
0.681 |
0.937 |
0.686 |
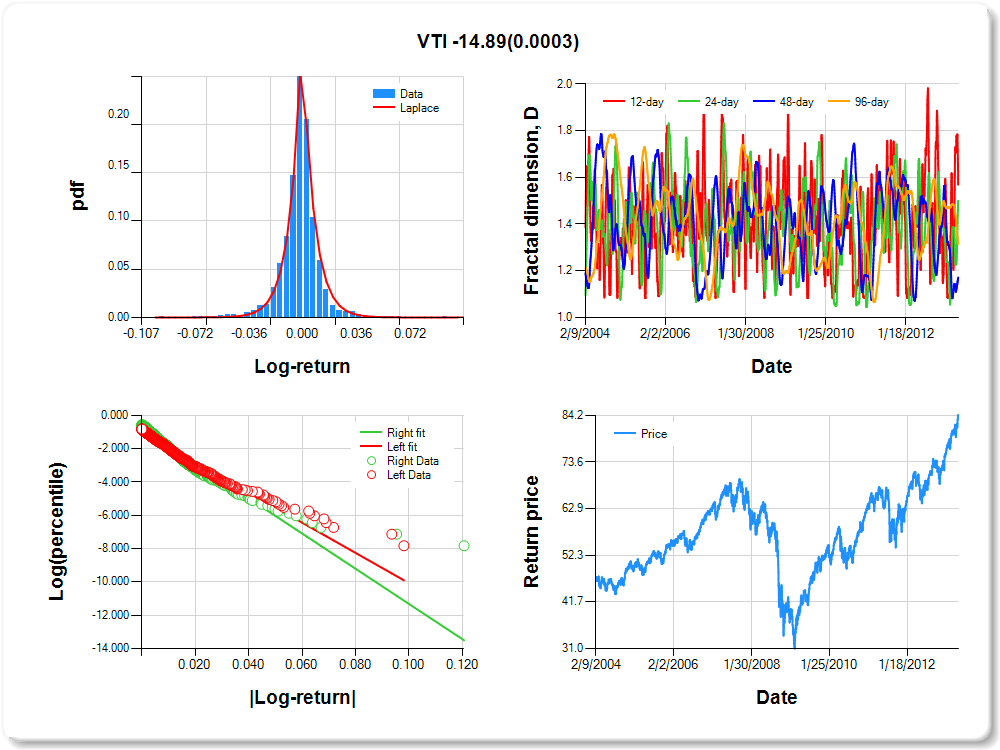
VTI
Percentile values of daily loss(gain) in per cent
| 0.5 | 1 | 5 | 10 | 25 | 50 | 75 | 90 | 95 | 99 | 99.5 |
| -0.05 |
-0.04 |
-0.02 |
-0.01 |
0.00 |
0.00 |
0.01 |
0.02 |
0.04 |
0.05 |
0.29 |
Daily log-return distribution fitting results
| Distribution | Location, a | Scale, b |
| Laplace |
-0.152 |
0.123 |
Linear regression results [Model: y=log(percentile of log-return), x=|log-return|]
| Variable | Coef(b) | s.e.(b) | t-value | P-value |
| Constant |
-0.992 |
0.040 |
-24.887 |
0.0000 |
|log-return| |
-90.768 |
2.826 |
-32.117 |
0.0000 |
I(right-tail) |
0.244 |
0.053 |
4.559 |
0.0000 |
|log-return|*I(right-tail) |
-14.894 |
4.090 |
-3.641 |
0.0003 |
Hurst exponent (of daily return price)
| 12-day | 24-day | 48-day | 96-day |
| 0.431 |
0.500 |
0.829 |
0.686 |
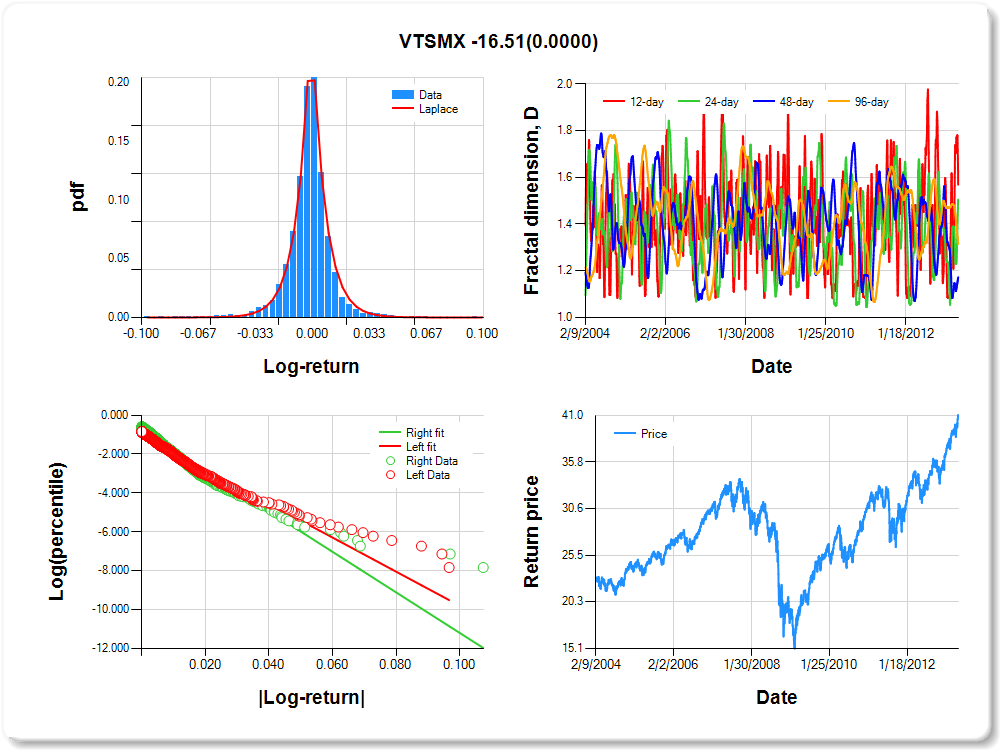
VTSMX
Percentile values of daily loss(gain) in per cent
| 0.5 | 1 | 5 | 10 | 25 | 50 | 75 | 90 | 95 | 99 | 99.5 |
| -0.05 |
-0.04 |
-0.02 |
-0.01 |
0.00 |
0.00 |
0.01 |
0.02 |
0.04 |
0.05 |
0.70 |
Daily log-return distribution fitting results
| Distribution | Location, a | Scale, b |
| Laplace |
-0.068 |
0.133 |
Linear regression results [Model: y=log(percentile of log-return), x=|log-return|]
| Variable | Coef(b) | s.e.(b) | t-value | P-value |
| Constant |
-1.008 |
0.040 |
-25.213 |
0.0000 |
|log-return| |
-87.724 |
2.753 |
-31.862 |
0.0000 |
I(right-tail) |
0.262 |
0.054 |
4.862 |
0.0000 |
|log-return|*I(right-tail) |
-16.515 |
4.015 |
-4.113 |
0.0000 |
Hurst exponent (of daily return price)
| 12-day | 24-day | 48-day | 96-day |
| 0.431 |
0.495 |
0.828 |
0.685 |
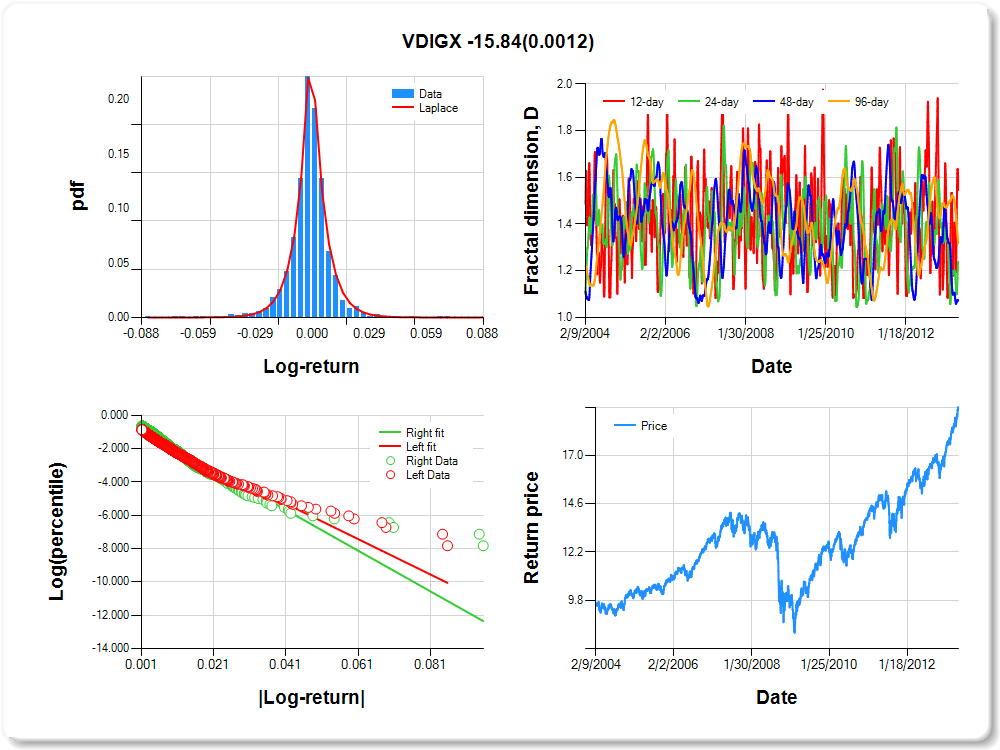
VDIGX
Percentile values of daily loss(gain) in per cent
| 0.5 | 1 | 5 | 10 | 25 | 50 | 75 | 90 | 95 | 99 | 99.5 |
| -0.04 |
-0.03 |
-0.02 |
-0.01 |
0.00 |
0.00 |
0.01 |
0.02 |
0.03 |
0.04 |
0.80 |
Daily log-return distribution fitting results
| Distribution | Location, a | Scale, b |
| Laplace |
-0.075 |
0.126 |
Linear regression results [Model: y=log(percentile of log-return), x=|log-return|]
| Variable | Coef(b) | s.e.(b) | t-value | P-value |
| Constant |
-1.021 |
0.041 |
-24.988 |
0.0000 |
|log-return| |
-105.968 |
3.384 |
-31.315 |
0.0000 |
I(right-tail) |
0.264 |
0.056 |
4.736 |
0.0000 |
|log-return|*I(right-tail) |
-15.840 |
4.900 |
-3.233 |
0.0012 |
Hurst exponent (of daily return price)
| 12-day | 24-day | 48-day | 96-day |
| 0.454 |
0.760 |
0.927 |
0.683 |
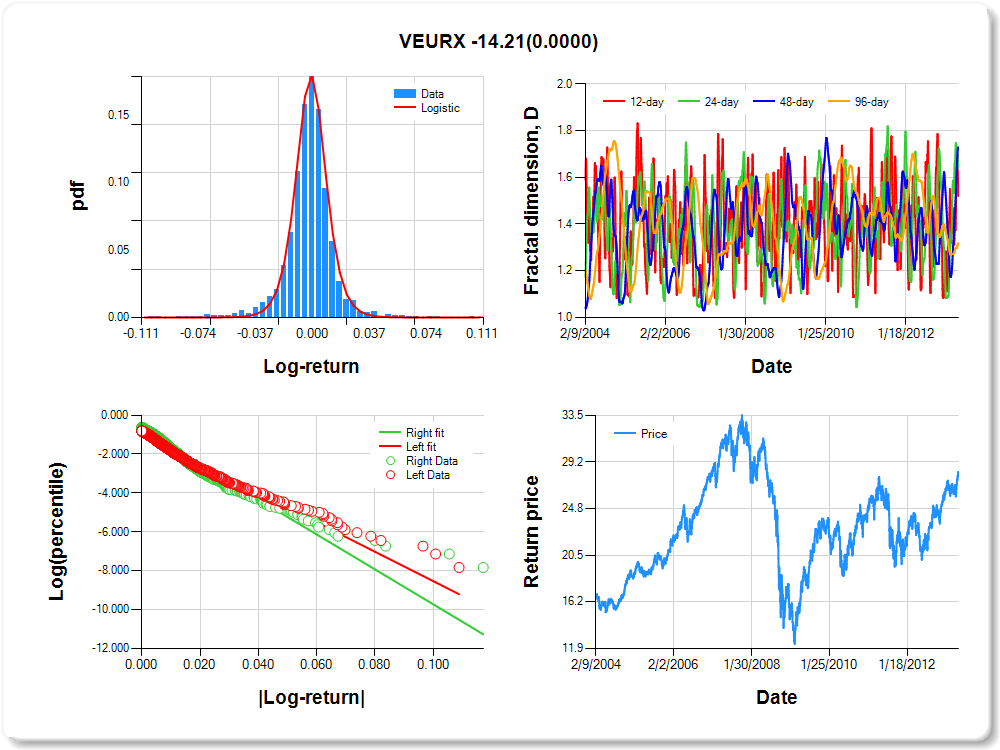
VEURX
Percentile values of daily loss(gain) in per cent
| 0.5 | 1 | 5 | 10 | 25 | 50 | 75 | 90 | 95 | 99 | 99.5 |
| -0.06 |
-0.05 |
-0.02 |
-0.02 |
-0.01 |
0.00 |
0.01 |
0.02 |
0.04 |
0.06 |
2.02 |
Daily log-return distribution fitting results
| Distribution | Location, a | Scale, b |
| Logistic |
-0.043 |
0.095 |
Linear regression results [Model: y=log(percentile of log-return), x=|log-return|]
| Variable | Coef(b) | s.e.(b) | t-value | P-value |
| Constant |
-0.951 |
0.040 |
-23.933 |
0.0000 |
|log-return| |
-75.659 |
2.323 |
-32.574 |
0.0000 |
I(right-tail) |
0.233 |
0.055 |
4.243 |
0.0000 |
|log-return|*I(right-tail) |
-14.205 |
3.451 |
-4.116 |
0.0000 |
Hurst exponent (of daily return price)
| 12-day | 24-day | 48-day | 96-day |
| 0.480 |
0.359 |
0.271 |
0.682 |
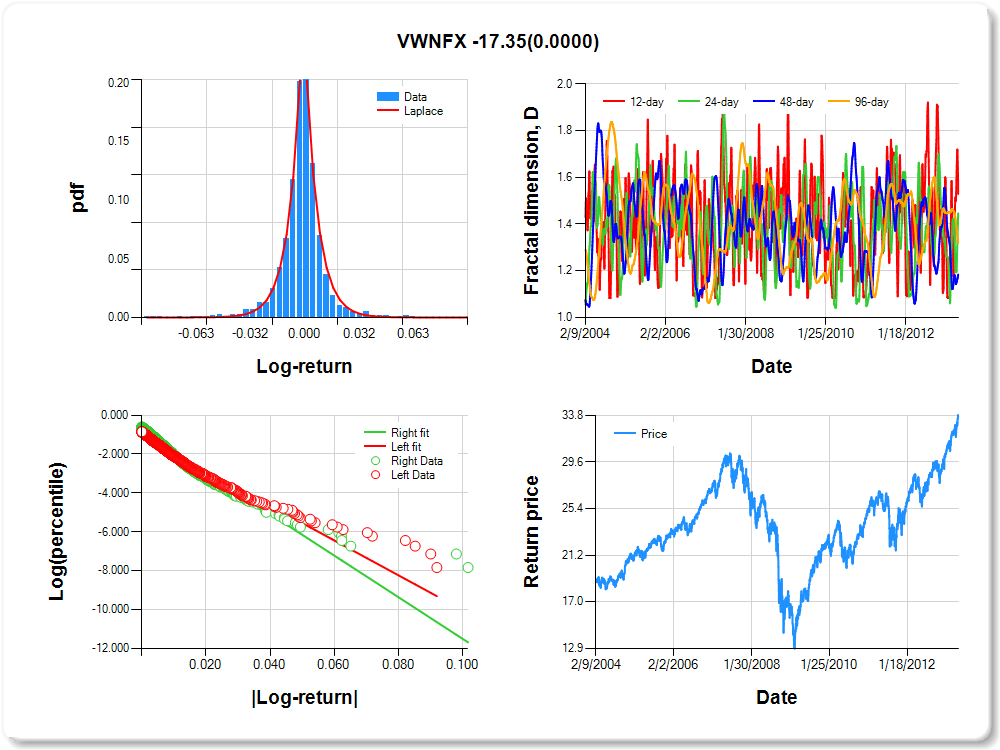
VWNFX
Percentile values of daily loss(gain) in per cent
| 0.5 | 1 | 5 | 10 | 25 | 50 | 75 | 90 | 95 | 99 | 99.5 |
| -0.05 |
-0.04 |
-0.02 |
-0.01 |
0.00 |
0.00 |
0.01 |
0.02 |
0.04 |
0.04 |
0.51 |
Daily log-return distribution fitting results
| Distribution | Location, a | Scale, b |
| Laplace |
-0.067 |
0.131 |
Linear regression results [Model: y=log(percentile of log-return), x=|log-return|]
| Variable | Coef(b) | s.e.(b) | t-value | P-value |
| Constant |
-1.035 |
0.040 |
-25.954 |
0.0000 |
|log-return| |
-89.616 |
2.835 |
-31.613 |
0.0000 |
I(right-tail) |
0.269 |
0.054 |
5.005 |
0.0000 |
|log-return|*I(right-tail) |
-17.352 |
4.138 |
-4.193 |
0.0000 |
Hurst exponent (of daily return price)
| 12-day | 24-day | 48-day | 96-day |
| 0.471 |
0.554 |
0.816 |
0.682 |
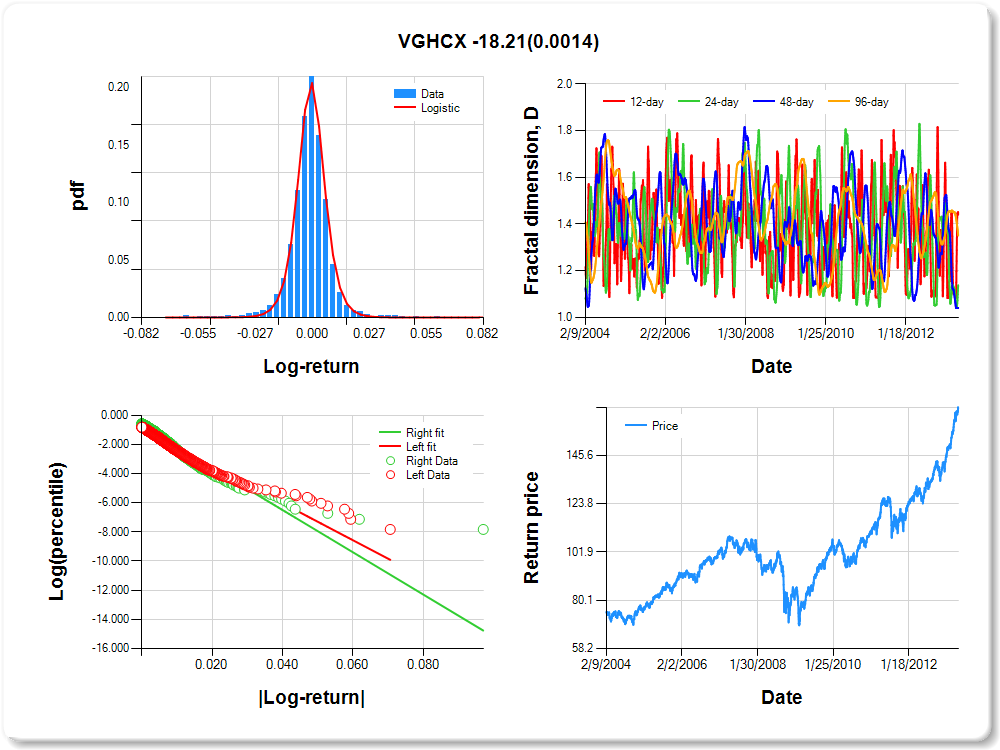
VGHCX
Percentile values of daily loss(gain) in per cent
| 0.5 | 1 | 5 | 10 | 25 | 50 | 75 | 90 | 95 | 99 | 99.5 |
| -0.04 |
-0.03 |
-0.01 |
-0.01 |
0.00 |
0.00 |
0.01 |
0.01 |
0.02 |
0.03 |
0.65 |
Daily log-return distribution fitting results
| Distribution | Location, a | Scale, b |
| Logistic |
-0.249 |
0.084 |
Linear regression results [Model: y=log(percentile of log-return), x=|log-return|]
| Variable | Coef(b) | s.e.(b) | t-value | P-value |
| Constant |
-0.961 |
0.040 |
-23.844 |
0.0000 |
|log-return| |
-126.745 |
3.959 |
-32.017 |
0.0000 |
I(right-tail) |
0.266 |
0.055 |
4.878 |
0.0000 |
|log-return|*I(right-tail) |
-18.210 |
5.694 |
-3.198 |
0.0014 |
Hurst exponent (of daily return price)
| 12-day | 24-day | 48-day | 96-day |
| 0.559 |
0.862 |
0.959 |
0.649 |
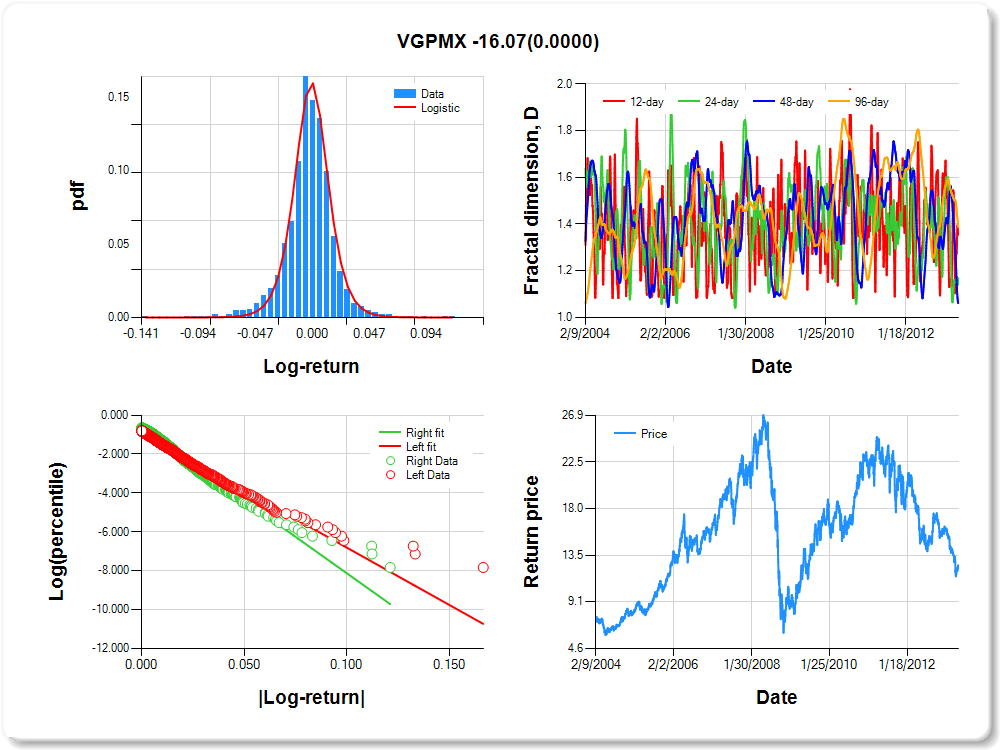
VGPMX
Percentile values of daily loss(gain) in per cent
| 0.5 | 1 | 5 | 10 | 25 | 50 | 75 | 90 | 95 | 99 | 99.5 |
| -0.08 |
-0.06 |
-0.03 |
-0.02 |
-0.01 |
0.00 |
0.01 |
0.03 |
0.05 |
0.06 |
1.03 |
Daily log-return distribution fitting results
| Distribution | Location, a | Scale, b |
| Logistic |
0.293 |
0.107 |
Linear regression results [Model: y=log(percentile of log-return), x=|log-return|]
| Variable | Coef(b) | s.e.(b) | t-value | P-value |
| Constant |
-0.894 |
0.041 |
-21.973 |
0.0000 |
|log-return| |
-58.960 |
1.802 |
-32.724 |
0.0000 |
I(right-tail) |
0.294 |
0.057 |
5.113 |
0.0000 |
|log-return|*I(right-tail) |
-16.071 |
2.783 |
-5.774 |
0.0000 |
Hurst exponent (of daily return price)
| 12-day | 24-day | 48-day | 96-day |
| 0.645 |
0.832 |
0.939 |
0.613 |
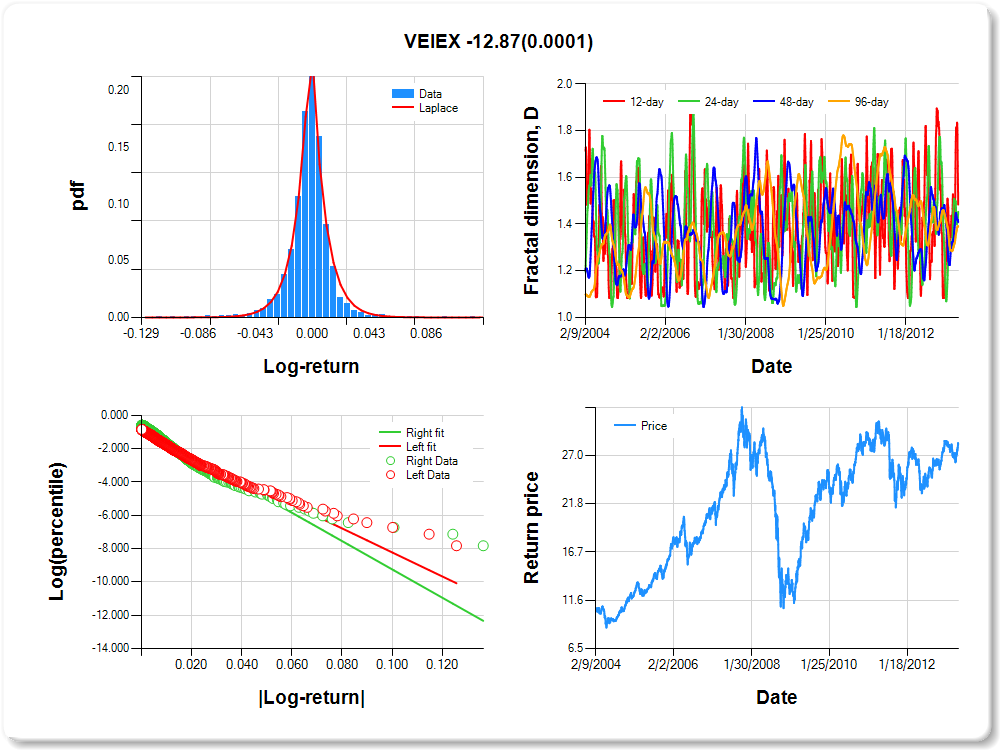
VEIEX
Percentile values of daily loss(gain) in per cent
| 0.5 | 1 | 5 | 10 | 25 | 50 | 75 | 90 | 95 | 99 | 99.5 |
| -0.06 |
-0.05 |
-0.02 |
-0.02 |
-0.01 |
0.00 |
0.01 |
0.02 |
0.05 |
0.06 |
0.33 |
Daily log-return distribution fitting results
| Distribution | Location, a | Scale, b |
| Laplace |
-0.052 |
0.133 |
Linear regression results [Model: y=log(percentile of log-return), x=|log-return|]
| Variable | Coef(b) | s.e.(b) | t-value | P-value |
| Constant |
-1.009 |
0.040 |
-24.940 |
0.0000 |
|log-return| |
-71.993 |
2.269 |
-31.724 |
0.0000 |
I(right-tail) |
0.273 |
0.054 |
5.031 |
0.0000 |
|log-return|*I(right-tail) |
-12.869 |
3.299 |
-3.901 |
0.0001 |
Hurst exponent (of daily return price)
| 12-day | 24-day | 48-day | 96-day |
| 0.516 |
0.547 |
0.591 |
0.609 |
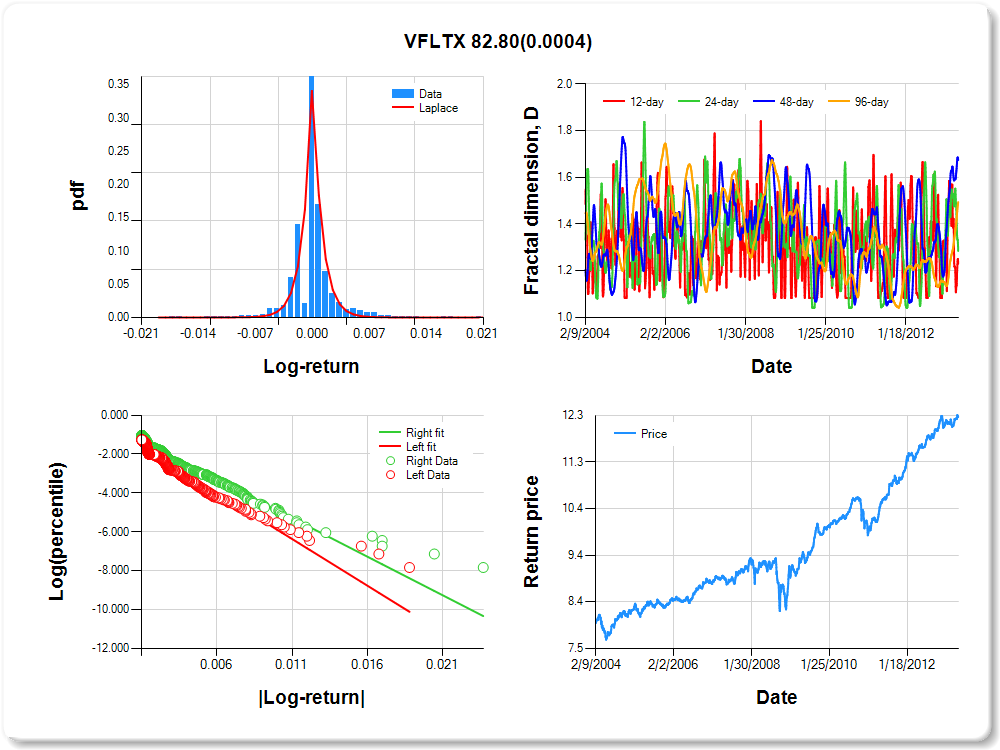
VFLTX
Percentile values of daily loss(gain) in per cent
| 0.5 | 1 | 5 | 10 | 25 | 50 | 75 | 90 | 95 | 99 | 99.5 |
| -0.01 |
-0.01 |
0.00 |
0.00 |
0.00 |
0.00 |
0.00 |
0.00 |
0.01 |
0.01 |
0.21 |
Daily log-return distribution fitting results
| Distribution | Location, a | Scale, b |
| Laplace |
-0.166 |
0.092 |
Linear regression results [Model: y=log(percentile of log-return), x=|log-return|]
| Variable | Coef(b) | s.e.(b) | t-value | P-value |
| Constant |
-1.187 |
0.057 |
-21.006 |
0.0000 |
|log-return| |
-479.130 |
18.905 |
-25.344 |
0.0000 |
I(right-tail) |
0.182 |
0.075 |
2.433 |
0.0151 |
|log-return|*I(right-tail) |
82.799 |
23.383 |
3.541 |
0.0004 |
Hurst exponent (of daily return price)
| 12-day | 24-day | 48-day | 96-day |
| 0.769 |
0.715 |
0.325 |
0.505 |
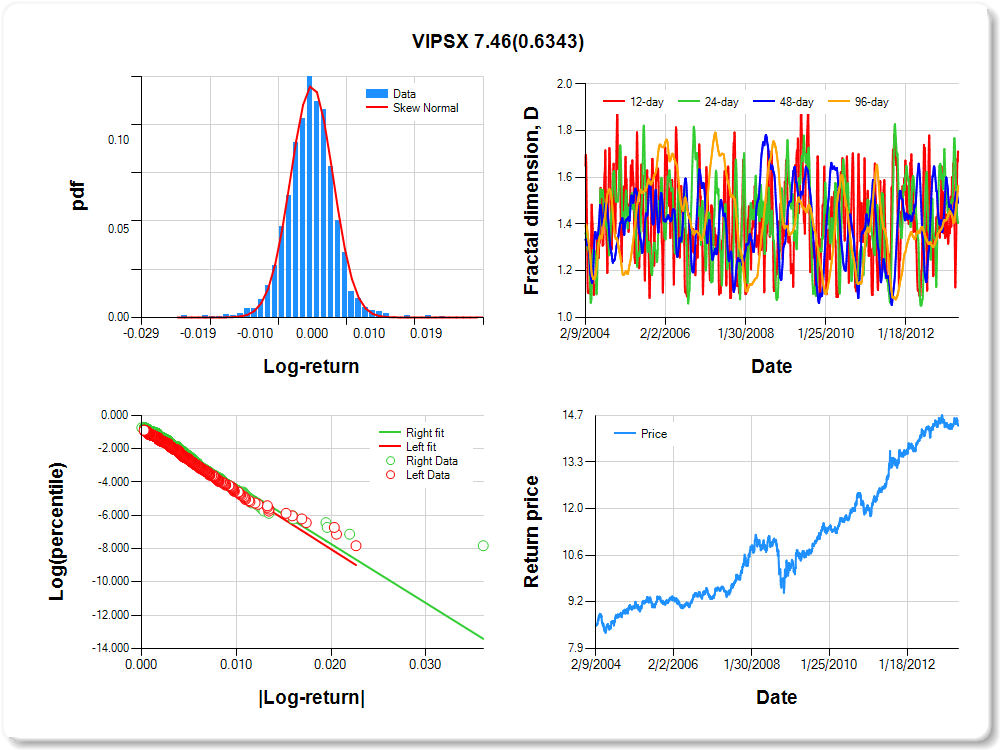
VIPSX
Percentile values of daily loss(gain) in per cent
| 0.5 | 1 | 5 | 10 | 25 | 50 | 75 | 90 | 95 | 99 | 99.5 |
| -0.01 |
-0.01 |
-0.01 |
0.00 |
0.00 |
0.00 |
0.00 |
0.01 |
0.01 |
0.01 |
0.32 |
Daily log-return distribution fitting results
| Distribution | Location, a | Scale, b |
| Skew Normal |
-0.283 |
0.223 |
Linear regression results [Model: y=log(percentile of log-return), x=|log-return|]
| Variable | Coef(b) | s.e.(b) | t-value | P-value |
| Constant |
-0.667 |
0.050 |
-13.291 |
0.0000 |
|log-return| |
-361.460 |
11.529 |
-31.353 |
0.0000 |
I(right-tail) |
0.161 |
0.069 |
2.335 |
0.0197 |
|log-return|*I(right-tail) |
7.462 |
15.684 |
0.476 |
0.6343 |
Hurst exponent (of daily return price)
| 12-day | 24-day | 48-day | 96-day |
| 0.293 |
0.591 |
0.508 |
0.435 |
