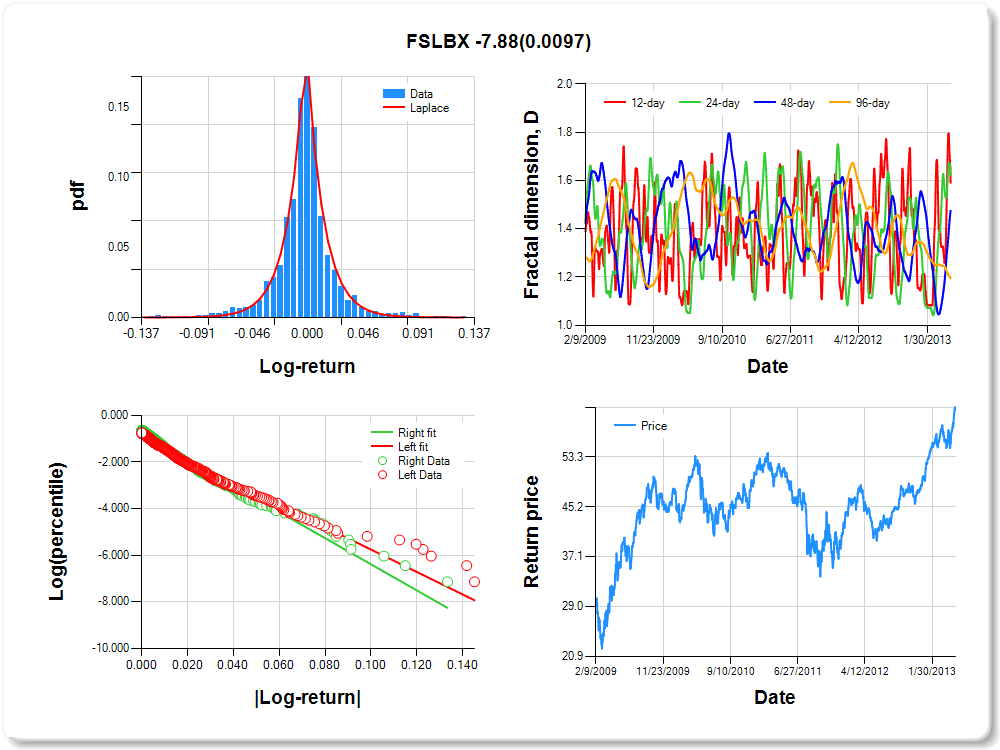
FSLBX
Percentile values of daily loss(gain) in per cent
| 0.5 | 1 | 5 | 10 | 25 | 50 | 75 | 90 | 95 | 99 | 99.5 |
| -0.11 |
-0.07 |
-0.04 |
-0.02 |
-0.01 |
0.00 |
0.01 |
0.04 |
0.08 |
0.09 |
0.68 |
Daily log-return distribution fitting results
| Distribution | Location, a | Scale, b |
| Laplace |
0.084 |
0.171 |
Linear regression results [Model: y=log(percentile of log-return), x=|log-return|]
| Variable | Coef(b) | s.e.(b) | t-value | P-value |
| Constant |
-0.945 |
0.054 |
-17.547 |
0.0000 |
|log-return| |
-48.050 |
2.056 |
-23.375 |
0.0000 |
I(right-tail) |
0.158 |
0.075 |
2.118 |
0.0344 |
|log-return|*I(right-tail) |
-7.883 |
3.042 |
-2.591 |
0.0097 |
Hurst exponent (of daily return price)
| 12-day | 24-day | 48-day | 96-day |
| 0.409 |
0.378 |
0.525 |
0.806 |
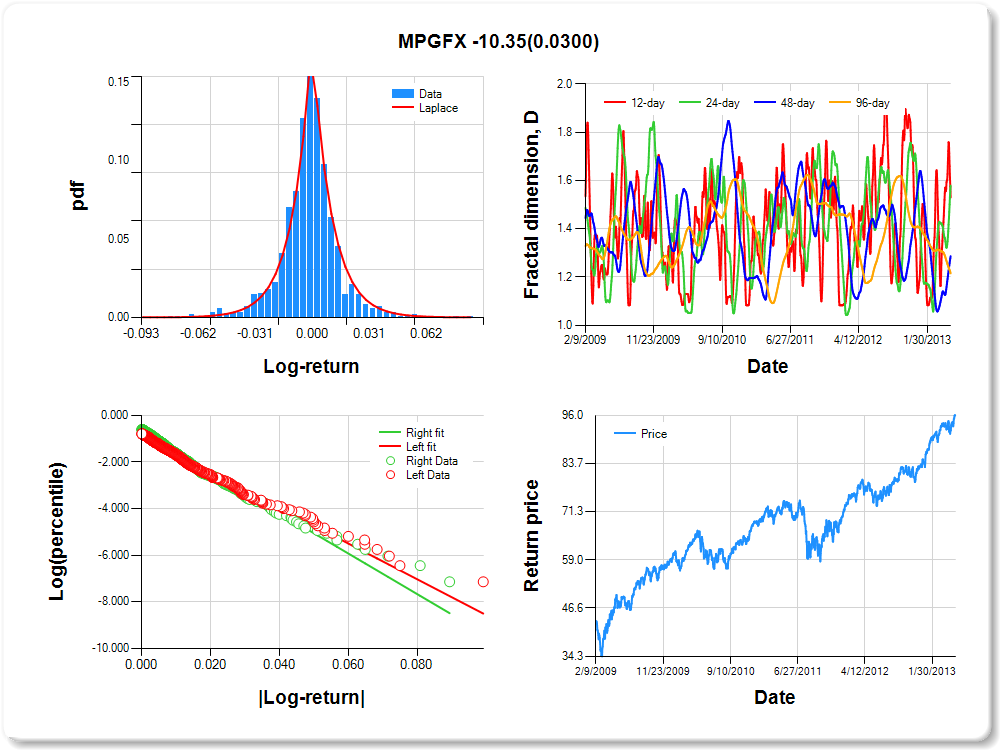
MPGFX
Percentile values of daily loss(gain) in per cent
| 0.5 | 1 | 5 | 10 | 25 | 50 | 75 | 90 | 95 | 99 | 99.5 |
| -0.06 |
-0.05 |
-0.03 |
-0.02 |
-0.01 |
0.00 |
0.01 |
0.02 |
0.05 |
0.06 |
0.43 |
Daily log-return distribution fitting results
| Distribution | Location, a | Scale, b |
| Laplace |
0.118 |
0.192 |
Linear regression results [Model: y=log(percentile of log-return), x=|log-return|]
| Variable | Coef(b) | s.e.(b) | t-value | P-value |
| Constant |
-0.901 |
0.057 |
-15.814 |
0.0000 |
|log-return| |
-76.550 |
3.312 |
-23.114 |
0.0000 |
I(right-tail) |
0.194 |
0.077 |
2.515 |
0.0120 |
|log-return|*I(right-tail) |
-10.350 |
4.765 |
-2.172 |
0.0300 |
Hurst exponent (of daily return price)
| 12-day | 24-day | 48-day | 96-day |
| 0.470 |
0.421 |
0.713 |
0.785 |
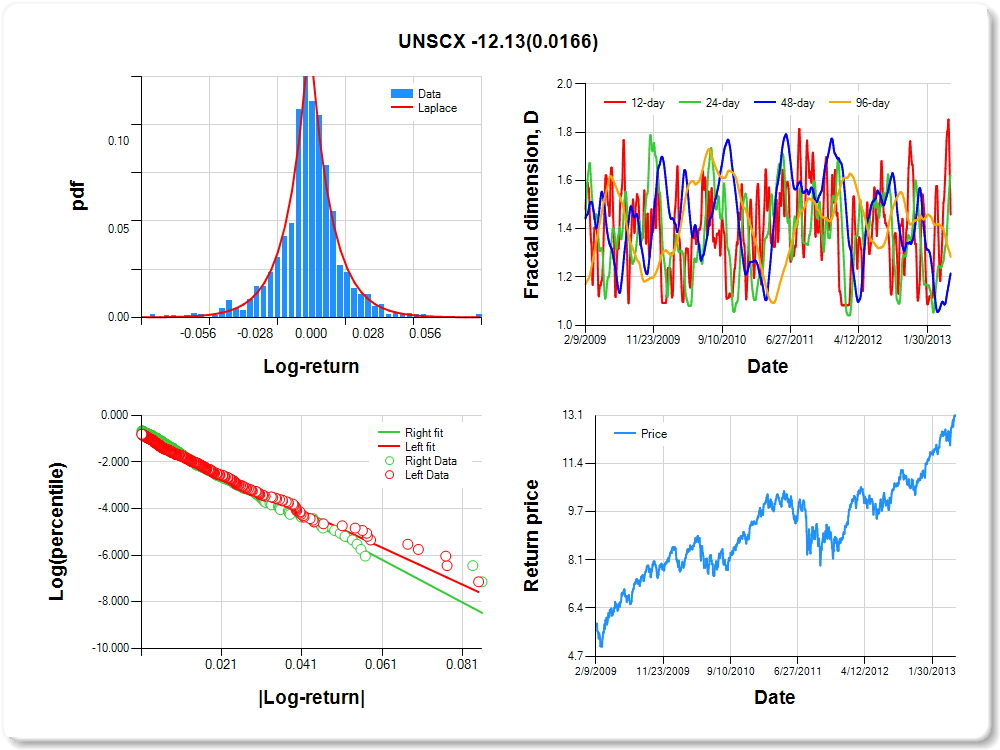
UNSCX
Percentile values of daily loss(gain) in per cent
| 0.5 | 1 | 5 | 10 | 25 | 50 | 75 | 90 | 95 | 99 | 99.5 |
| -0.06 |
-0.04 |
-0.02 |
-0.02 |
-0.01 |
0.00 |
0.01 |
0.02 |
0.04 |
0.05 |
0.90 |
Daily log-return distribution fitting results
| Distribution | Location, a | Scale, b |
| Laplace |
0.001 |
0.210 |
Linear regression results [Model: y=log(percentile of log-return), x=|log-return|]
| Variable | Coef(b) | s.e.(b) | t-value | P-value |
| Constant |
-0.877 |
0.059 |
-14.943 |
0.0000 |
|log-return| |
-78.990 |
3.444 |
-22.936 |
0.0000 |
I(right-tail) |
0.214 |
0.082 |
2.620 |
0.0089 |
|log-return|*I(right-tail) |
-12.134 |
5.058 |
-2.399 |
0.0166 |
Hurst exponent (of daily return price)
| 12-day | 24-day | 48-day | 96-day |
| 0.541 |
0.378 |
0.785 |
0.716 |
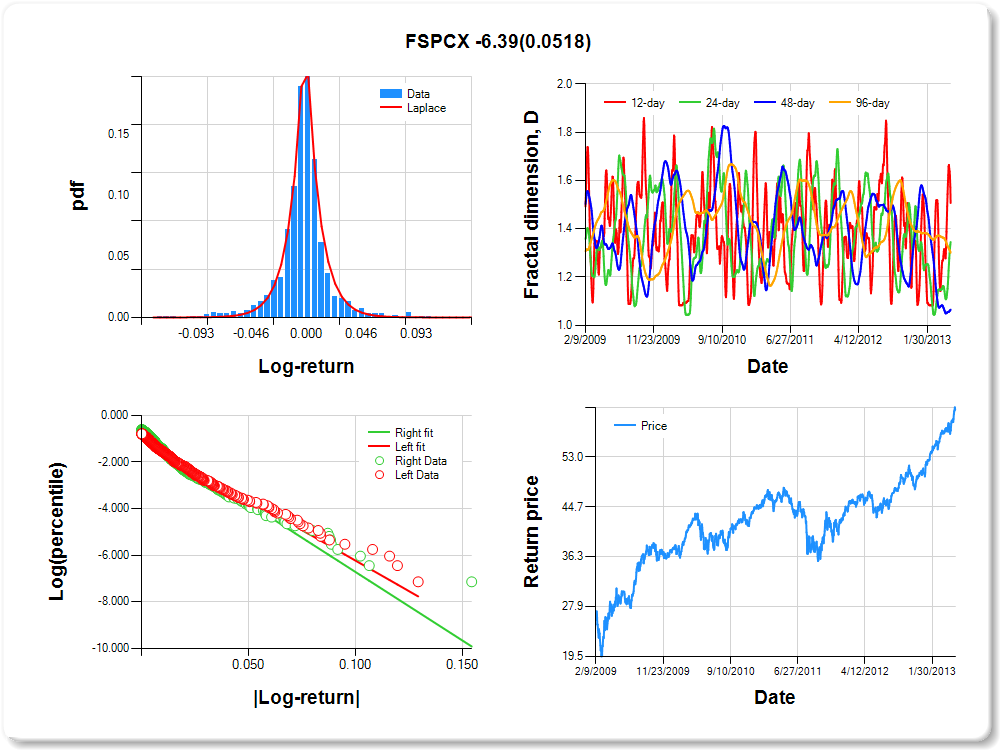
FSPCX
Percentile values of daily loss(gain) in per cent
| 0.5 | 1 | 5 | 10 | 25 | 50 | 75 | 90 | 95 | 99 | 99.5 |
| -0.08 |
-0.07 |
-0.03 |
-0.02 |
-0.01 |
0.00 |
0.01 |
0.03 |
0.07 |
0.09 |
0.75 |
Daily log-return distribution fitting results
| Distribution | Location, a | Scale, b |
| Laplace |
-0.133 |
0.139 |
Linear regression results [Model: y=log(percentile of log-return), x=|log-return|]
| Variable | Coef(b) | s.e.(b) | t-value | P-value |
| Constant |
-0.994 |
0.054 |
-18.266 |
0.0000 |
|log-return| |
-52.332 |
2.278 |
-22.972 |
0.0000 |
I(right-tail) |
0.152 |
0.074 |
2.070 |
0.0386 |
|log-return|*I(right-tail) |
-6.393 |
3.284 |
-1.946 |
0.0518 |
Hurst exponent (of daily return price)
| 12-day | 24-day | 48-day | 96-day |
| 0.493 |
0.655 |
0.935 |
0.699 |
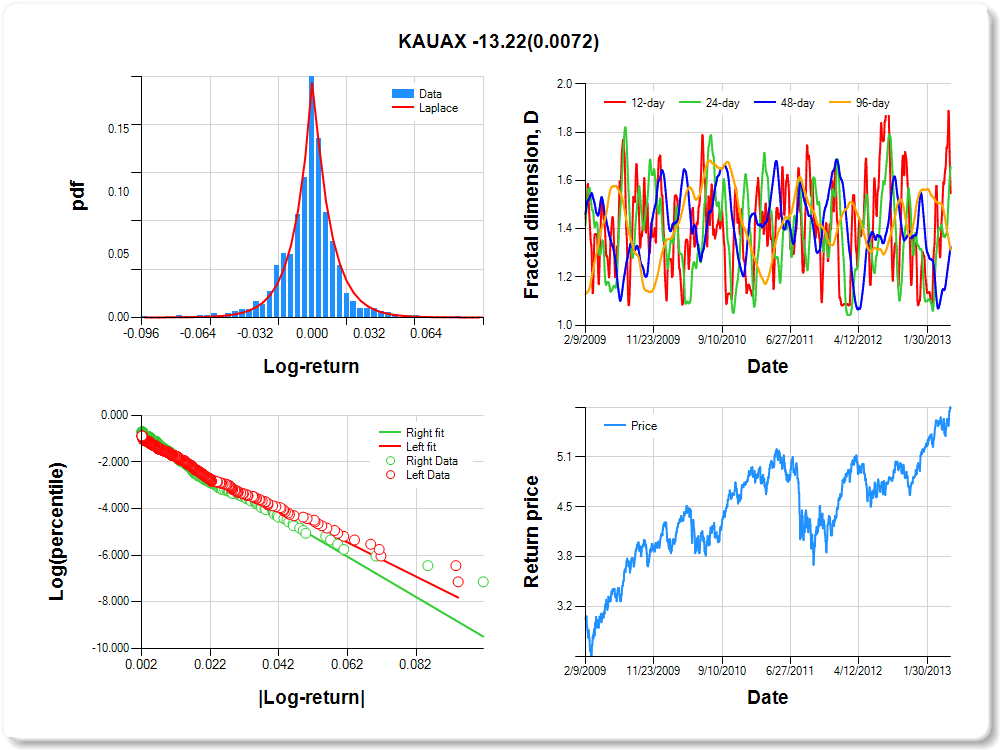
KAUAX
Percentile values of daily loss(gain) in per cent
| 0.5 | 1 | 5 | 10 | 25 | 50 | 75 | 90 | 95 | 99 | 99.5 |
| -0.06 |
-0.05 |
-0.03 |
-0.02 |
-0.01 |
0.00 |
0.01 |
0.02 |
0.05 |
0.06 |
0.30 |
Daily log-return distribution fitting results
| Distribution | Location, a | Scale, b |
| Laplace |
-0.027 |
0.176 |
Linear regression results [Model: y=log(percentile of log-return), x=|log-return|]
| Variable | Coef(b) | s.e.(b) | t-value | P-value |
| Constant |
-0.928 |
0.062 |
-15.049 |
0.0000 |
|log-return| |
-73.298 |
3.325 |
-22.042 |
0.0000 |
I(right-tail) |
0.203 |
0.084 |
2.413 |
0.0160 |
|log-return|*I(right-tail) |
-13.223 |
4.908 |
-2.694 |
0.0072 |
Hurst exponent (of daily return price)
| 12-day | 24-day | 48-day | 96-day |
| 0.453 |
0.340 |
0.675 |
0.688 |
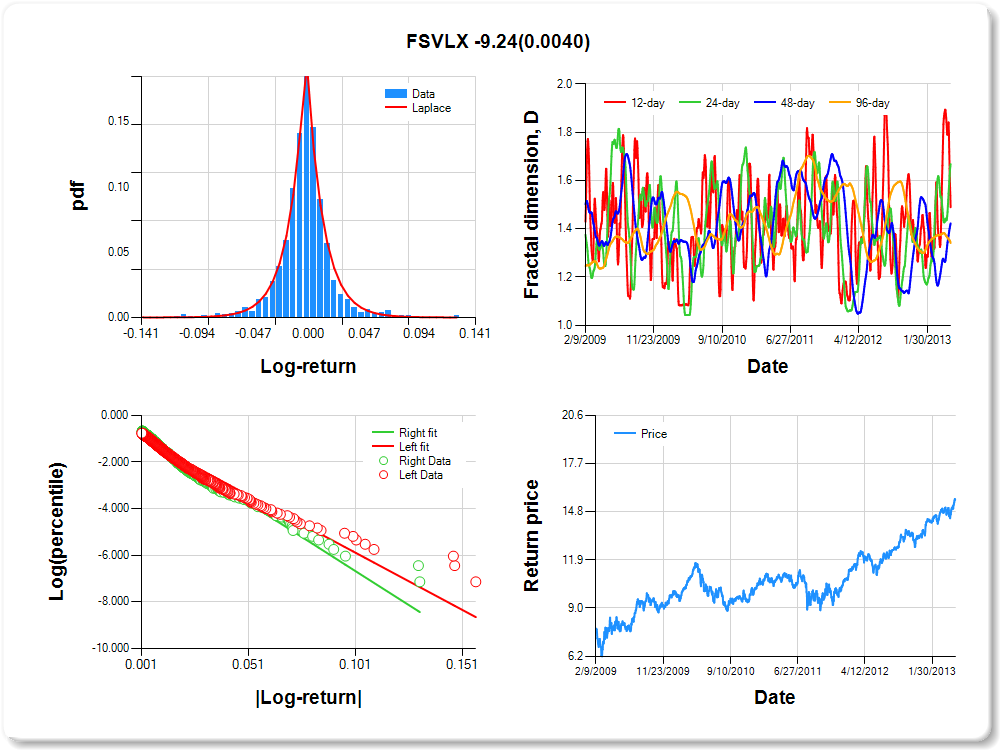
FSVLX
Percentile values of daily loss(gain) in per cent
| 0.5 | 1 | 5 | 10 | 25 | 50 | 75 | 90 | 95 | 99 | 99.5 |
| -0.10 |
-0.07 |
-0.03 |
-0.02 |
-0.01 |
0.00 |
0.01 |
0.03 |
0.07 |
0.08 |
0.29 |
Daily log-return distribution fitting results
| Distribution | Location, a | Scale, b |
| Laplace |
0.164 |
0.168 |
Linear regression results [Model: y=log(percentile of log-return), x=|log-return|]
| Variable | Coef(b) | s.e.(b) | t-value | P-value |
| Constant |
-0.966 |
0.054 |
-17.876 |
0.0000 |
|log-return| |
-49.069 |
2.131 |
-23.026 |
0.0000 |
I(right-tail) |
0.138 |
0.075 |
1.833 |
0.0671 |
|log-return|*I(right-tail) |
-9.239 |
3.208 |
-2.880 |
0.0040 |
Hurst exponent (of daily return price)
| 12-day | 24-day | 48-day | 96-day |
| 0.510 |
0.332 |
0.577 |
0.659 |
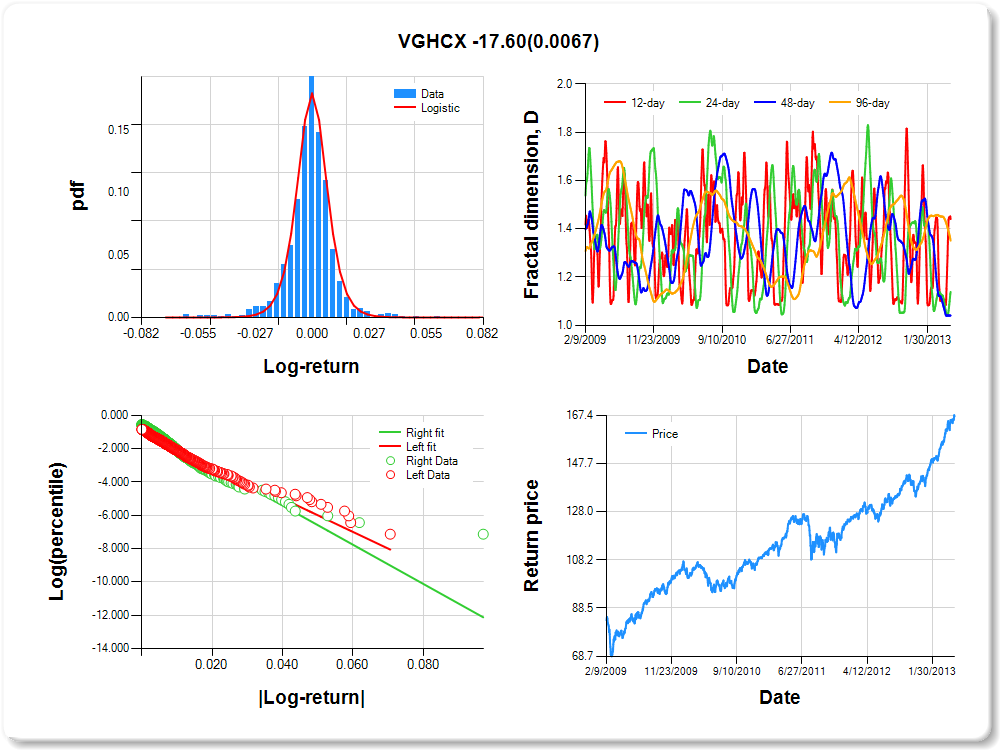
VGHCX
Percentile values of daily loss(gain) in per cent
| 0.5 | 1 | 5 | 10 | 25 | 50 | 75 | 90 | 95 | 99 | 99.5 |
| -0.05 |
-0.04 |
-0.02 |
-0.01 |
0.00 |
0.00 |
0.01 |
0.02 |
0.03 |
0.04 |
0.00 |
Daily log-return distribution fitting results
| Distribution | Location, a | Scale, b |
| Logistic |
-0.240 |
0.096 |
Linear regression results [Model: y=log(percentile of log-return), x=|log-return|]
| Variable | Coef(b) | s.e.(b) | t-value | P-value |
| Constant |
-0.995 |
0.058 |
-17.308 |
0.0000 |
|log-return| |
-100.017 |
4.485 |
-22.301 |
0.0000 |
I(right-tail) |
0.288 |
0.077 |
3.753 |
0.0002 |
|log-return|*I(right-tail) |
-17.597 |
6.482 |
-2.715 |
0.0067 |
Hurst exponent (of daily return price)
| 12-day | 24-day | 48-day | 96-day |
| 0.559 |
0.862 |
0.959 |
0.649 |
VGRIX
Percentile values of daily loss(gain) in per cent
| 0.5 | 1 | 5 | 10 | 25 | 50 | 75 | 90 | 95 | 99 | 99.5 |
| -0.07 |
-0.05 |
-0.03 |
-0.02 |
-0.01 |
0.00 |
0.01 |
0.02 |
0.04 |
0.06 |
1.30 |
Daily log-return distribution fitting results
| Distribution | Location, a | Scale, b |
| Laplace |
-0.149 |
0.155 |
Linear regression results [Model: y=log(percentile of log-return), x=|log-return|]
| Variable | Coef(b) | s.e.(b) | t-value | P-value |
| Constant |
-0.985 |
0.056 |
-17.661 |
0.0000 |
|log-return| |
-68.835 |
3.022 |
-22.778 |
0.0000 |
I(right-tail) |
0.209 |
0.076 |
2.760 |
0.0059 |
|log-return|*I(right-tail) |
-12.556 |
4.456 |
-2.818 |
0.0049 |
Hurst exponent (of daily return price)
| 12-day | 24-day | 48-day | 96-day |
| 0.425 |
0.564 |
0.836 |
0.644 |

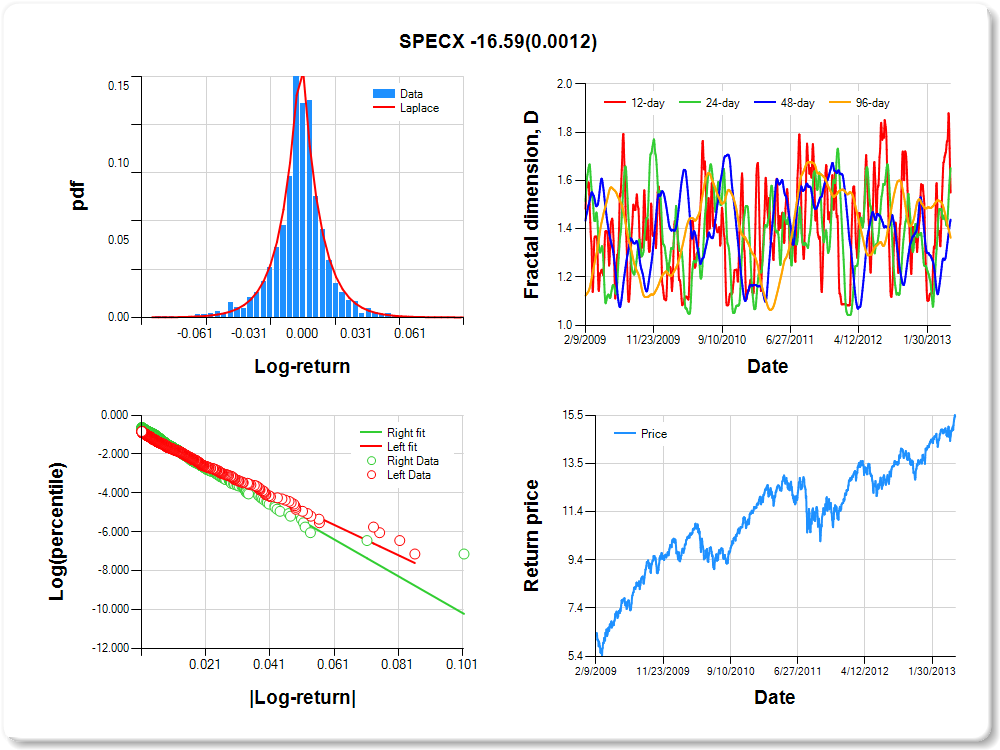
SPECX
Percentile values of daily loss(gain) in per cent
| 0.5 | 1 | 5 | 10 | 25 | 50 | 75 | 90 | 95 | 99 | 99.5 |
| -0.05 |
-0.05 |
-0.03 |
-0.02 |
-0.01 |
0.00 |
0.01 |
0.02 |
0.04 |
0.05 |
1.02 |
Daily log-return distribution fitting results
| Distribution | Location, a | Scale, b |
| Laplace |
-0.128 |
0.190 |
Linear regression results [Model: y=log(percentile of log-return), x=|log-return|]
| Variable | Coef(b) | s.e.(b) | t-value | P-value |
| Constant |
-0.910 |
0.059 |
-15.413 |
0.0000 |
|log-return| |
-77.950 |
3.432 |
-22.710 |
0.0000 |
I(right-tail) |
0.258 |
0.081 |
3.196 |
0.0014 |
|log-return|*I(right-tail) |
-16.590 |
5.106 |
-3.249 |
0.0012 |
Hurst exponent (of daily return price)
| 12-day | 24-day | 48-day | 96-day |
| 0.450 |
0.349 |
0.562 |
0.637 |
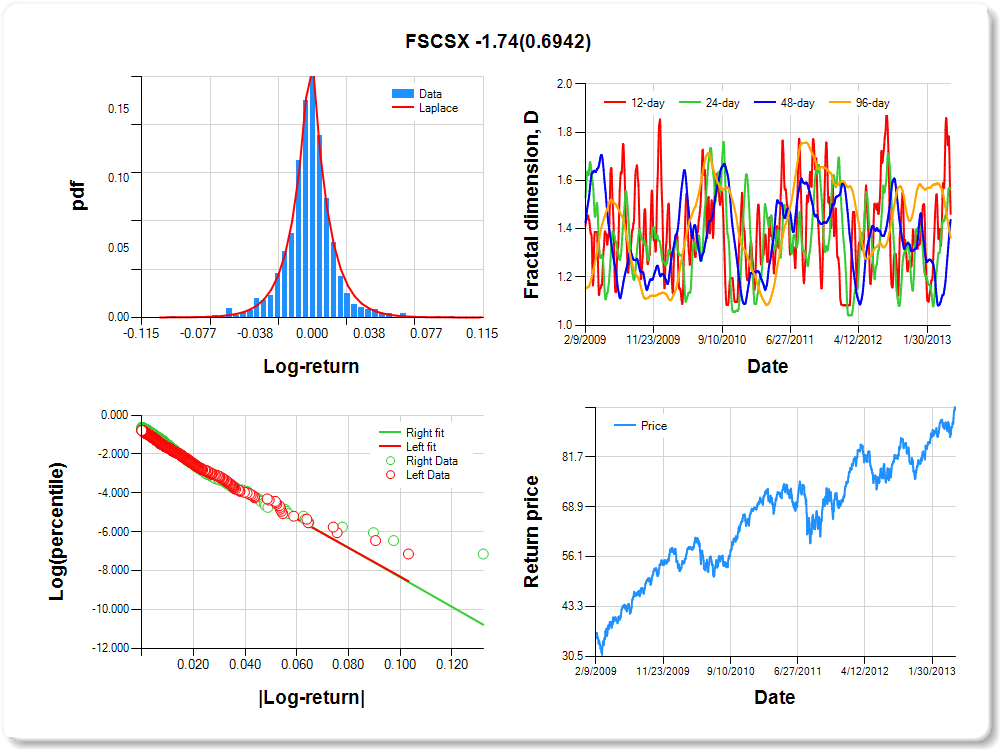
FSCSX
Percentile values of daily loss(gain) in per cent
| 0.5 | 1 | 5 | 10 | 25 | 50 | 75 | 90 | 95 | 99 | 99.5 |
| -0.06 |
-0.05 |
-0.03 |
-0.02 |
-0.01 |
0.00 |
0.01 |
0.03 |
0.05 |
0.06 |
1.56 |
Daily log-return distribution fitting results
| Distribution | Location, a | Scale, b |
| Laplace |
-0.195 |
0.166 |
Linear regression results [Model: y=log(percentile of log-return), x=|log-return|]
| Variable | Coef(b) | s.e.(b) | t-value | P-value |
| Constant |
-0.882 |
0.057 |
-15.522 |
0.0000 |
|log-return| |
-74.132 |
3.189 |
-23.247 |
0.0000 |
I(right-tail) |
0.135 |
0.077 |
1.756 |
0.0793 |
|log-return|*I(right-tail) |
-1.739 |
4.421 |
-0.393 |
0.6942 |
Hurst exponent (of daily return price)
| 12-day | 24-day | 48-day | 96-day |
| 0.539 |
0.432 |
0.563 |
0.637 |
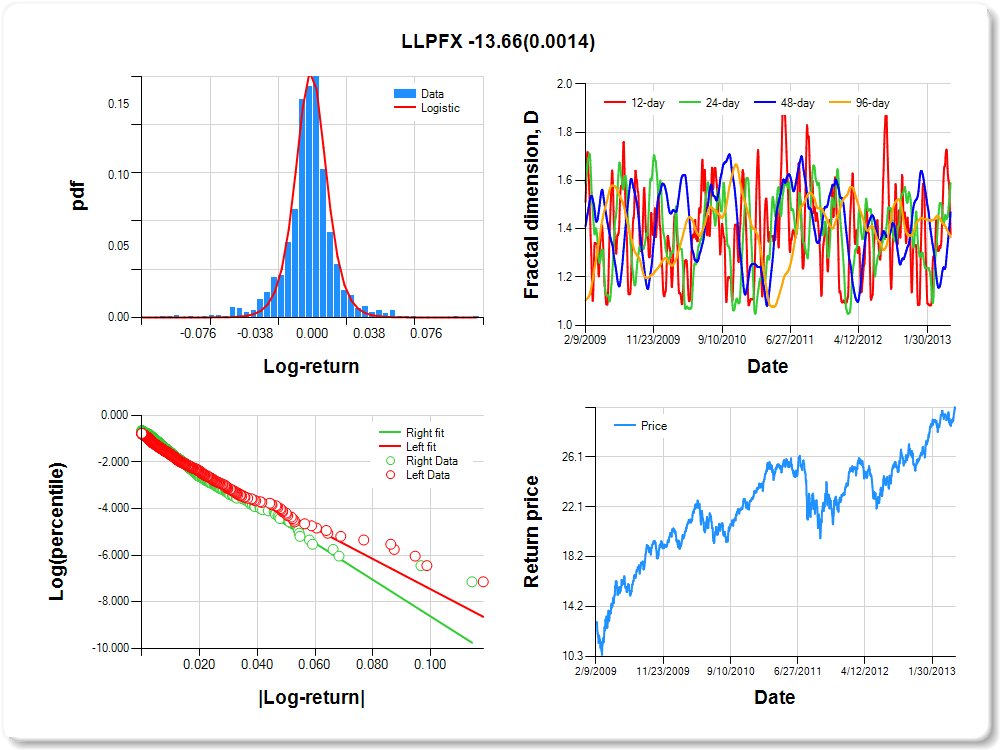
LLPFX
Percentile values of daily loss(gain) in per cent
| 0.5 | 1 | 5 | 10 | 25 | 50 | 75 | 90 | 95 | 99 | 99.5 |
| -0.07 |
-0.05 |
-0.03 |
-0.02 |
-0.01 |
0.00 |
0.01 |
0.03 |
0.05 |
0.06 |
0.65 |
Daily log-return distribution fitting results
| Distribution | Location, a | Scale, b |
| Logistic |
0.047 |
0.099 |
Linear regression results [Model: y=log(percentile of log-return), x=|log-return|]
| Variable | Coef(b) | s.e.(b) | t-value | P-value |
| Constant |
-0.954 |
0.054 |
-17.503 |
0.0000 |
|log-return| |
-64.887 |
2.798 |
-23.188 |
0.0000 |
I(right-tail) |
0.203 |
0.077 |
2.643 |
0.0083 |
|log-return|*I(right-tail) |
-13.662 |
4.255 |
-3.210 |
0.0014 |
Hurst exponent (of daily return price)
| 12-day | 24-day | 48-day | 96-day |
| 0.624 |
0.410 |
0.531 |
0.635 |
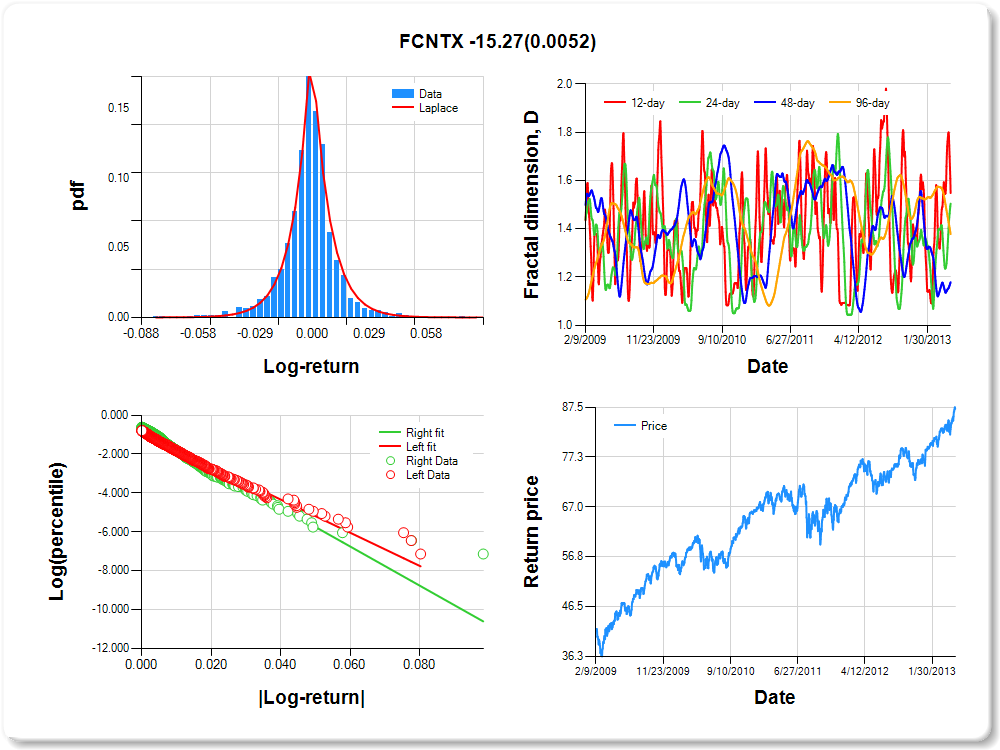
FCNTX
Percentile values of daily loss(gain) in per cent
| 0.5 | 1 | 5 | 10 | 25 | 50 | 75 | 90 | 95 | 99 | 99.5 |
| -0.06 |
-0.04 |
-0.02 |
-0.01 |
-0.01 |
0.00 |
0.01 |
0.02 |
0.04 |
0.05 |
0.76 |
Daily log-return distribution fitting results
| Distribution | Location, a | Scale, b |
| Laplace |
-0.148 |
0.171 |
Linear regression results [Model: y=log(percentile of log-return), x=|log-return|]
| Variable | Coef(b) | s.e.(b) | t-value | P-value |
| Constant |
-0.918 |
0.056 |
-16.351 |
0.0000 |
|log-return| |
-85.267 |
3.679 |
-23.179 |
0.0000 |
I(right-tail) |
0.208 |
0.077 |
2.701 |
0.0070 |
|log-return|*I(right-tail) |
-15.270 |
5.450 |
-2.802 |
0.0052 |
Hurst exponent (of daily return price)
| 12-day | 24-day | 48-day | 96-day |
| 0.452 |
0.496 |
0.821 |
0.622 |
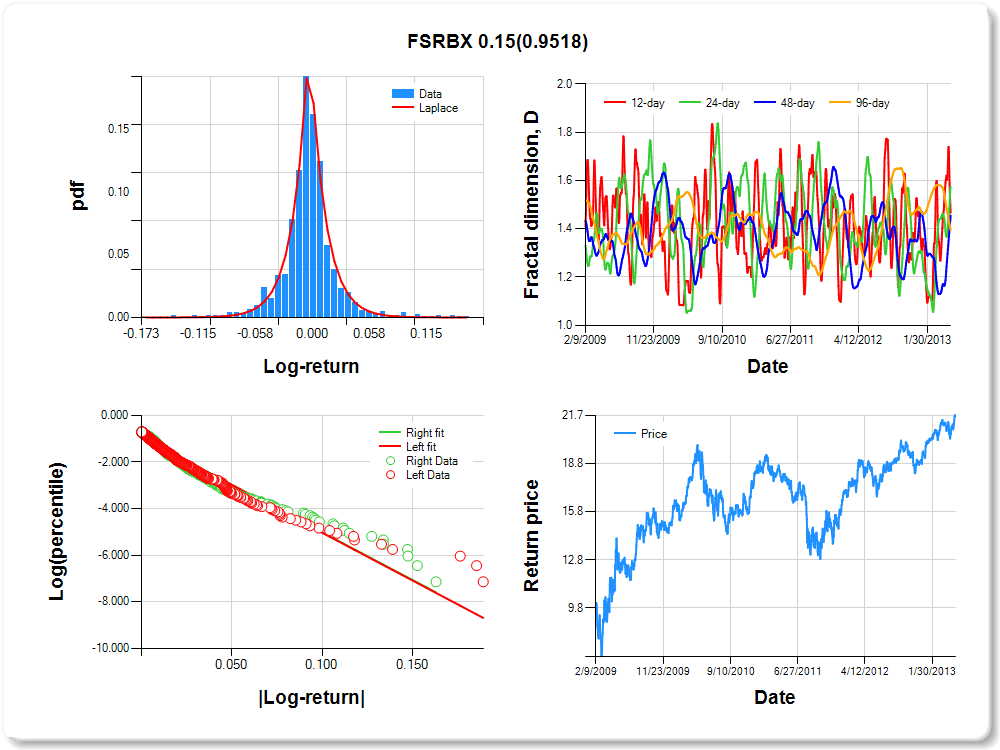
FSRBX
Percentile values of daily loss(gain) in per cent
| 0.5 | 1 | 5 | 10 | 25 | 50 | 75 | 90 | 95 | 99 | 99.5 |
| -0.11 |
-0.08 |
-0.04 |
-0.03 |
-0.01 |
0.00 |
0.01 |
0.04 |
0.10 |
0.14 |
1.41 |
Daily log-return distribution fitting results
| Distribution | Location, a | Scale, b |
| Laplace |
0.129 |
0.153 |
Linear regression results [Model: y=log(percentile of log-return), x=|log-return|]
| Variable | Coef(b) | s.e.(b) | t-value | P-value |
| Constant |
-0.931 |
0.052 |
-17.896 |
0.0000 |
|log-return| |
-40.860 |
1.725 |
-23.683 |
0.0000 |
I(right-tail) |
0.000 |
0.073 |
-0.001 |
0.9989 |
|log-return|*I(right-tail) |
0.147 |
2.432 |
0.061 |
0.9518 |
Hurst exponent (of daily return price)
| 12-day | 24-day | 48-day | 96-day |
| 0.533 |
0.425 |
0.545 |
0.605 |
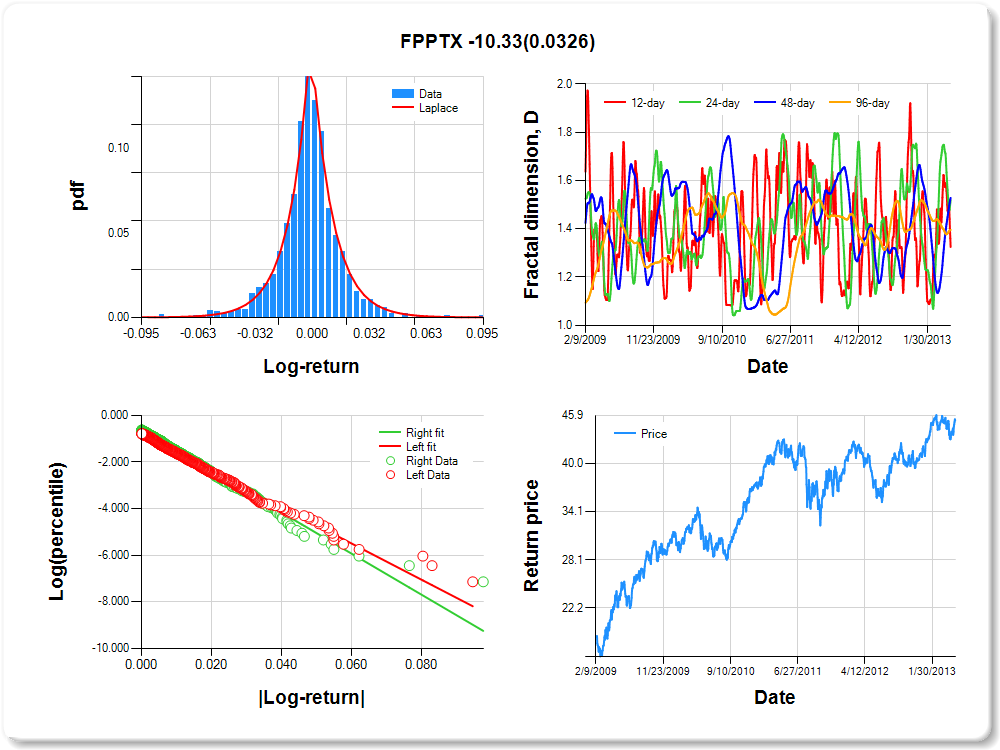
FPPTX
Percentile values of daily loss(gain) in per cent
| 0.5 | 1 | 5 | 10 | 25 | 50 | 75 | 90 | 95 | 99 | 99.5 |
| -0.05 |
-0.05 |
-0.03 |
-0.02 |
-0.01 |
0.00 |
0.01 |
0.03 |
0.04 |
0.05 |
1.13 |
Daily log-return distribution fitting results
| Distribution | Location, a | Scale, b |
| Laplace |
-0.008 |
0.207 |
Linear regression results [Model: y=log(percentile of log-return), x=|log-return|]
| Variable | Coef(b) | s.e.(b) | t-value | P-value |
| Constant |
-0.826 |
0.059 |
-14.066 |
0.0000 |
|log-return| |
-77.540 |
3.335 |
-23.247 |
0.0000 |
I(right-tail) |
0.187 |
0.081 |
2.325 |
0.0202 |
|log-return|*I(right-tail) |
-10.326 |
4.827 |
-2.139 |
0.0326 |
Hurst exponent (of daily return price)
| 12-day | 24-day | 48-day | 96-day |
| 0.675 |
0.483 |
0.472 |
0.604 |
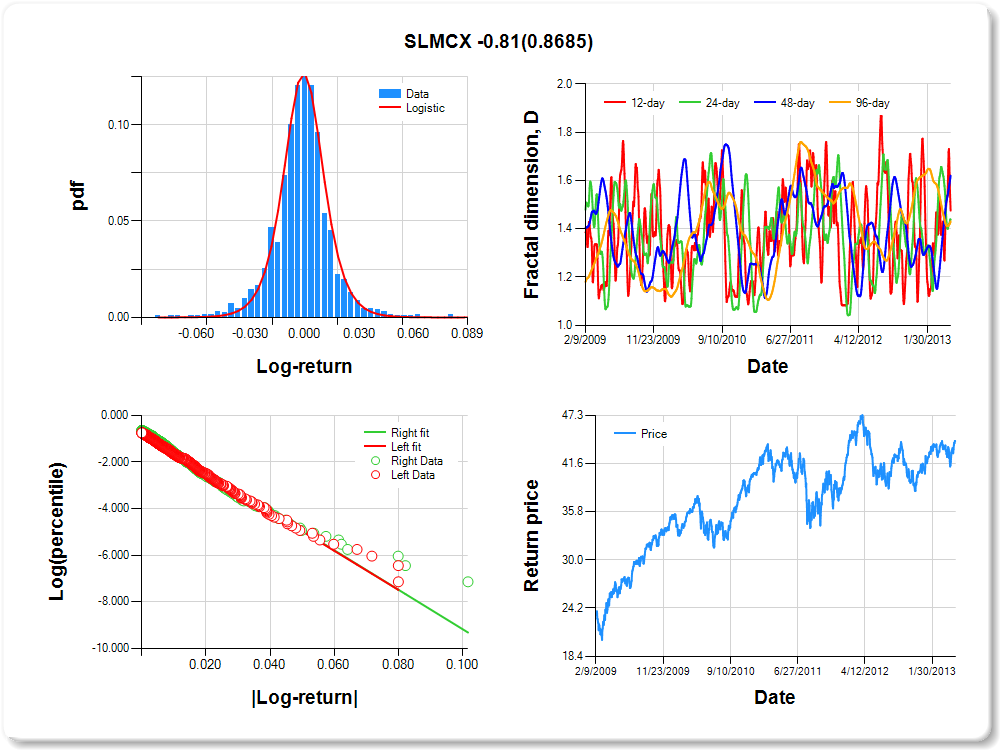
SLMCX
Percentile values of daily loss(gain) in per cent
| 0.5 | 1 | 5 | 10 | 25 | 50 | 75 | 90 | 95 | 99 | 99.5 |
| -0.05 |
-0.04 |
-0.03 |
-0.02 |
-0.01 |
0.00 |
0.01 |
0.03 |
0.05 |
0.06 |
1.63 |
Daily log-return distribution fitting results
| Distribution | Location, a | Scale, b |
| Logistic |
-0.184 |
0.135 |
Linear regression results [Model: y=log(percentile of log-return), x=|log-return|]
| Variable | Coef(b) | s.e.(b) | t-value | P-value |
| Constant |
-0.772 |
0.058 |
-13.294 |
0.0000 |
|log-return| |
-83.680 |
3.525 |
-23.738 |
0.0000 |
I(right-tail) |
0.070 |
0.080 |
0.875 |
0.3817 |
|log-return|*I(right-tail) |
-0.812 |
4.905 |
-0.166 |
0.8685 |
Hurst exponent (of daily return price)
| 12-day | 24-day | 48-day | 96-day |
| 0.525 |
0.562 |
0.380 |
0.569 |
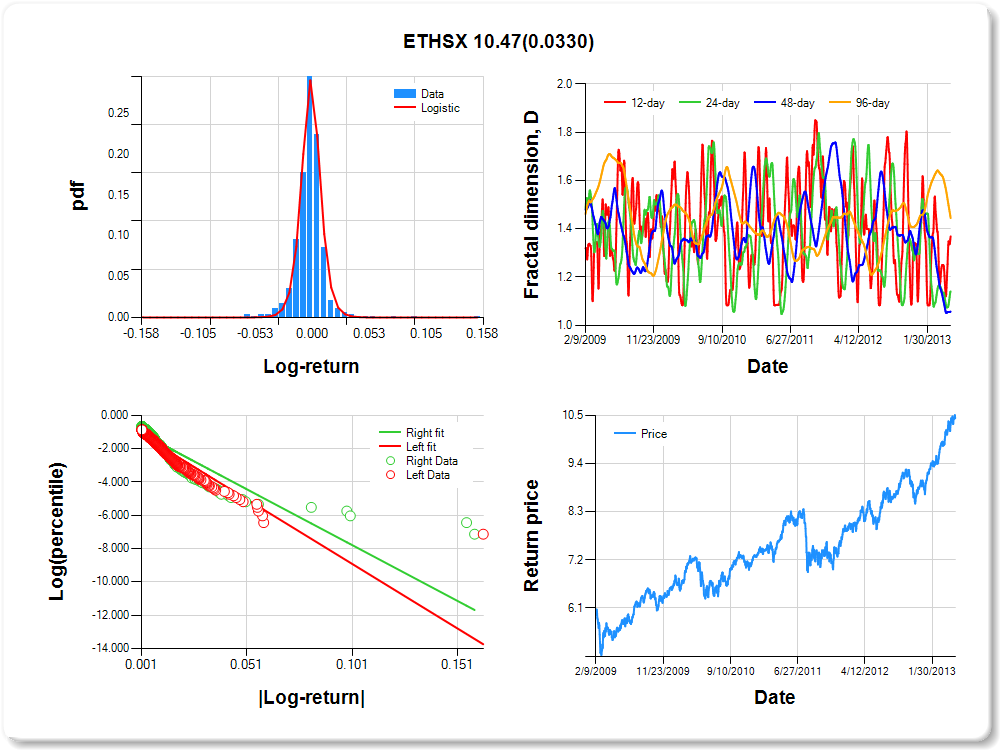
ETHSX
Percentile values of daily loss(gain) in per cent
| 0.5 | 1 | 5 | 10 | 25 | 50 | 75 | 90 | 95 | 99 | 99.5 |
| -0.05 |
-0.04 |
-0.02 |
-0.01 |
-0.01 |
0.00 |
0.01 |
0.02 |
0.04 |
0.05 |
1.55 |
Daily log-return distribution fitting results
| Distribution | Location, a | Scale, b |
| Logistic |
0.040 |
0.059 |
Linear regression results [Model: y=log(percentile of log-return), x=|log-return|]
| Variable | Coef(b) | s.e.(b) | t-value | P-value |
| Constant |
-1.109 |
0.057 |
-19.374 |
0.0000 |
|log-return| |
-77.416 |
3.767 |
-20.551 |
0.0000 |
I(right-tail) |
0.072 |
0.075 |
0.955 |
0.3400 |
|log-return|*I(right-tail) |
10.471 |
4.905 |
2.135 |
0.0330 |
Hurst exponent (of daily return price)
| 12-day | 24-day | 48-day | 96-day |
| 0.631 |
0.859 |
0.943 |
0.556 |
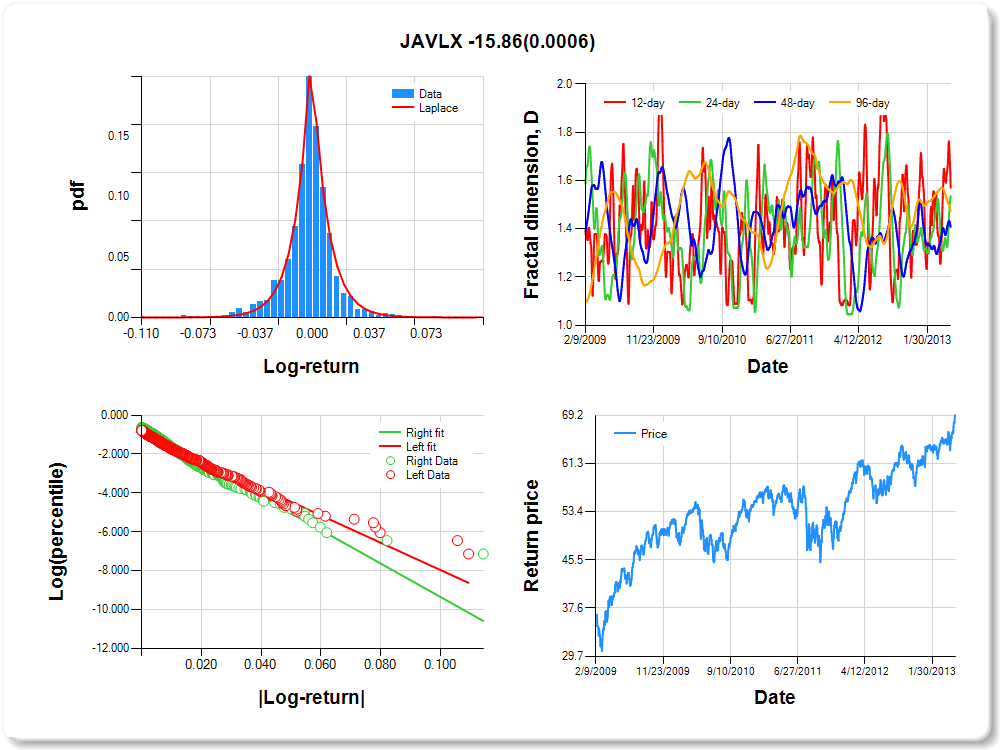
JAVLX
Percentile values of daily loss(gain) in per cent
| 0.5 | 1 | 5 | 10 | 25 | 50 | 75 | 90 | 95 | 99 | 99.5 |
| -0.07 |
-0.05 |
-0.03 |
-0.02 |
-0.01 |
0.00 |
0.01 |
0.02 |
0.05 |
0.06 |
1.75 |
Daily log-return distribution fitting results
| Distribution | Location, a | Scale, b |
| Laplace |
-0.016 |
0.153 |
Linear regression results [Model: y=log(percentile of log-return), x=|log-return|]
| Variable | Coef(b) | s.e.(b) | t-value | P-value |
| Constant |
-0.939 |
0.055 |
-16.983 |
0.0000 |
|log-return| |
-70.117 |
3.028 |
-23.153 |
0.0000 |
I(right-tail) |
0.203 |
0.077 |
2.651 |
0.0081 |
|log-return|*I(right-tail) |
-15.856 |
4.602 |
-3.446 |
0.0006 |
Hurst exponent (of daily return price)
| 12-day | 24-day | 48-day | 96-day |
| 0.429 |
0.464 |
0.592 |
0.526 |
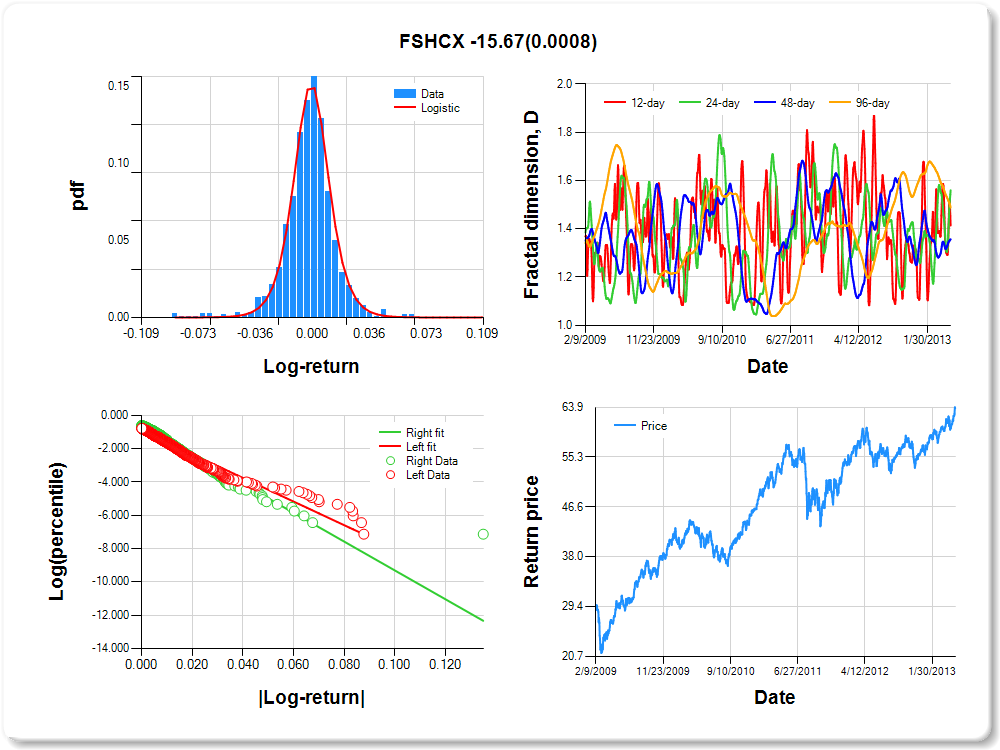
FSHCX
Percentile values of daily loss(gain) in per cent
| 0.5 | 1 | 5 | 10 | 25 | 50 | 75 | 90 | 95 | 99 | 99.5 |
| -0.07 |
-0.06 |
-0.02 |
-0.02 |
-0.01 |
0.00 |
0.01 |
0.02 |
0.04 |
0.05 |
0.76 |
Daily log-return distribution fitting results
| Distribution | Location, a | Scale, b |
| Logistic |
-0.341 |
0.113 |
Linear regression results [Model: y=log(percentile of log-return), x=|log-return|]
| Variable | Coef(b) | s.e.(b) | t-value | P-value |
| Constant |
-0.923 |
0.056 |
-16.400 |
0.0000 |
|log-return| |
-70.803 |
3.096 |
-22.867 |
0.0000 |
I(right-tail) |
0.268 |
0.079 |
3.410 |
0.0007 |
|log-return|*I(right-tail) |
-15.666 |
4.674 |
-3.352 |
0.0008 |
Hurst exponent (of daily return price)
| 12-day | 24-day | 48-day | 96-day |
| 0.586 |
0.440 |
0.644 |
0.512 |
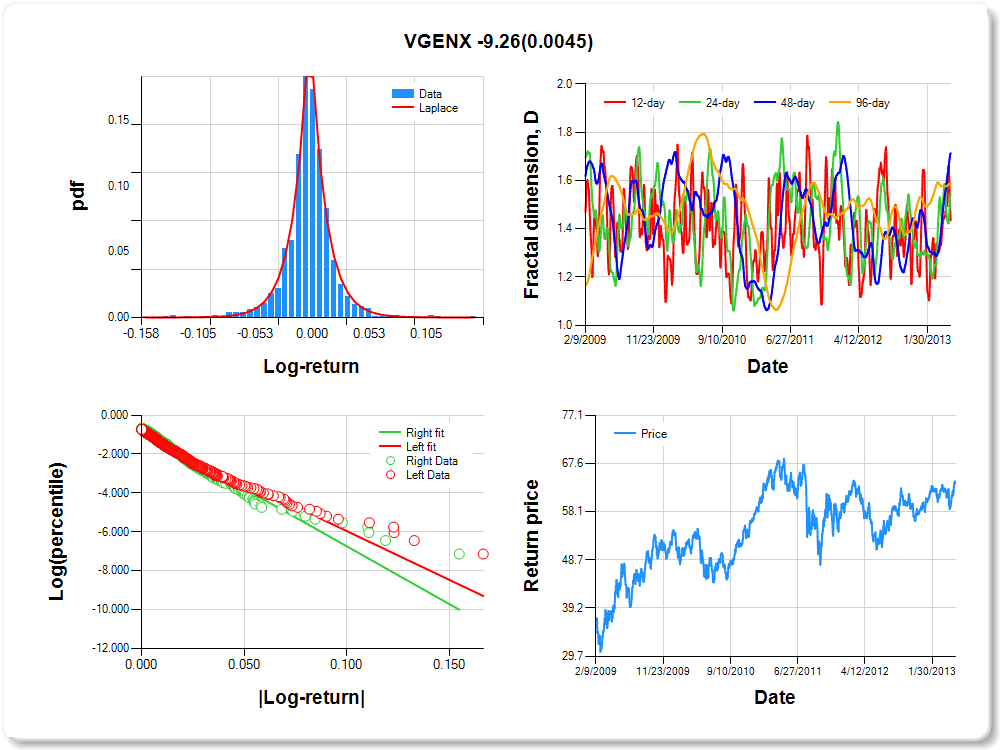
VGENX
Percentile values of daily loss(gain) in per cent
| 0.5 | 1 | 5 | 10 | 25 | 50 | 75 | 90 | 95 | 99 | 99.5 |
| -0.09 |
-0.07 |
-0.03 |
-0.02 |
-0.01 |
0.00 |
0.01 |
0.03 |
0.06 |
0.08 |
1.19 |
Daily log-return distribution fitting results
| Distribution | Location, a | Scale, b |
| Laplace |
0.068 |
0.150 |
Linear regression results [Model: y=log(percentile of log-return), x=|log-return|]
| Variable | Coef(b) | s.e.(b) | t-value | P-value |
| Constant |
-0.938 |
0.053 |
-17.834 |
0.0000 |
|log-return| |
-50.170 |
2.130 |
-23.559 |
0.0000 |
I(right-tail) |
0.144 |
0.075 |
1.915 |
0.0558 |
|log-return|*I(right-tail) |
-9.265 |
3.252 |
-2.849 |
0.0045 |
Hurst exponent (of daily return price)
| 12-day | 24-day | 48-day | 96-day |
| 0.565 |
0.454 |
0.286 |
0.413 |