FSLBX
Percentile values of daily loss(gain) in per cent
| 0.5 | 1 | 5 | 10 | 25 | 50 | 75 | 90 | 95 | 99 | 99.5 |
| -0.06 |
-0.06 |
-0.03 |
-0.02 |
-0.01 |
0.00 |
0.01 |
0.03 |
0.05 |
0.06 |
1.06 |
Daily log-return distribution fitting results
| Distribution | Location, a | Scale, b |
| Laplace |
0.093 |
0.212 |
Linear regression results [Model: y=log(percentile of log-return), x=|log-return|]
| Variable | Coef(b) | s.e.(b) | t-value | P-value |
| Constant |
-0.916 |
0.089 |
-10.252 |
0.0000 |
|log-return| |
-66.780 |
4.662 |
-14.325 |
0.0000 |
I(right-tail) |
0.188 |
0.122 |
1.541 |
0.1240 |
|log-return|*I(right-tail) |
-8.413 |
6.706 |
-1.254 |
0.2103 |
Hurst exponent (of daily return price)
| 12-day | 24-day | 48-day | 96-day |
| 0.409 |
0.378 |
0.525 |
0.806 |

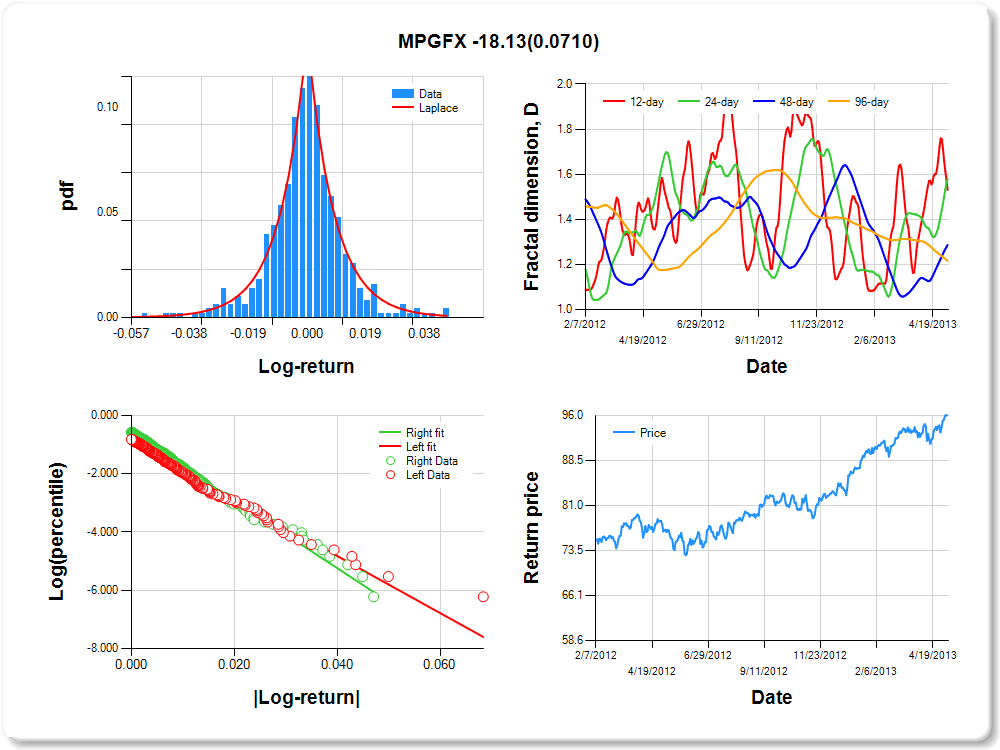
MPGFX
Percentile values of daily loss(gain) in per cent
| 0.5 | 1 | 5 | 10 | 25 | 50 | 75 | 90 | 95 | 99 | 99.5 |
| -0.04 |
-0.04 |
-0.02 |
-0.01 |
-0.01 |
0.00 |
0.01 |
0.02 |
0.04 |
0.04 |
0.00 |
Daily log-return distribution fitting results
| Distribution | Location, a | Scale, b |
| Laplace |
0.349 |
0.257 |
Linear regression results [Model: y=log(percentile of log-return), x=|log-return|]
| Variable | Coef(b) | s.e.(b) | t-value | P-value |
| Constant |
-0.910 |
0.093 |
-9.787 |
0.0000 |
|log-return| |
-97.767 |
6.956 |
-14.055 |
0.0000 |
I(right-tail) |
0.313 |
0.126 |
2.480 |
0.0135 |
|log-return|*I(right-tail) |
-18.135 |
10.021 |
-1.810 |
0.0710 |
Hurst exponent (of daily return price)
| 12-day | 24-day | 48-day | 96-day |
| 0.470 |
0.421 |
0.713 |
0.785 |
UNSCX
Percentile values of daily loss(gain) in per cent
| 0.5 | 1 | 5 | 10 | 25 | 50 | 75 | 90 | 95 | 99 | 99.5 |
| -0.05 |
-0.04 |
-0.02 |
-0.02 |
-0.01 |
0.00 |
0.01 |
0.02 |
0.04 |
0.05 |
2.03 |
Daily log-return distribution fitting results
| Distribution | Location, a | Scale, b |
| Logistic |
0.298 |
0.163 |
Linear regression results [Model: y=log(percentile of log-return), x=|log-return|]
| Variable | Coef(b) | s.e.(b) | t-value | P-value |
| Constant |
-0.874 |
0.095 |
-9.172 |
0.0000 |
|log-return| |
-88.125 |
6.306 |
-13.975 |
0.0000 |
I(right-tail) |
0.306 |
0.133 |
2.297 |
0.0221 |
|log-return|*I(right-tail) |
-18.237 |
9.321 |
-1.957 |
0.0510 |
Hurst exponent (of daily return price)
| 12-day | 24-day | 48-day | 96-day |
| 0.541 |
0.378 |
0.785 |
0.716 |

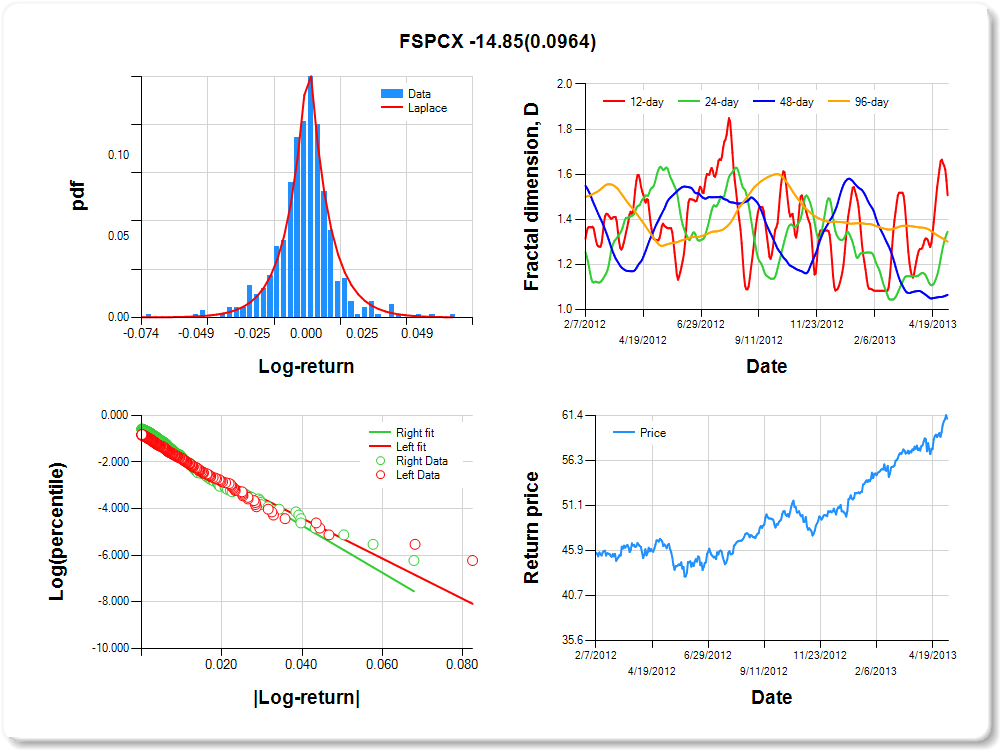
FSPCX
Percentile values of daily loss(gain) in per cent
| 0.5 | 1 | 5 | 10 | 25 | 50 | 75 | 90 | 95 | 99 | 99.5 |
| -0.05 |
-0.04 |
-0.02 |
-0.01 |
-0.01 |
0.00 |
0.01 |
0.02 |
0.04 |
0.04 |
3.06 |
Daily log-return distribution fitting results
| Distribution | Location, a | Scale, b |
| Laplace |
0.214 |
0.204 |
Linear regression results [Model: y=log(percentile of log-return), x=|log-return|]
| Variable | Coef(b) | s.e.(b) | t-value | P-value |
| Constant |
-0.956 |
0.091 |
-10.481 |
0.0000 |
|log-return| |
-86.197 |
6.208 |
-13.885 |
0.0000 |
I(right-tail) |
0.285 |
0.123 |
2.309 |
0.0213 |
|log-return|*I(right-tail) |
-14.851 |
8.915 |
-1.666 |
0.0964 |
Hurst exponent (of daily return price)
| 12-day | 24-day | 48-day | 96-day |
| 0.493 |
0.655 |
0.935 |
0.699 |
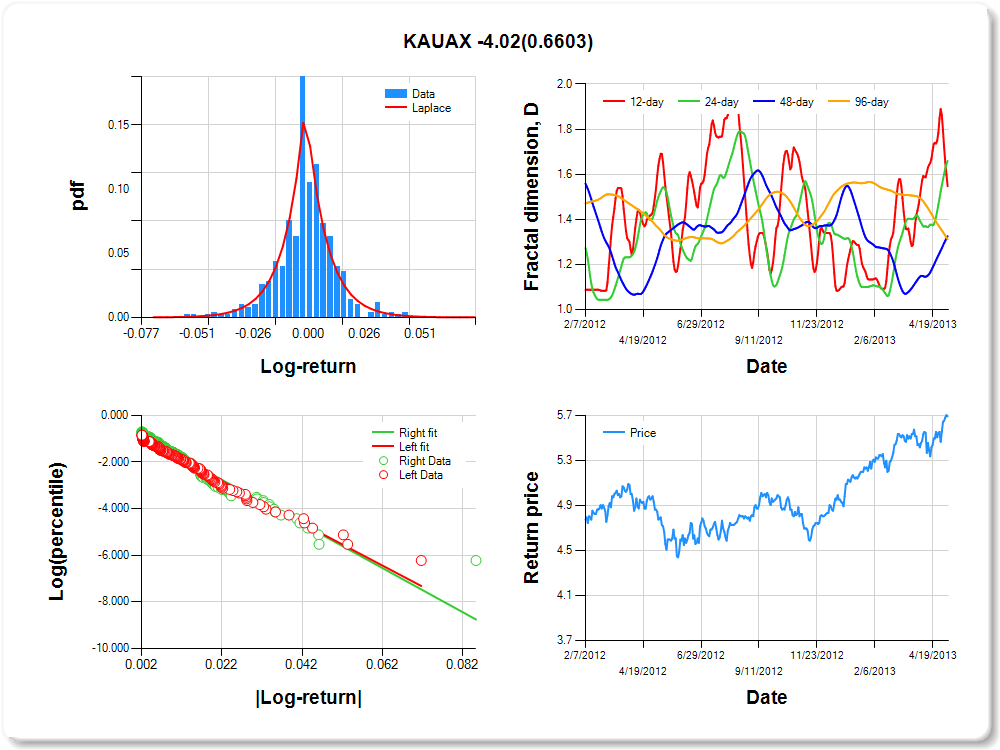
KAUAX
Percentile values of daily loss(gain) in per cent
| 0.5 | 1 | 5 | 10 | 25 | 50 | 75 | 90 | 95 | 99 | 99.5 |
| -0.05 |
-0.04 |
-0.02 |
-0.02 |
-0.01 |
0.00 |
0.01 |
0.02 |
0.04 |
0.04 |
2.01 |
Daily log-return distribution fitting results
| Distribution | Location, a | Scale, b |
| Laplace |
-0.150 |
0.204 |
Linear regression results [Model: y=log(percentile of log-return), x=|log-return|]
| Variable | Coef(b) | s.e.(b) | t-value | P-value |
| Constant |
-0.862 |
0.098 |
-8.797 |
0.0000 |
|log-return| |
-90.380 |
6.508 |
-13.887 |
0.0000 |
I(right-tail) |
0.142 |
0.135 |
1.054 |
0.2924 |
|log-return|*I(right-tail) |
-4.023 |
9.148 |
-0.440 |
0.6603 |
Hurst exponent (of daily return price)
| 12-day | 24-day | 48-day | 96-day |
| 0.453 |
0.340 |
0.675 |
0.688 |
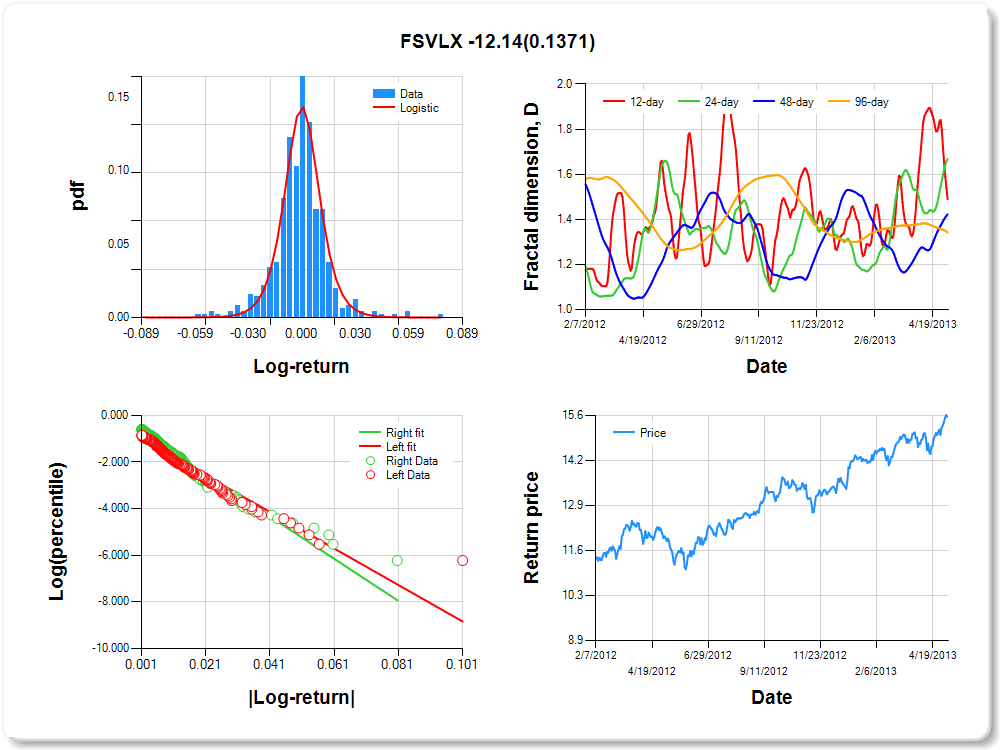
FSVLX
Percentile values of daily loss(gain) in per cent
| 0.5 | 1 | 5 | 10 | 25 | 50 | 75 | 90 | 95 | 99 | 99.5 |
| -0.05 |
-0.05 |
-0.02 |
-0.01 |
-0.01 |
0.00 |
0.01 |
0.02 |
0.04 |
0.06 |
2.07 |
Daily log-return distribution fitting results
| Distribution | Location, a | Scale, b |
| Logistic |
0.225 |
0.119 |
Linear regression results [Model: y=log(percentile of log-return), x=|log-return|]
| Variable | Coef(b) | s.e.(b) | t-value | P-value |
| Constant |
-0.975 |
0.094 |
-10.404 |
0.0000 |
|log-return| |
-78.059 |
5.765 |
-13.539 |
0.0000 |
I(right-tail) |
0.297 |
0.126 |
2.357 |
0.0188 |
|log-return|*I(right-tail) |
-12.142 |
8.154 |
-1.489 |
0.1371 |
Hurst exponent (of daily return price)
| 12-day | 24-day | 48-day | 96-day |
| 0.510 |
0.332 |
0.577 |
0.659 |
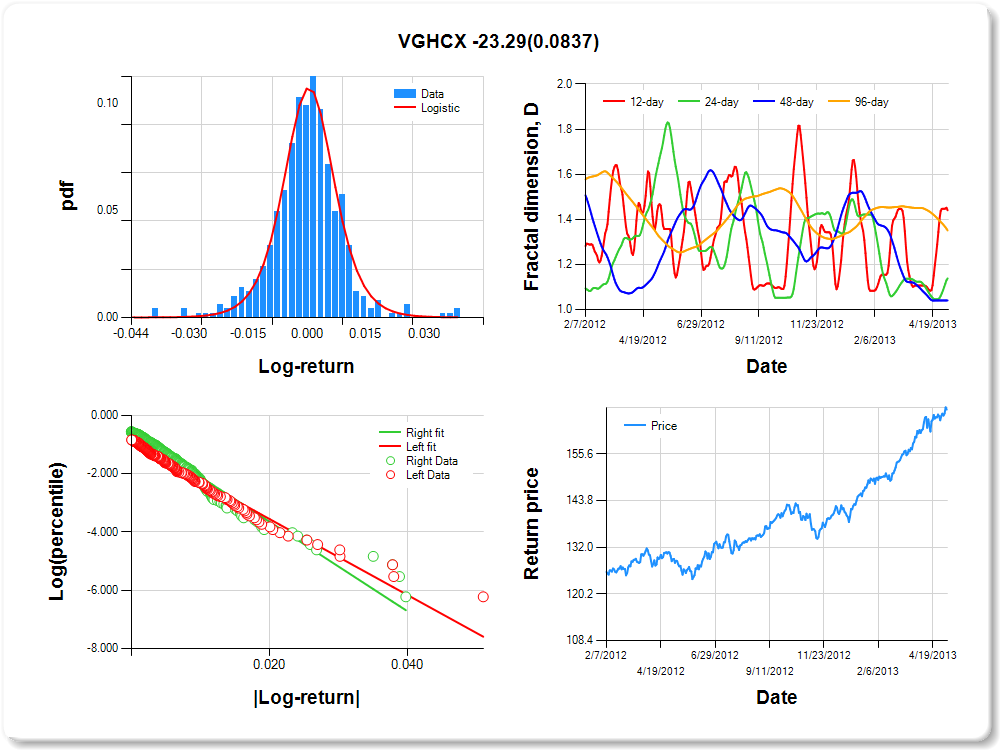
VGHCX
Percentile values of daily loss(gain) in per cent
| 0.5 | 1 | 5 | 10 | 25 | 50 | 75 | 90 | 95 | 99 | 99.5 |
| -0.04 |
-0.03 |
-0.01 |
-0.01 |
0.00 |
0.00 |
0.01 |
0.01 |
0.03 |
0.04 |
0.00 |
Daily log-return distribution fitting results
| Distribution | Location, a | Scale, b |
| Logistic |
0.263 |
0.159 |
Linear regression results [Model: y=log(percentile of log-return), x=|log-return|]
| Variable | Coef(b) | s.e.(b) | t-value | P-value |
| Constant |
-0.942 |
0.093 |
-10.095 |
0.0000 |
|log-return| |
-130.468 |
9.396 |
-13.886 |
0.0000 |
I(right-tail) |
0.374 |
0.126 |
2.959 |
0.0032 |
|log-return|*I(right-tail) |
-23.289 |
13.439 |
-1.733 |
0.0837 |
Hurst exponent (of daily return price)
| 12-day | 24-day | 48-day | 96-day |
| 0.559 |
0.862 |
0.959 |
0.649 |
VGRIX
Percentile values of daily loss(gain) in per cent
| 0.5 | 1 | 5 | 10 | 25 | 50 | 75 | 90 | 95 | 99 | 99.5 |
| -0.05 |
-0.04 |
-0.02 |
-0.01 |
0.00 |
0.00 |
0.01 |
0.02 |
0.03 |
0.04 |
2.11 |
Daily log-return distribution fitting results
| Distribution | Location, a | Scale, b |
| Laplace |
0.337 |
0.229 |
Linear regression results [Model: y=log(percentile of log-return), x=|log-return|]
| Variable | Coef(b) | s.e.(b) | t-value | P-value |
| Constant |
-0.950 |
0.090 |
-10.553 |
0.0000 |
|log-return| |
-95.378 |
6.770 |
-14.088 |
0.0000 |
I(right-tail) |
0.336 |
0.126 |
2.671 |
0.0078 |
|log-return|*I(right-tail) |
-22.869 |
10.123 |
-2.259 |
0.0243 |
Hurst exponent (of daily return price)
| 12-day | 24-day | 48-day | 96-day |
| 0.425 |
0.564 |
0.836 |
0.644 |

SPECX
Percentile values of daily loss(gain) in per cent
| 0.5 | 1 | 5 | 10 | 25 | 50 | 75 | 90 | 95 | 99 | 99.5 |
| -0.05 |
-0.04 |
-0.02 |
-0.01 |
-0.01 |
0.00 |
0.01 |
0.02 |
0.04 |
0.04 |
3.37 |
Daily log-return distribution fitting results
| Distribution | Location, a | Scale, b |
| Logistic |
0.316 |
0.154 |
Linear regression results [Model: y=log(percentile of log-return), x=|log-return|]
| Variable | Coef(b) | s.e.(b) | t-value | P-value |
| Constant |
-0.882 |
0.092 |
-9.586 |
0.0000 |
|log-return| |
-95.039 |
6.697 |
-14.190 |
0.0000 |
I(right-tail) |
0.254 |
0.129 |
1.970 |
0.0494 |
|log-return|*I(right-tail) |
-15.710 |
9.812 |
-1.601 |
0.1100 |
Hurst exponent (of daily return price)
| 12-day | 24-day | 48-day | 96-day |
| 0.450 |
0.349 |
0.562 |
0.637 |

FSCSX
Percentile values of daily loss(gain) in per cent
| 0.5 | 1 | 5 | 10 | 25 | 50 | 75 | 90 | 95 | 99 | 99.5 |
| -0.05 |
-0.04 |
-0.02 |
-0.02 |
-0.01 |
0.00 |
0.01 |
0.02 |
0.04 |
0.05 |
0.37 |
Daily log-return distribution fitting results
| Distribution | Location, a | Scale, b |
| Laplace |
-0.129 |
0.225 |
Linear regression results [Model: y=log(percentile of log-return), x=|log-return|]
| Variable | Coef(b) | s.e.(b) | t-value | P-value |
| Constant |
-0.817 |
0.094 |
-8.719 |
0.0000 |
|log-return| |
-91.905 |
6.437 |
-14.278 |
0.0000 |
I(right-tail) |
0.132 |
0.127 |
1.045 |
0.2967 |
|log-return|*I(right-tail) |
3.512 |
8.599 |
0.408 |
0.6832 |
Hurst exponent (of daily return price)
| 12-day | 24-day | 48-day | 96-day |
| 0.539 |
0.432 |
0.563 |
0.637 |

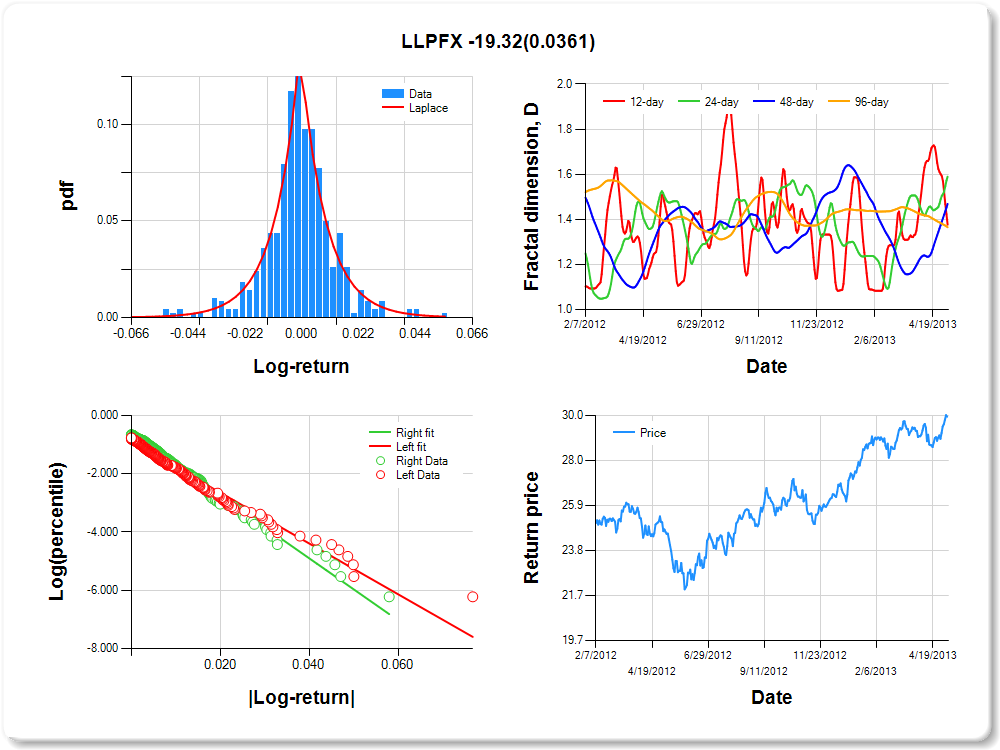
LLPFX
Percentile values of daily loss(gain) in per cent
| 0.5 | 1 | 5 | 10 | 25 | 50 | 75 | 90 | 95 | 99 | 99.5 |
| -0.05 |
-0.05 |
-0.02 |
-0.01 |
-0.01 |
0.00 |
0.01 |
0.02 |
0.03 |
0.05 |
2.23 |
Daily log-return distribution fitting results
| Distribution | Location, a | Scale, b |
| Laplace |
0.253 |
0.247 |
Linear regression results [Model: y=log(percentile of log-return), x=|log-return|]
| Variable | Coef(b) | s.e.(b) | t-value | P-value |
| Constant |
-0.886 |
0.090 |
-9.893 |
0.0000 |
|log-return| |
-87.104 |
6.045 |
-14.409 |
0.0000 |
I(right-tail) |
0.272 |
0.128 |
2.118 |
0.0347 |
|log-return|*I(right-tail) |
-19.317 |
9.189 |
-2.102 |
0.0361 |
Hurst exponent (of daily return price)
| 12-day | 24-day | 48-day | 96-day |
| 0.624 |
0.410 |
0.531 |
0.635 |
FCNTX
Percentile values of daily loss(gain) in per cent
| 0.5 | 1 | 5 | 10 | 25 | 50 | 75 | 90 | 95 | 99 | 99.5 |
| -0.05 |
-0.03 |
-0.02 |
-0.01 |
0.00 |
0.00 |
0.01 |
0.02 |
0.03 |
0.04 |
1.44 |
Daily log-return distribution fitting results
| Distribution | Location, a | Scale, b |
| Logistic |
0.223 |
0.164 |
Linear regression results [Model: y=log(percentile of log-return), x=|log-return|]
| Variable | Coef(b) | s.e.(b) | t-value | P-value |
| Constant |
-0.873 |
0.093 |
-9.430 |
0.0000 |
|log-return| |
-107.225 |
7.536 |
-14.228 |
0.0000 |
I(right-tail) |
0.298 |
0.128 |
2.319 |
0.0208 |
|log-return|*I(right-tail) |
-21.567 |
11.097 |
-1.944 |
0.0525 |
Hurst exponent (of daily return price)
| 12-day | 24-day | 48-day | 96-day |
| 0.452 |
0.496 |
0.821 |
0.622 |

FSRBX
Percentile values of daily loss(gain) in per cent
| 0.5 | 1 | 5 | 10 | 25 | 50 | 75 | 90 | 95 | 99 | 99.5 |
| -0.06 |
-0.05 |
-0.03 |
-0.02 |
-0.01 |
0.00 |
0.01 |
0.02 |
0.05 |
0.05 |
1.90 |
Daily log-return distribution fitting results
| Distribution | Location, a | Scale, b |
| Logistic |
0.363 |
0.147 |
Linear regression results [Model: y=log(percentile of log-return), x=|log-return|]
| Variable | Coef(b) | s.e.(b) | t-value | P-value |
| Constant |
-0.919 |
0.089 |
-10.329 |
0.0000 |
|log-return| |
-68.954 |
4.830 |
-14.276 |
0.0000 |
I(right-tail) |
0.246 |
0.125 |
1.974 |
0.0490 |
|log-return|*I(right-tail) |
-14.574 |
7.241 |
-2.013 |
0.0447 |
Hurst exponent (of daily return price)
| 12-day | 24-day | 48-day | 96-day |
| 0.533 |
0.425 |
0.545 |
0.605 |

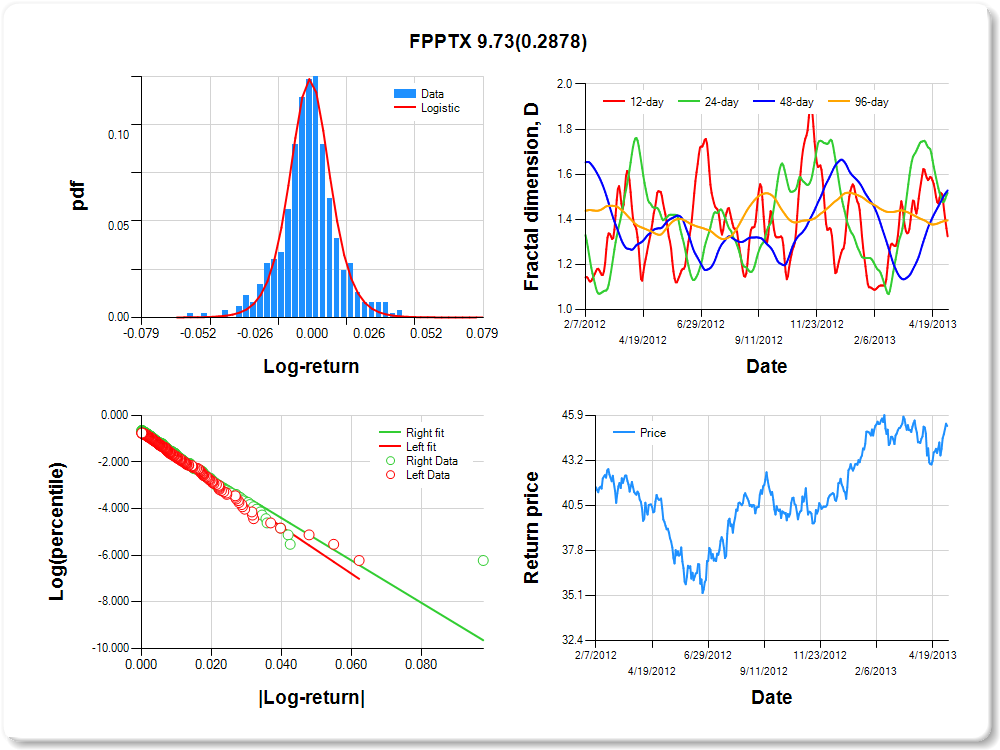
FPPTX
Percentile values of daily loss(gain) in per cent
| 0.5 | 1 | 5 | 10 | 25 | 50 | 75 | 90 | 95 | 99 | 99.5 |
| -0.05 |
-0.04 |
-0.02 |
-0.02 |
-0.01 |
0.00 |
0.01 |
0.02 |
0.04 |
0.04 |
4.83 |
Daily log-return distribution fitting results
| Distribution | Location, a | Scale, b |
| Logistic |
-0.372 |
0.131 |
Linear regression results [Model: y=log(percentile of log-return), x=|log-return|]
| Variable | Coef(b) | s.e.(b) | t-value | P-value |
| Constant |
-0.746 |
0.094 |
-7.897 |
0.0000 |
|log-return| |
-100.419 |
6.868 |
-14.622 |
0.0000 |
I(right-tail) |
-0.016 |
0.127 |
-0.128 |
0.8978 |
|log-return|*I(right-tail) |
9.729 |
9.144 |
1.064 |
0.2878 |
Hurst exponent (of daily return price)
| 12-day | 24-day | 48-day | 96-day |
| 0.675 |
0.483 |
0.472 |
0.604 |
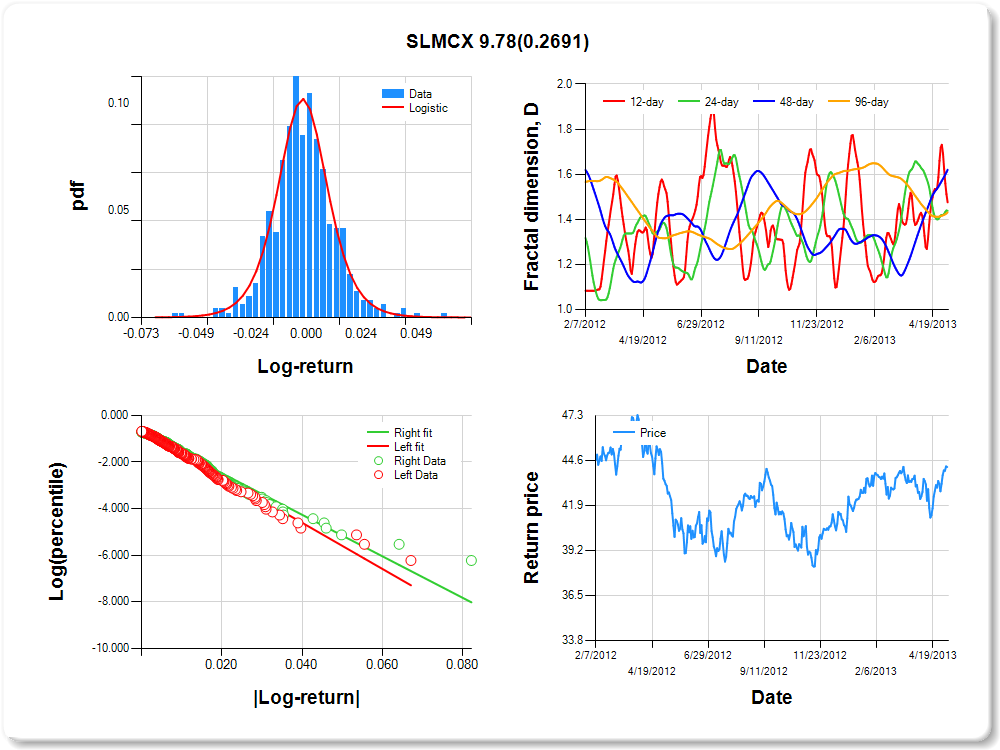
SLMCX
Percentile values of daily loss(gain) in per cent
| 0.5 | 1 | 5 | 10 | 25 | 50 | 75 | 90 | 95 | 99 | 99.5 |
| -0.05 |
-0.04 |
-0.02 |
-0.02 |
-0.01 |
0.00 |
0.01 |
0.02 |
0.04 |
0.05 |
2.19 |
Daily log-return distribution fitting results
| Distribution | Location, a | Scale, b |
| Logistic |
-0.178 |
0.168 |
Linear regression results [Model: y=log(percentile of log-return), x=|log-return|]
| Variable | Coef(b) | s.e.(b) | t-value | P-value |
| Constant |
-0.646 |
0.092 |
-6.994 |
0.0000 |
|log-return| |
-98.671 |
6.506 |
-15.166 |
0.0000 |
I(right-tail) |
-0.049 |
0.131 |
-0.375 |
0.7077 |
|log-return|*I(right-tail) |
9.779 |
8.839 |
1.106 |
0.2691 |
Hurst exponent (of daily return price)
| 12-day | 24-day | 48-day | 96-day |
| 0.525 |
0.562 |
0.380 |
0.569 |
ETHSX
Percentile values of daily loss(gain) in per cent
| 0.5 | 1 | 5 | 10 | 25 | 50 | 75 | 90 | 95 | 99 | 99.5 |
| -0.05 |
-0.03 |
-0.02 |
-0.01 |
-0.01 |
0.00 |
0.01 |
0.01 |
0.03 |
0.03 |
1.37 |
Daily log-return distribution fitting results
| Distribution | Location, a | Scale, b |
| Skew Normal |
-0.716 |
0.158 |
Linear regression results [Model: y=log(percentile of log-return), x=|log-return|]
| Variable | Coef(b) | s.e.(b) | t-value | P-value |
| Constant |
-0.898 |
0.102 |
-8.817 |
0.0000 |
|log-return| |
-116.374 |
8.742 |
-13.313 |
0.0000 |
I(right-tail) |
-0.196 |
0.126 |
-1.561 |
0.1191 |
|log-return|*I(right-tail) |
54.908 |
10.087 |
5.443 |
0.0000 |
Hurst exponent (of daily return price)
| 12-day | 24-day | 48-day | 96-day |
| 0.631 |
0.859 |
0.943 |
0.556 |

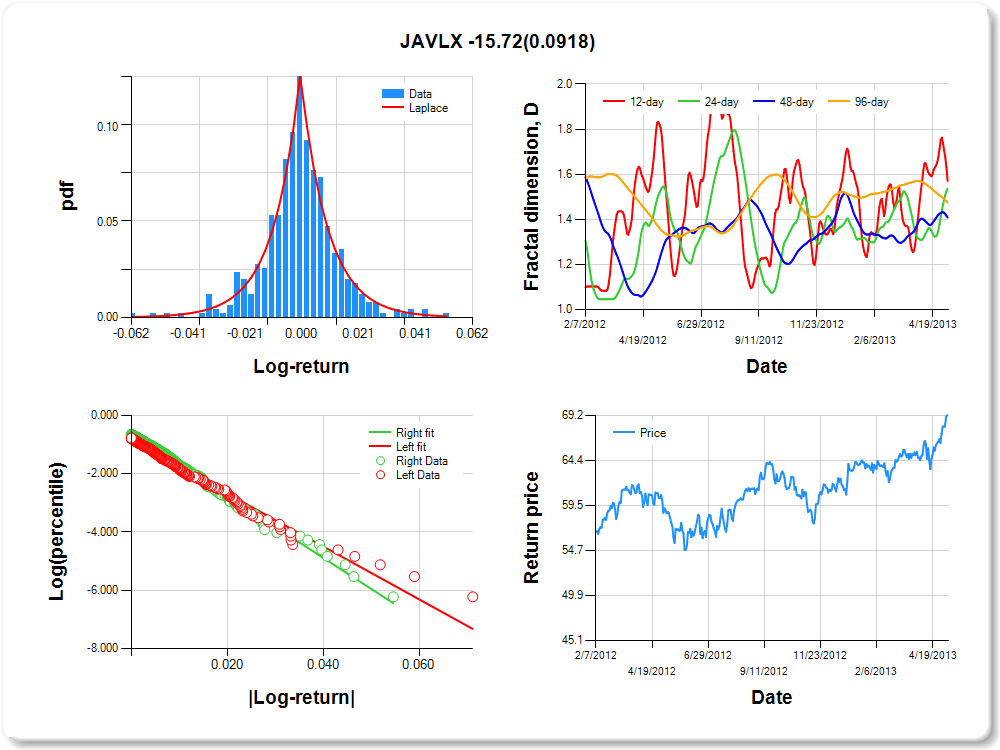
JAVLX
Percentile values of daily loss(gain) in per cent
| 0.5 | 1 | 5 | 10 | 25 | 50 | 75 | 90 | 95 | 99 | 99.5 |
| -0.05 |
-0.04 |
-0.02 |
-0.02 |
-0.01 |
0.00 |
0.01 |
0.02 |
0.04 |
0.04 |
3.60 |
Daily log-return distribution fitting results
| Distribution | Location, a | Scale, b |
| Laplace |
0.243 |
0.267 |
Linear regression results [Model: y=log(percentile of log-return), x=|log-return|]
| Variable | Coef(b) | s.e.(b) | t-value | P-value |
| Constant |
-0.858 |
0.091 |
-9.411 |
0.0000 |
|log-return| |
-90.748 |
6.300 |
-14.405 |
0.0000 |
I(right-tail) |
0.241 |
0.128 |
1.880 |
0.0607 |
|log-return|*I(right-tail) |
-15.724 |
9.308 |
-1.689 |
0.0918 |
Hurst exponent (of daily return price)
| 12-day | 24-day | 48-day | 96-day |
| 0.429 |
0.464 |
0.592 |
0.526 |
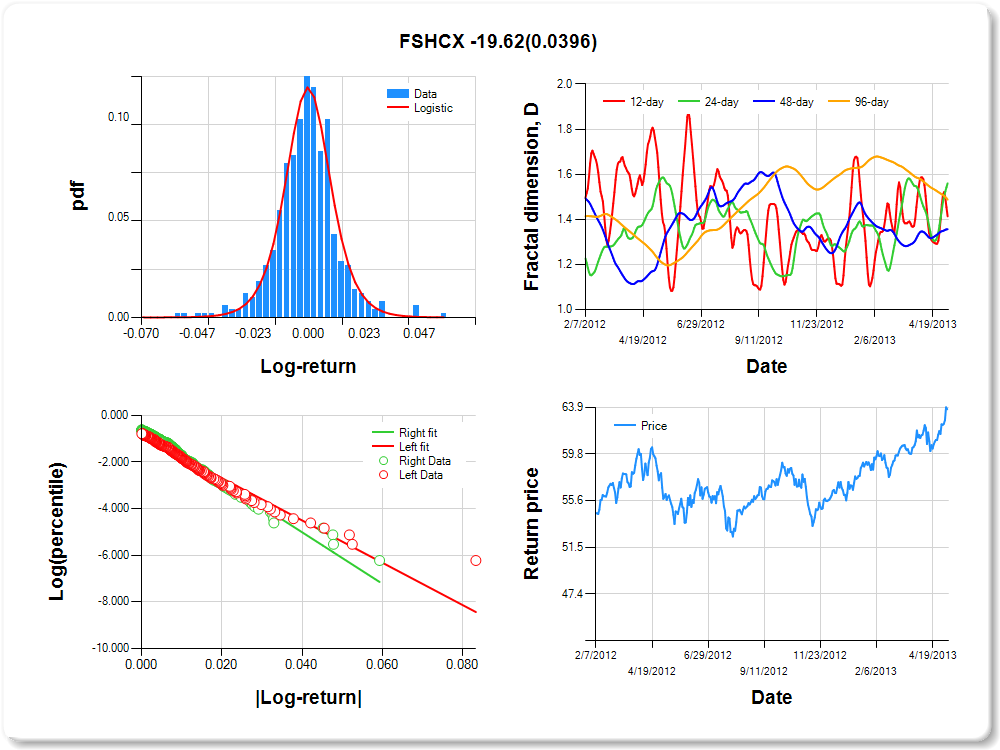
FSHCX
Percentile values of daily loss(gain) in per cent
| 0.5 | 1 | 5 | 10 | 25 | 50 | 75 | 90 | 95 | 99 | 99.5 |
| -0.05 |
-0.04 |
-0.02 |
-0.01 |
-0.01 |
0.00 |
0.01 |
0.02 |
0.03 |
0.05 |
3.00 |
Daily log-return distribution fitting results
| Distribution | Location, a | Scale, b |
| Logistic |
0.315 |
0.149 |
Linear regression results [Model: y=log(percentile of log-return), x=|log-return|]
| Variable | Coef(b) | s.e.(b) | t-value | P-value |
| Constant |
-0.872 |
0.092 |
-9.496 |
0.0000 |
|log-return| |
-90.609 |
6.396 |
-14.168 |
0.0000 |
I(right-tail) |
0.280 |
0.128 |
2.184 |
0.0294 |
|log-return|*I(right-tail) |
-19.618 |
9.510 |
-2.063 |
0.0396 |
Hurst exponent (of daily return price)
| 12-day | 24-day | 48-day | 96-day |
| 0.586 |
0.440 |
0.644 |
0.512 |
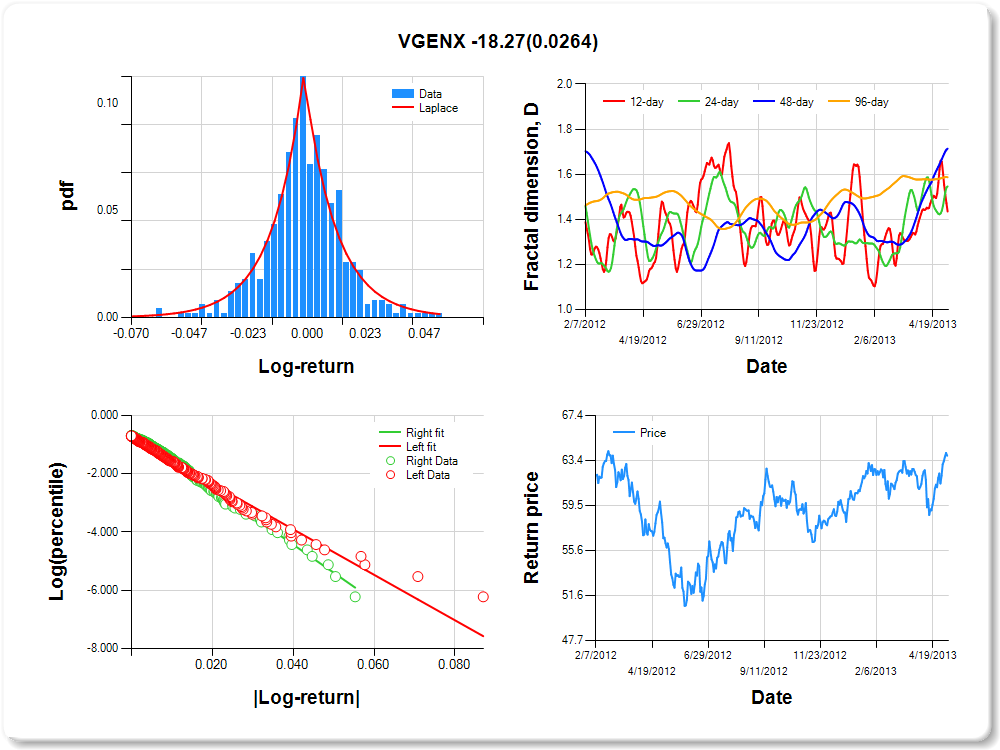
VGENX
Percentile values of daily loss(gain) in per cent
| 0.5 | 1 | 5 | 10 | 25 | 50 | 75 | 90 | 95 | 99 | 99.5 |
| -0.06 |
-0.05 |
-0.03 |
-0.02 |
-0.01 |
0.00 |
0.01 |
0.02 |
0.04 |
0.05 |
1.22 |
Daily log-return distribution fitting results
| Distribution | Location, a | Scale, b |
| Laplace |
0.383 |
0.302 |
Linear regression results [Model: y=log(percentile of log-return), x=|log-return|]
| Variable | Coef(b) | s.e.(b) | t-value | P-value |
| Constant |
-0.781 |
0.088 |
-8.878 |
0.0000 |
|log-return| |
-78.023 |
5.206 |
-14.986 |
0.0000 |
I(right-tail) |
0.210 |
0.131 |
1.604 |
0.1093 |
|log-return|*I(right-tail) |
-18.266 |
8.204 |
-2.227 |
0.0264 |
Hurst exponent (of daily return price)
| 12-day | 24-day | 48-day | 96-day |
| 0.565 |
0.454 |
0.286 |
0.413 |