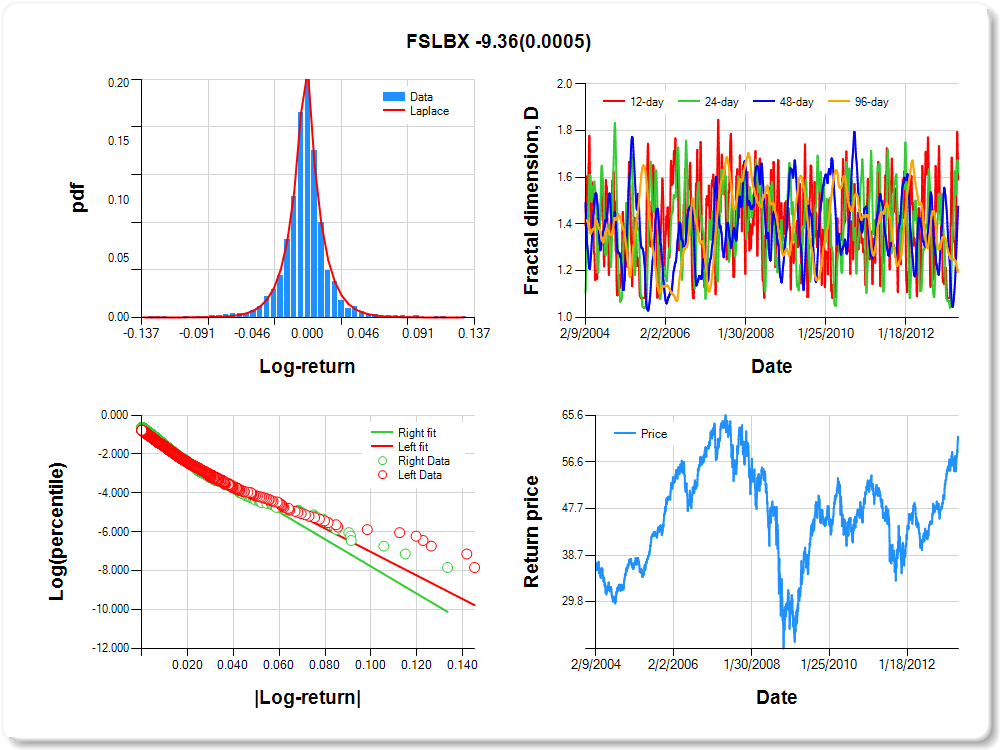
FSLBX
Percentile values of daily loss(gain) in per cent
| 0.5 | 1 | 5 | 10 | 25 | 50 | 75 | 90 | 95 | 99 | 99.5 |
| -0.07 |
-0.06 |
-0.03 |
-0.02 |
-0.01 |
0.00 |
0.01 |
0.03 |
0.06 |
0.08 |
0.58 |
Daily log-return distribution fitting results
| Distribution | Location, a | Scale, b |
| Laplace |
0.082 |
0.141 |
Linear regression results [Model: y=log(percentile of log-return), x=|log-return|]
| Variable | Coef(b) | s.e.(b) | t-value | P-value |
| Constant |
-0.977 |
0.038 |
-25.675 |
0.0000 |
|log-return| |
-60.479 |
1.846 |
-32.770 |
0.0000 |
I(right-tail) |
0.192 |
0.052 |
3.653 |
0.0003 |
|log-return|*I(right-tail) |
-9.359 |
2.698 |
-3.468 |
0.0005 |
Hurst exponent (of daily return price)
| 12-day | 24-day | 48-day | 96-day |
| 0.409 |
0.378 |
0.525 |
0.806 |
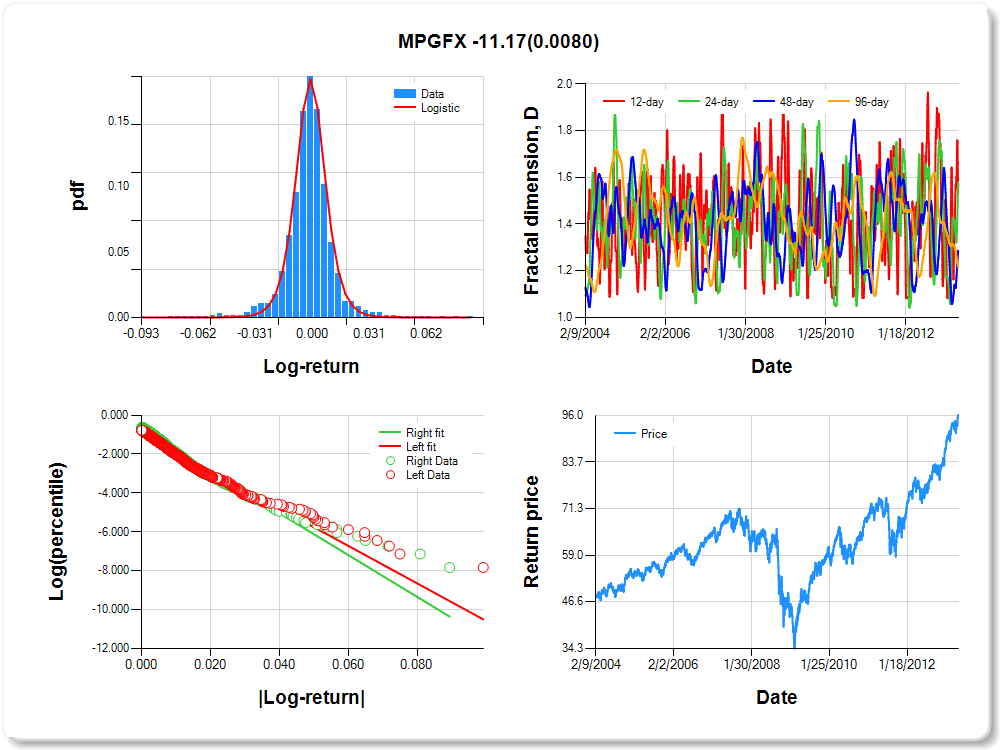
MPGFX
Percentile values of daily loss(gain) in per cent
| 0.5 | 1 | 5 | 10 | 25 | 50 | 75 | 90 | 95 | 99 | 99.5 |
| -0.05 |
-0.04 |
-0.02 |
-0.01 |
-0.01 |
0.00 |
0.01 |
0.02 |
0.04 |
0.05 |
0.39 |
Daily log-return distribution fitting results
| Distribution | Location, a | Scale, b |
| Logistic |
0.104 |
0.094 |
Linear regression results [Model: y=log(percentile of log-return), x=|log-return|]
| Variable | Coef(b) | s.e.(b) | t-value | P-value |
| Constant |
-0.930 |
0.039 |
-23.837 |
0.0000 |
|log-return| |
-96.388 |
2.925 |
-32.949 |
0.0000 |
I(right-tail) |
0.199 |
0.054 |
3.687 |
0.0002 |
|log-return|*I(right-tail) |
-11.166 |
4.210 |
-2.652 |
0.0080 |
Hurst exponent (of daily return price)
| 12-day | 24-day | 48-day | 96-day |
| 0.470 |
0.421 |
0.713 |
0.785 |
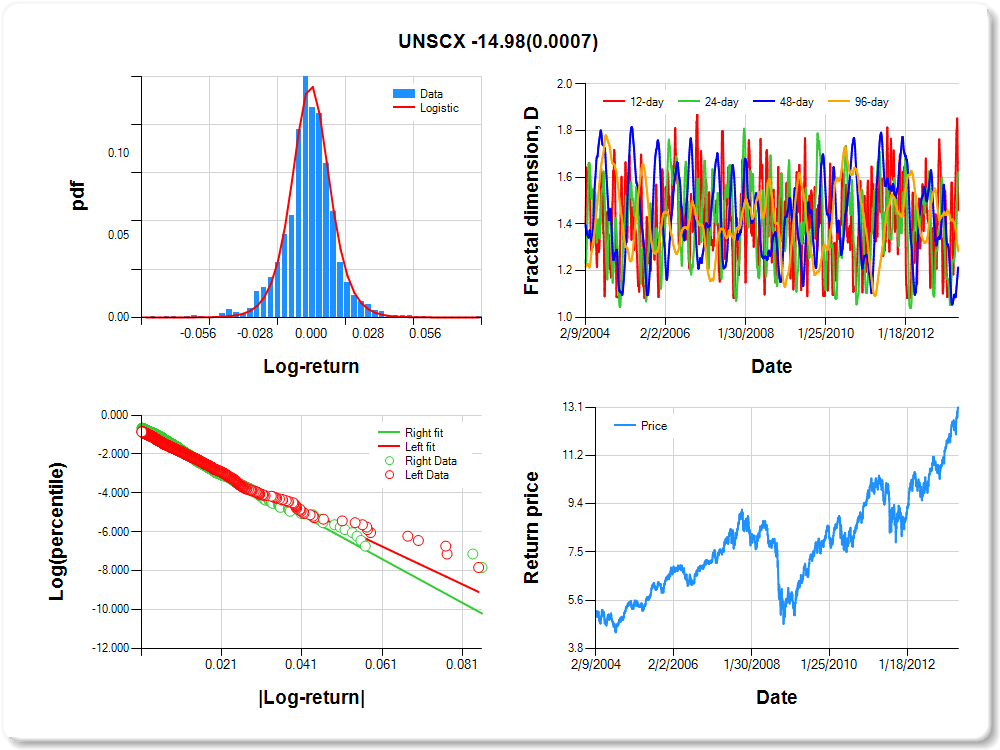
UNSCX
Percentile values of daily loss(gain) in per cent
| 0.5 | 1 | 5 | 10 | 25 | 50 | 75 | 90 | 95 | 99 | 99.5 |
| -0.04 |
-0.04 |
-0.02 |
-0.01 |
-0.01 |
0.00 |
0.01 |
0.02 |
0.04 |
0.04 |
0.71 |
Daily log-return distribution fitting results
| Distribution | Location, a | Scale, b |
| Logistic |
0.013 |
0.121 |
Linear regression results [Model: y=log(percentile of log-return), x=|log-return|]
| Variable | Coef(b) | s.e.(b) | t-value | P-value |
| Constant |
-0.846 |
0.044 |
-19.268 |
0.0000 |
|log-return| |
-97.218 |
3.039 |
-31.988 |
0.0000 |
I(right-tail) |
0.260 |
0.060 |
4.305 |
0.0000 |
|log-return|*I(right-tail) |
-14.978 |
4.411 |
-3.396 |
0.0007 |
Hurst exponent (of daily return price)
| 12-day | 24-day | 48-day | 96-day |
| 0.541 |
0.378 |
0.785 |
0.716 |
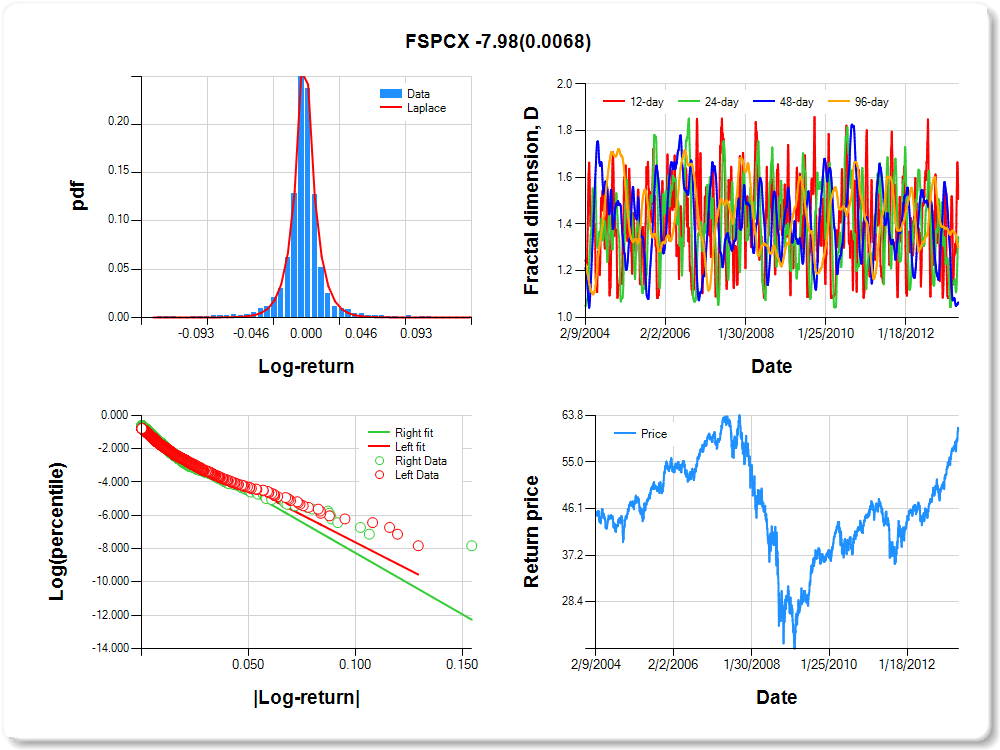
FSPCX
Percentile values of daily loss(gain) in per cent
| 0.5 | 1 | 5 | 10 | 25 | 50 | 75 | 90 | 95 | 99 | 99.5 |
| -0.07 |
-0.06 |
-0.02 |
-0.01 |
-0.01 |
0.00 |
0.01 |
0.02 |
0.05 |
0.07 |
0.51 |
Daily log-return distribution fitting results
| Distribution | Location, a | Scale, b |
| Laplace |
-0.140 |
0.103 |
Linear regression results [Model: y=log(percentile of log-return), x=|log-return|]
| Variable | Coef(b) | s.e.(b) | t-value | P-value |
| Constant |
-1.058 |
0.037 |
-28.232 |
0.0000 |
|log-return| |
-65.697 |
2.038 |
-32.232 |
0.0000 |
I(right-tail) |
0.164 |
0.051 |
3.234 |
0.0012 |
|log-return|*I(right-tail) |
-7.977 |
2.942 |
-2.711 |
0.0068 |
Hurst exponent (of daily return price)
| 12-day | 24-day | 48-day | 96-day |
| 0.493 |
0.655 |
0.935 |
0.699 |
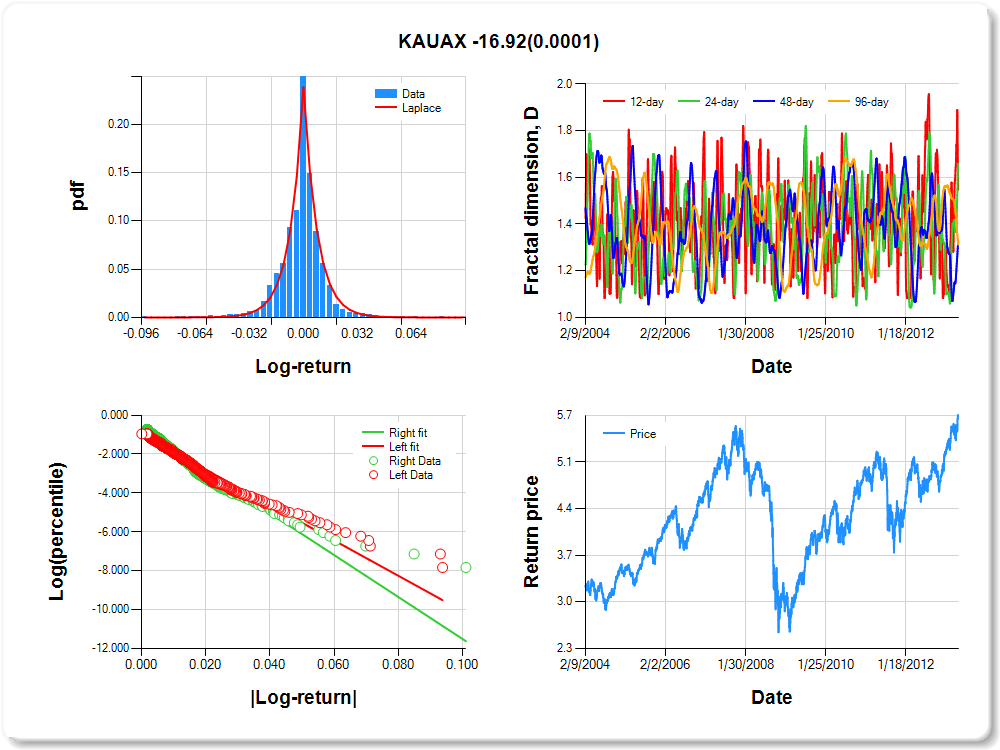
KAUAX
Percentile values of daily loss(gain) in per cent
| 0.5 | 1 | 5 | 10 | 25 | 50 | 75 | 90 | 95 | 99 | 99.5 |
| -0.05 |
-0.04 |
-0.02 |
-0.01 |
-0.01 |
0.00 |
0.01 |
0.02 |
0.04 |
0.05 |
0.22 |
Daily log-return distribution fitting results
| Distribution | Location, a | Scale, b |
| Laplace |
-0.033 |
0.140 |
Linear regression results [Model: y=log(percentile of log-return), x=|log-return|]
| Variable | Coef(b) | s.e.(b) | t-value | P-value |
| Constant |
-0.975 |
0.046 |
-21.314 |
0.0000 |
|log-return| |
-90.849 |
3.018 |
-30.103 |
0.0000 |
I(right-tail) |
0.266 |
0.062 |
4.288 |
0.0000 |
|log-return|*I(right-tail) |
-16.917 |
4.406 |
-3.840 |
0.0001 |
Hurst exponent (of daily return price)
| 12-day | 24-day | 48-day | 96-day |
| 0.453 |
0.340 |
0.675 |
0.688 |
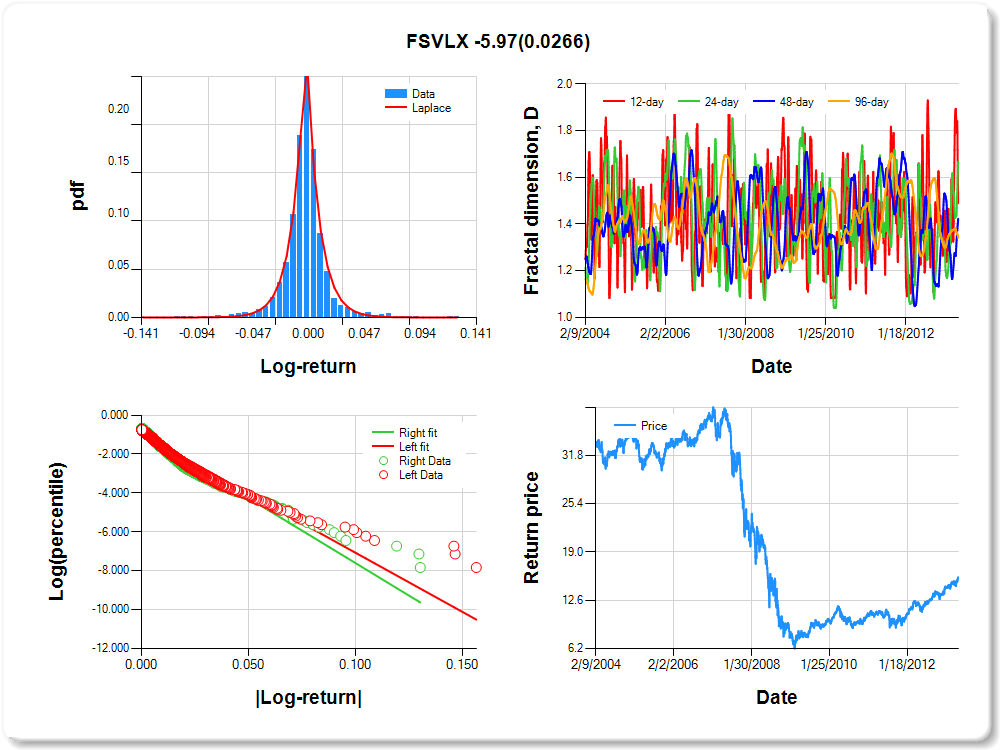
FSVLX
Percentile values of daily loss(gain) in per cent
| 0.5 | 1 | 5 | 10 | 25 | 50 | 75 | 90 | 95 | 99 | 99.5 |
| -0.07 |
-0.06 |
-0.03 |
-0.02 |
-0.01 |
0.00 |
0.01 |
0.03 |
0.06 |
0.07 |
0.16 |
Daily log-return distribution fitting results
| Distribution | Location, a | Scale, b |
| Laplace |
0.159 |
0.128 |
Linear regression results [Model: y=log(percentile of log-return), x=|log-return|]
| Variable | Coef(b) | s.e.(b) | t-value | P-value |
| Constant |
-0.978 |
0.037 |
-26.334 |
0.0000 |
|log-return| |
-60.849 |
1.844 |
-32.991 |
0.0000 |
I(right-tail) |
0.066 |
0.052 |
1.279 |
0.2009 |
|log-return|*I(right-tail) |
-5.965 |
2.689 |
-2.219 |
0.0266 |
Hurst exponent (of daily return price)
| 12-day | 24-day | 48-day | 96-day |
| 0.510 |
0.332 |
0.577 |
0.659 |
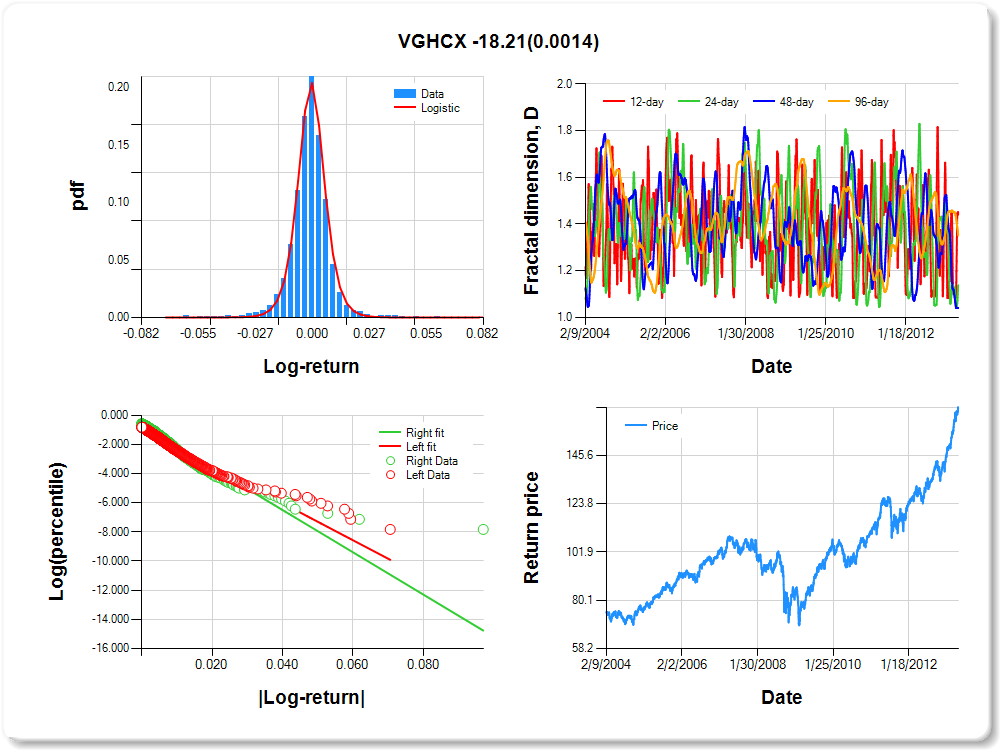
VGHCX
Percentile values of daily loss(gain) in per cent
| 0.5 | 1 | 5 | 10 | 25 | 50 | 75 | 90 | 95 | 99 | 99.5 |
| -0.04 |
-0.03 |
-0.01 |
-0.01 |
0.00 |
0.00 |
0.01 |
0.01 |
0.02 |
0.03 |
0.00 |
Daily log-return distribution fitting results
| Distribution | Location, a | Scale, b |
| Logistic |
-0.248 |
0.084 |
Linear regression results [Model: y=log(percentile of log-return), x=|log-return|]
| Variable | Coef(b) | s.e.(b) | t-value | P-value |
| Constant |
-0.961 |
0.040 |
-23.844 |
0.0000 |
|log-return| |
-126.745 |
3.959 |
-32.017 |
0.0000 |
I(right-tail) |
0.266 |
0.055 |
4.878 |
0.0000 |
|log-return|*I(right-tail) |
-18.210 |
5.694 |
-3.198 |
0.0014 |
Hurst exponent (of daily return price)
| 12-day | 24-day | 48-day | 96-day |
| 0.559 |
0.862 |
0.959 |
0.649 |
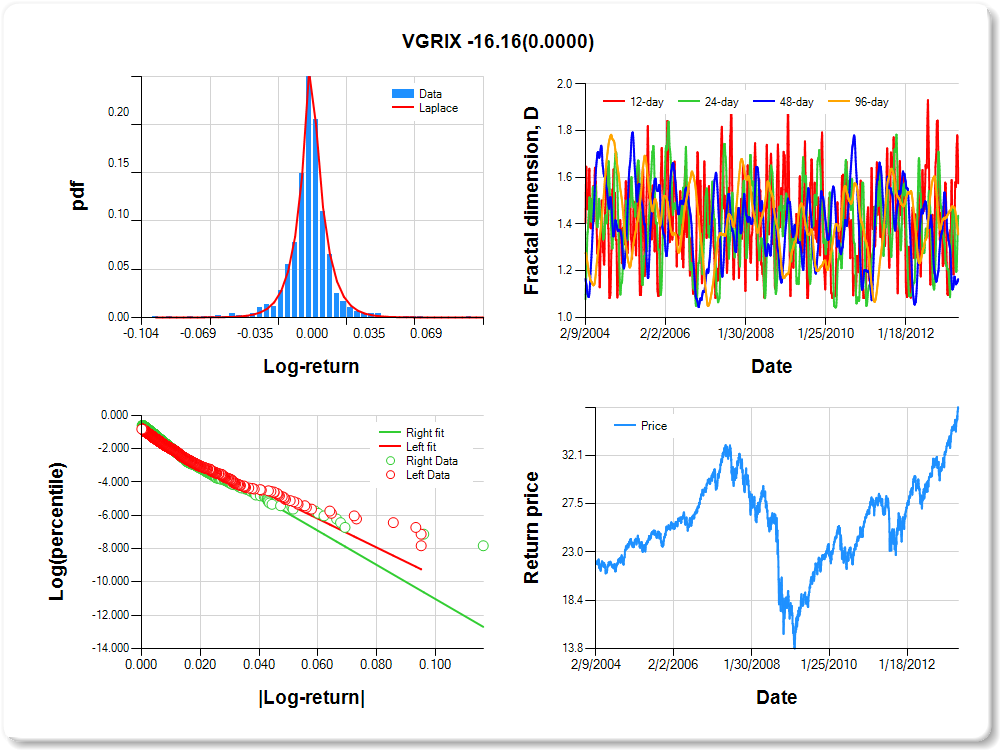
VGRIX
Percentile values of daily loss(gain) in per cent
| 0.5 | 1 | 5 | 10 | 25 | 50 | 75 | 90 | 95 | 99 | 99.5 |
| -0.05 |
-0.04 |
-0.02 |
-0.01 |
0.00 |
0.00 |
0.01 |
0.02 |
0.04 |
0.04 |
0.78 |
Daily log-return distribution fitting results
| Distribution | Location, a | Scale, b |
| Laplace |
-0.152 |
0.123 |
Linear regression results [Model: y=log(percentile of log-return), x=|log-return|]
| Variable | Coef(b) | s.e.(b) | t-value | P-value |
| Constant |
-1.038 |
0.039 |
-26.526 |
0.0000 |
|log-return| |
-86.246 |
2.708 |
-31.853 |
0.0000 |
I(right-tail) |
0.248 |
0.053 |
4.674 |
0.0000 |
|log-return|*I(right-tail) |
-16.158 |
3.972 |
-4.068 |
0.0000 |
Hurst exponent (of daily return price)
| 12-day | 24-day | 48-day | 96-day |
| 0.425 |
0.564 |
0.836 |
0.644 |
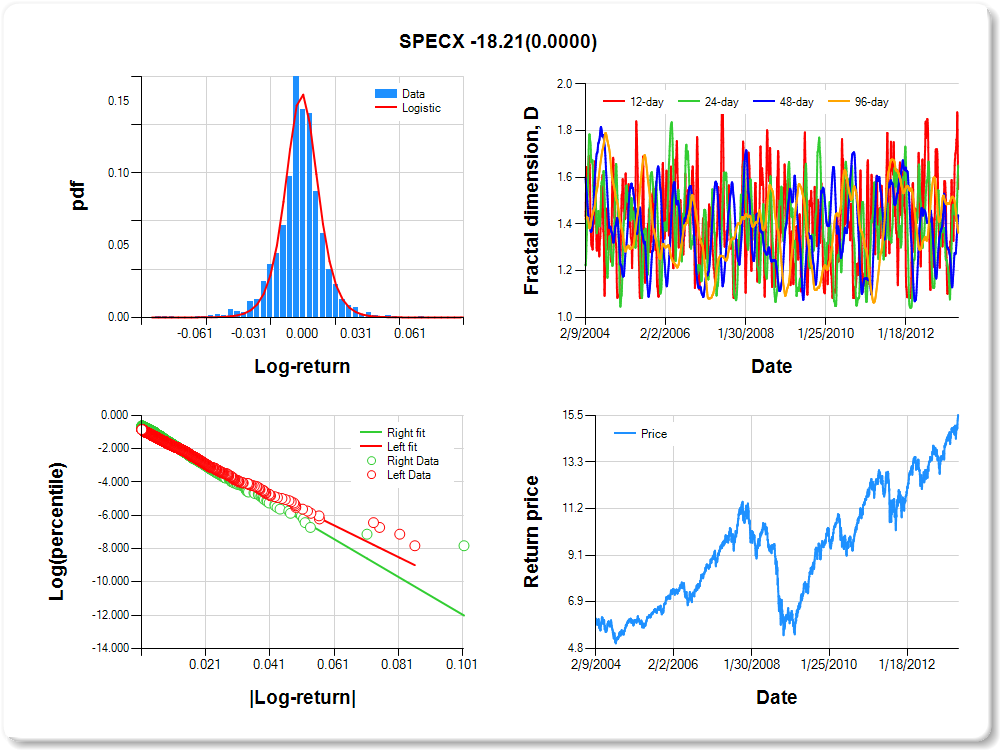
SPECX
Percentile values of daily loss(gain) in per cent
| 0.5 | 1 | 5 | 10 | 25 | 50 | 75 | 90 | 95 | 99 | 99.5 |
| -0.05 |
-0.04 |
-0.02 |
-0.02 |
-0.01 |
0.00 |
0.01 |
0.02 |
0.03 |
0.04 |
0.86 |
Daily log-return distribution fitting results
| Distribution | Location, a | Scale, b |
| Logistic |
-0.119 |
0.111 |
Linear regression results [Model: y=log(percentile of log-return), x=|log-return|]
| Variable | Coef(b) | s.e.(b) | t-value | P-value |
| Constant |
-0.857 |
0.044 |
-19.550 |
0.0000 |
|log-return| |
-94.849 |
2.966 |
-31.980 |
0.0000 |
I(right-tail) |
0.279 |
0.060 |
4.660 |
0.0000 |
|log-return|*I(right-tail) |
-18.209 |
4.351 |
-4.185 |
0.0000 |
Hurst exponent (of daily return price)
| 12-day | 24-day | 48-day | 96-day |
| 0.450 |
0.349 |
0.562 |
0.637 |
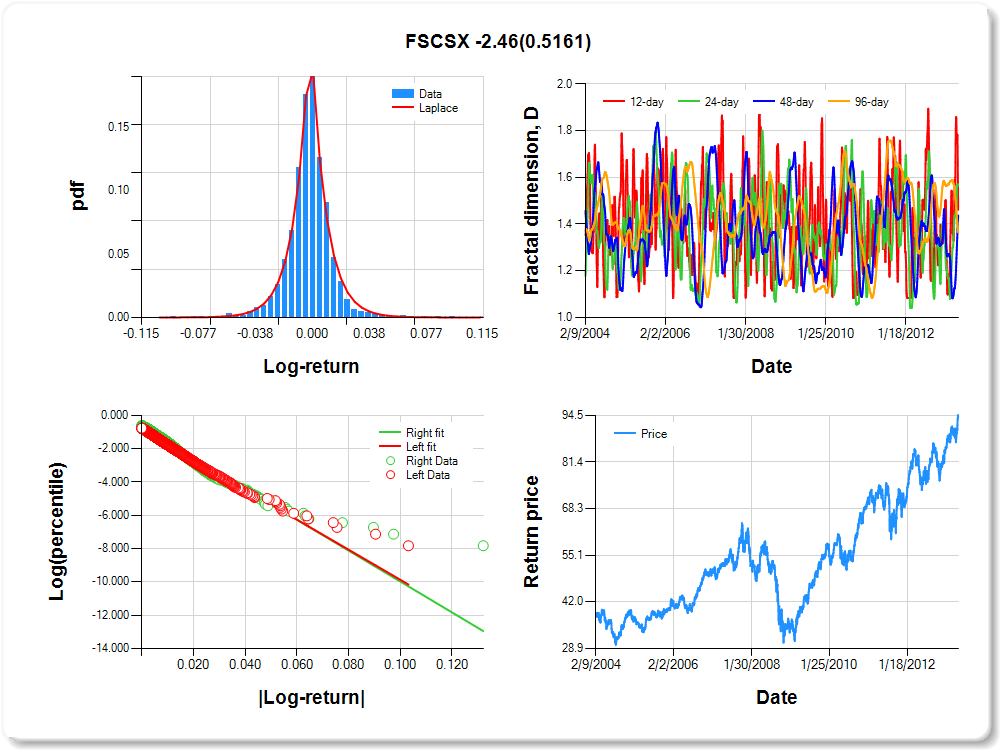
FSCSX
Percentile values of daily loss(gain) in per cent
| 0.5 | 1 | 5 | 10 | 25 | 50 | 75 | 90 | 95 | 99 | 99.5 |
| -0.05 |
-0.04 |
-0.02 |
-0.02 |
-0.01 |
0.00 |
0.01 |
0.02 |
0.04 |
0.05 |
1.05 |
Daily log-return distribution fitting results
| Distribution | Location, a | Scale, b |
| Laplace |
-0.198 |
0.149 |
Linear regression results [Model: y=log(percentile of log-return), x=|log-return|]
| Variable | Coef(b) | s.e.(b) | t-value | P-value |
| Constant |
-0.844 |
0.041 |
-20.801 |
0.0000 |
|log-return| |
-90.237 |
2.712 |
-33.270 |
0.0000 |
I(right-tail) |
0.142 |
0.056 |
2.548 |
0.0109 |
|log-return|*I(right-tail) |
-2.456 |
3.781 |
-0.650 |
0.5161 |
Hurst exponent (of daily return price)
| 12-day | 24-day | 48-day | 96-day |
| 0.539 |
0.432 |
0.563 |
0.637 |
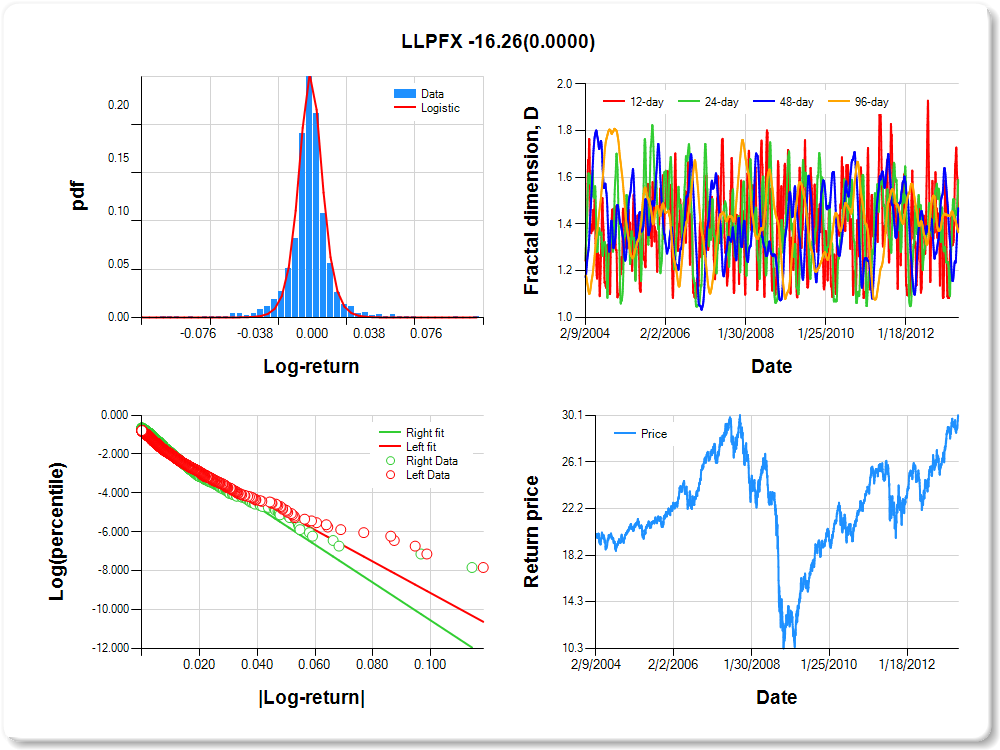
LLPFX
Percentile values of daily loss(gain) in per cent
| 0.5 | 1 | 5 | 10 | 25 | 50 | 75 | 90 | 95 | 99 | 99.5 |
| -0.05 |
-0.05 |
-0.02 |
-0.01 |
0.00 |
0.00 |
0.01 |
0.02 |
0.04 |
0.05 |
0.39 |
Daily log-return distribution fitting results
| Distribution | Location, a | Scale, b |
| Logistic |
0.042 |
0.075 |
Linear regression results [Model: y=log(percentile of log-return), x=|log-return|]
| Variable | Coef(b) | s.e.(b) | t-value | P-value |
| Constant |
-1.017 |
0.038 |
-26.852 |
0.0000 |
|log-return| |
-81.112 |
2.498 |
-32.465 |
0.0000 |
I(right-tail) |
0.223 |
0.053 |
4.201 |
0.0000 |
|log-return|*I(right-tail) |
-16.263 |
3.758 |
-4.328 |
0.0000 |
Hurst exponent (of daily return price)
| 12-day | 24-day | 48-day | 96-day |
| 0.624 |
0.410 |
0.531 |
0.635 |
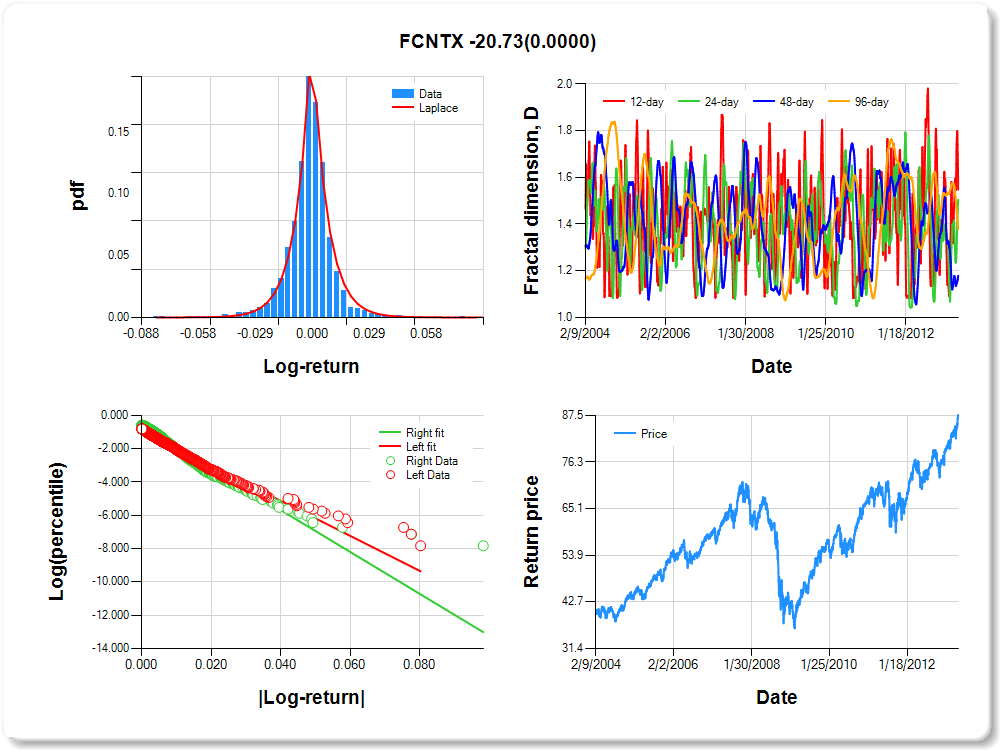
FCNTX
Percentile values of daily loss(gain) in per cent
| 0.5 | 1 | 5 | 10 | 25 | 50 | 75 | 90 | 95 | 99 | 99.5 |
| -0.04 |
-0.03 |
-0.02 |
-0.01 |
0.00 |
0.00 |
0.01 |
0.02 |
0.03 |
0.04 |
0.63 |
Daily log-return distribution fitting results
| Distribution | Location, a | Scale, b |
| Laplace |
-0.146 |
0.148 |
Linear regression results [Model: y=log(percentile of log-return), x=|log-return|]
| Variable | Coef(b) | s.e.(b) | t-value | P-value |
| Constant |
-0.935 |
0.041 |
-23.050 |
0.0000 |
|log-return| |
-104.857 |
3.233 |
-32.435 |
0.0000 |
I(right-tail) |
0.279 |
0.055 |
5.046 |
0.0000 |
|log-return|*I(right-tail) |
-20.726 |
4.768 |
-4.347 |
0.0000 |
Hurst exponent (of daily return price)
| 12-day | 24-day | 48-day | 96-day |
| 0.452 |
0.496 |
0.821 |
0.622 |
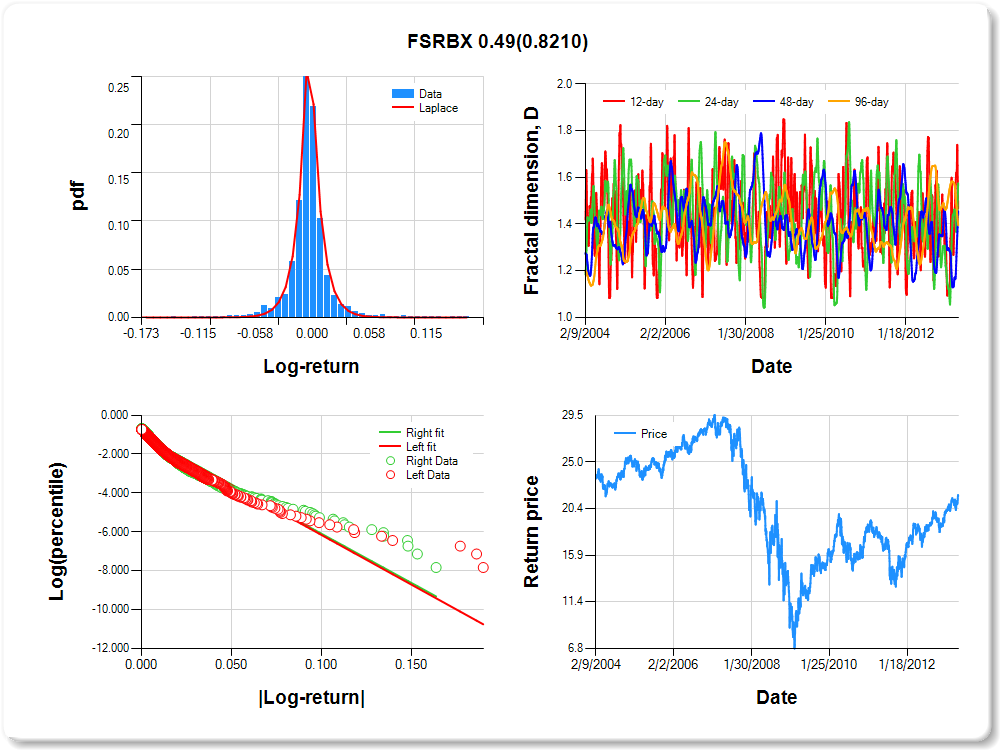
FSRBX
Percentile values of daily loss(gain) in per cent
| 0.5 | 1 | 5 | 10 | 25 | 50 | 75 | 90 | 95 | 99 | 99.5 |
| -0.08 |
-0.06 |
-0.03 |
-0.02 |
-0.01 |
0.00 |
0.01 |
0.03 |
0.08 |
0.10 |
1.08 |
Daily log-return distribution fitting results
| Distribution | Location, a | Scale, b |
| Laplace |
0.130 |
0.098 |
Linear regression results [Model: y=log(percentile of log-return), x=|log-return|]
| Variable | Coef(b) | s.e.(b) | t-value | P-value |
| Constant |
-1.040 |
0.036 |
-29.292 |
0.0000 |
|log-return| |
-51.179 |
1.558 |
-32.843 |
0.0000 |
I(right-tail) |
0.014 |
0.050 |
0.285 |
0.7755 |
|log-return|*I(right-tail) |
0.493 |
2.178 |
0.226 |
0.8210 |
Hurst exponent (of daily return price)
| 12-day | 24-day | 48-day | 96-day |
| 0.533 |
0.425 |
0.545 |
0.605 |
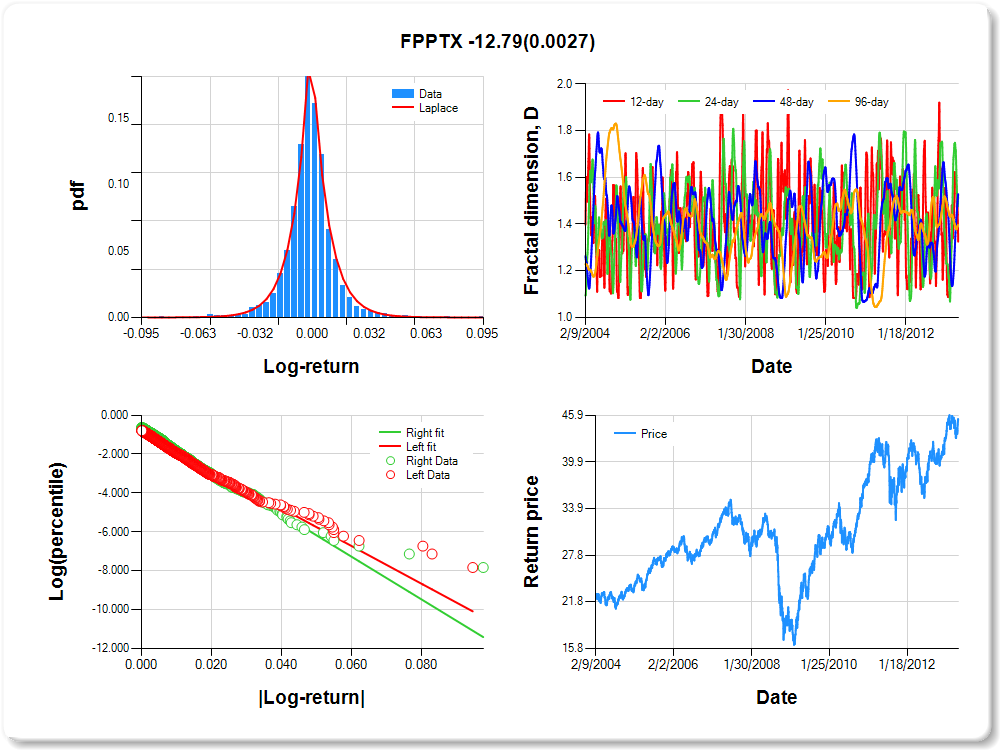
FPPTX
Percentile values of daily loss(gain) in per cent
| 0.5 | 1 | 5 | 10 | 25 | 50 | 75 | 90 | 95 | 99 | 99.5 |
| -0.05 |
-0.04 |
-0.02 |
-0.01 |
-0.01 |
0.00 |
0.01 |
0.02 |
0.04 |
0.04 |
0.70 |
Daily log-return distribution fitting results
| Distribution | Location, a | Scale, b |
| Laplace |
-0.009 |
0.158 |
Linear regression results [Model: y=log(percentile of log-return), x=|log-return|]
| Variable | Coef(b) | s.e.(b) | t-value | P-value |
| Constant |
-0.891 |
0.040 |
-22.064 |
0.0000 |
|log-return| |
-96.866 |
2.950 |
-32.835 |
0.0000 |
I(right-tail) |
0.221 |
0.056 |
3.945 |
0.0001 |
|log-return|*I(right-tail) |
-12.794 |
4.267 |
-2.999 |
0.0027 |
Hurst exponent (of daily return price)
| 12-day | 24-day | 48-day | 96-day |
| 0.675 |
0.483 |
0.472 |
0.604 |
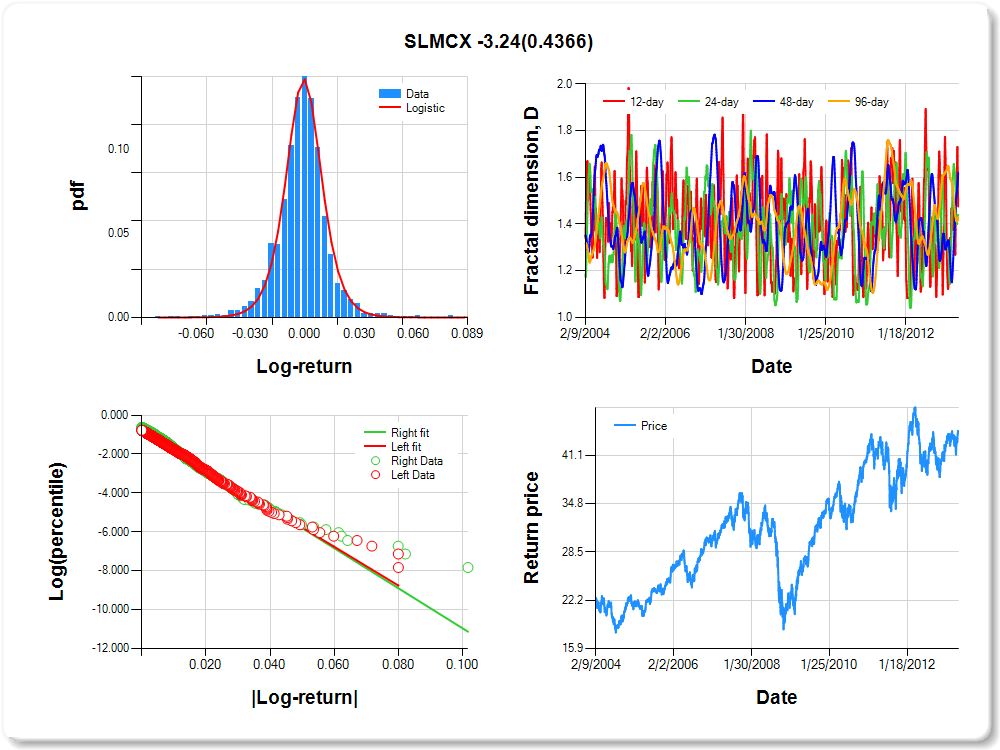
SLMCX
Percentile values of daily loss(gain) in per cent
| 0.5 | 1 | 5 | 10 | 25 | 50 | 75 | 90 | 95 | 99 | 99.5 |
| -0.04 |
-0.04 |
-0.02 |
-0.02 |
-0.01 |
0.00 |
0.01 |
0.02 |
0.04 |
0.05 |
0.92 |
Daily log-return distribution fitting results
| Distribution | Location, a | Scale, b |
| Logistic |
-0.181 |
0.121 |
Linear regression results [Model: y=log(percentile of log-return), x=|log-return|]
| Variable | Coef(b) | s.e.(b) | t-value | P-value |
| Constant |
-0.760 |
0.042 |
-17.990 |
0.0000 |
|log-return| |
-99.758 |
2.984 |
-33.426 |
0.0000 |
I(right-tail) |
0.122 |
0.058 |
2.112 |
0.0348 |
|log-return|*I(right-tail) |
-3.238 |
4.162 |
-0.778 |
0.4366 |
Hurst exponent (of daily return price)
| 12-day | 24-day | 48-day | 96-day |
| 0.525 |
0.562 |
0.380 |
0.569 |
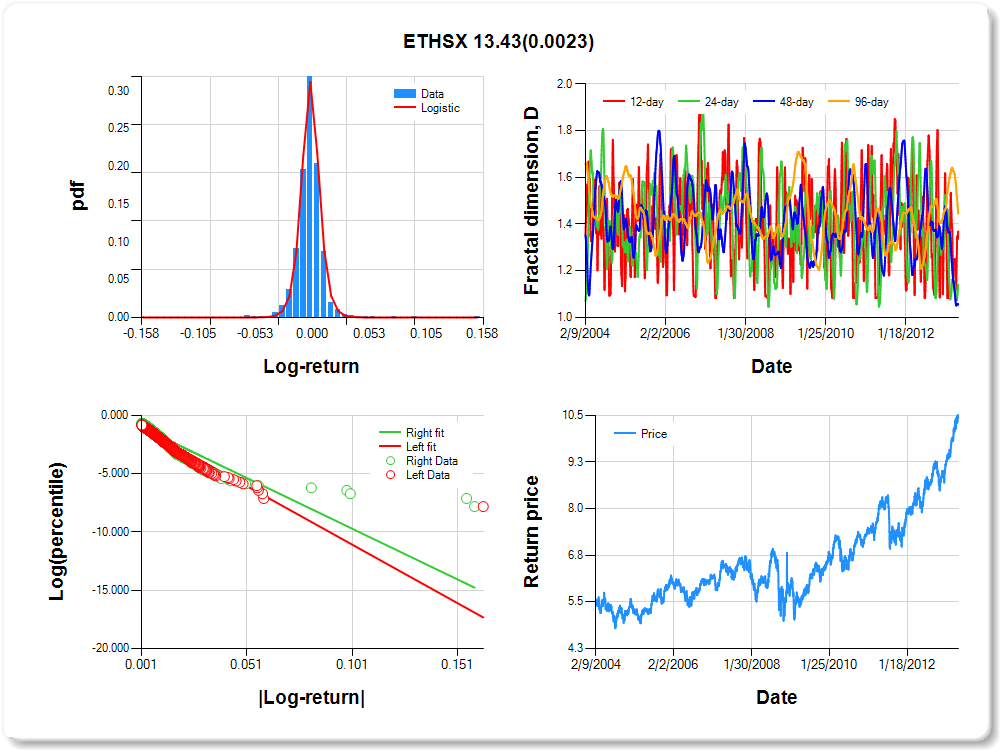
ETHSX
Percentile values of daily loss(gain) in per cent
| 0.5 | 1 | 5 | 10 | 25 | 50 | 75 | 90 | 95 | 99 | 99.5 |
| -0.04 |
-0.03 |
-0.02 |
-0.01 |
-0.01 |
0.00 |
0.01 |
0.02 |
0.03 |
0.04 |
1.11 |
Daily log-return distribution fitting results
| Distribution | Location, a | Scale, b |
| Logistic |
0.035 |
0.055 |
Linear regression results [Model: y=log(percentile of log-return), x=|log-return|]
| Variable | Coef(b) | s.e.(b) | t-value | P-value |
| Constant |
-0.976 |
0.042 |
-23.354 |
0.0000 |
|log-return| |
-100.242 |
3.322 |
-30.179 |
0.0000 |
I(right-tail) |
0.010 |
0.056 |
0.171 |
0.8639 |
|log-return|*I(right-tail) |
13.425 |
4.390 |
3.058 |
0.0023 |
Hurst exponent (of daily return price)
| 12-day | 24-day | 48-day | 96-day |
| 0.631 |
0.859 |
0.943 |
0.556 |
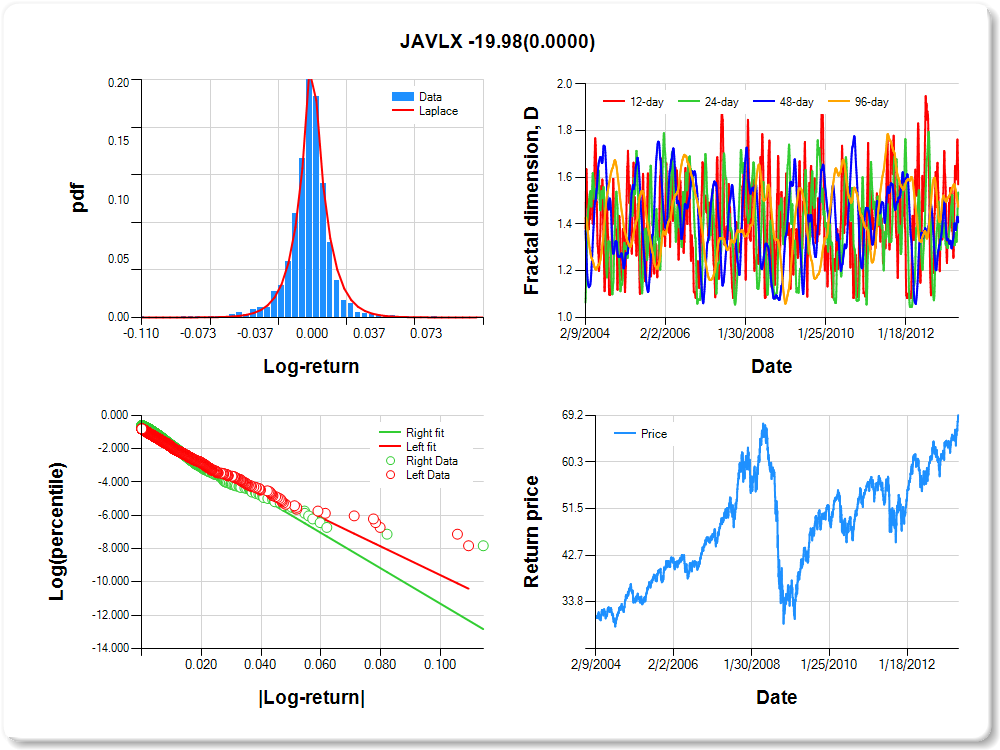
JAVLX
Percentile values of daily loss(gain) in per cent
| 0.5 | 1 | 5 | 10 | 25 | 50 | 75 | 90 | 95 | 99 | 99.5 |
| -0.05 |
-0.04 |
-0.02 |
-0.01 |
-0.01 |
0.00 |
0.01 |
0.02 |
0.04 |
0.05 |
0.83 |
Daily log-return distribution fitting results
| Distribution | Location, a | Scale, b |
| Laplace |
-0.009 |
0.136 |
Linear regression results [Model: y=log(percentile of log-return), x=|log-return|]
| Variable | Coef(b) | s.e.(b) | t-value | P-value |
| Constant |
-0.957 |
0.040 |
-23.975 |
0.0000 |
|log-return| |
-86.246 |
2.665 |
-32.366 |
0.0000 |
I(right-tail) |
0.286 |
0.055 |
5.209 |
0.0000 |
|log-return|*I(right-tail) |
-19.985 |
3.993 |
-5.005 |
0.0000 |
Hurst exponent (of daily return price)
| 12-day | 24-day | 48-day | 96-day |
| 0.429 |
0.464 |
0.592 |
0.526 |
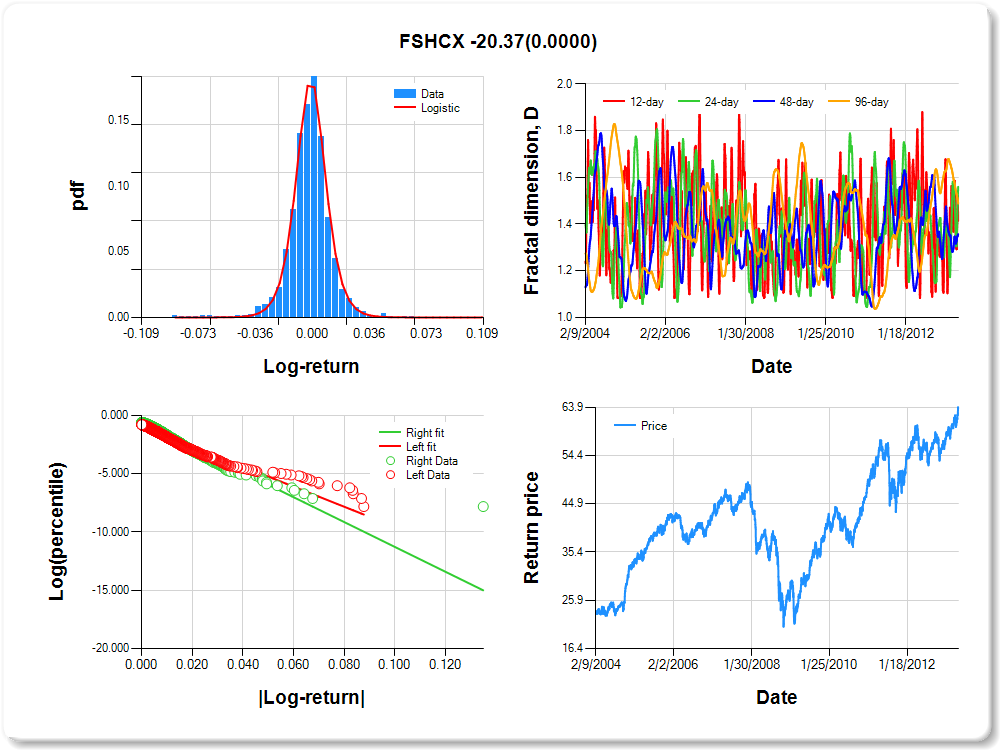
FSHCX
Percentile values of daily loss(gain) in per cent
| 0.5 | 1 | 5 | 10 | 25 | 50 | 75 | 90 | 95 | 99 | 99.5 |
| -0.06 |
-0.04 |
-0.02 |
-0.01 |
-0.01 |
0.00 |
0.01 |
0.02 |
0.03 |
0.05 |
0.55 |
Daily log-return distribution fitting results
| Distribution | Location, a | Scale, b |
| Logistic |
-0.345 |
0.095 |
Linear regression results [Model: y=log(percentile of log-return), x=|log-return|]
| Variable | Coef(b) | s.e.(b) | t-value | P-value |
| Constant |
-0.945 |
0.040 |
-23.568 |
0.0000 |
|log-return| |
-86.099 |
2.679 |
-32.140 |
0.0000 |
I(right-tail) |
0.321 |
0.056 |
5.730 |
0.0000 |
|log-return|*I(right-tail) |
-20.374 |
4.030 |
-5.055 |
0.0000 |
Hurst exponent (of daily return price)
| 12-day | 24-day | 48-day | 96-day |
| 0.586 |
0.440 |
0.644 |
0.512 |
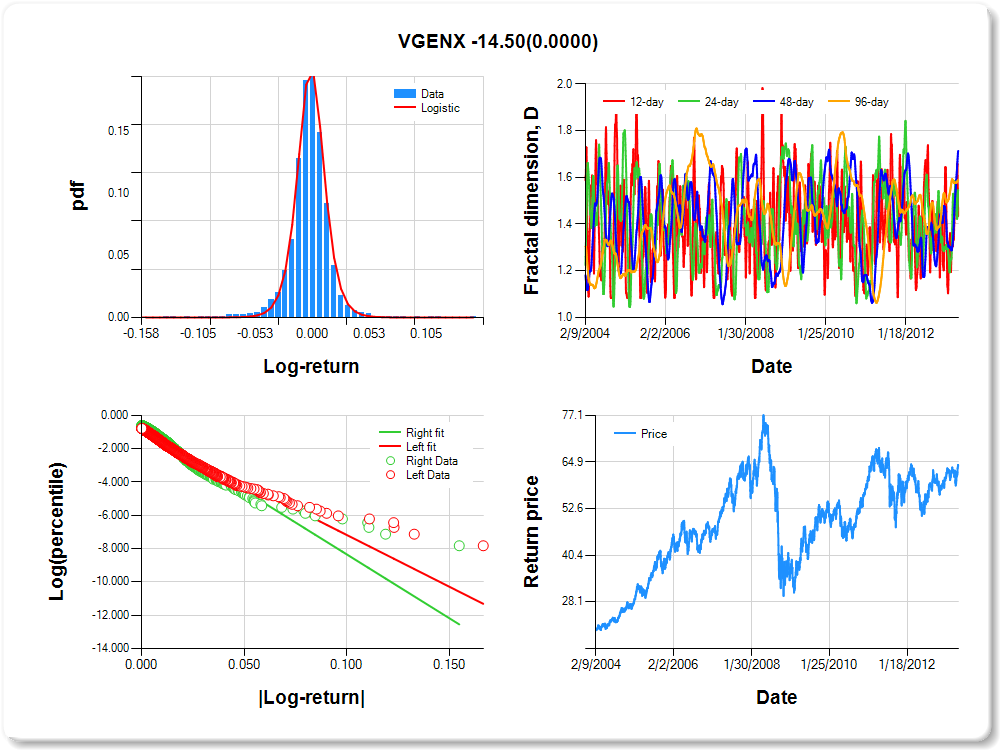
VGENX
Percentile values of daily loss(gain) in per cent
| 0.5 | 1 | 5 | 10 | 25 | 50 | 75 | 90 | 95 | 99 | 99.5 |
| -0.07 |
-0.06 |
-0.03 |
-0.02 |
-0.01 |
0.00 |
0.01 |
0.02 |
0.05 |
0.06 |
0.84 |
Daily log-return distribution fitting results
| Distribution | Location, a | Scale, b |
| Logistic |
0.081 |
0.085 |
Linear regression results [Model: y=log(percentile of log-return), x=|log-return|]
| Variable | Coef(b) | s.e.(b) | t-value | P-value |
| Constant |
-0.974 |
0.039 |
-25.054 |
0.0000 |
|log-return| |
-62.086 |
1.918 |
-32.375 |
0.0000 |
I(right-tail) |
0.286 |
0.054 |
5.256 |
0.0000 |
|log-return|*I(right-tail) |
-14.503 |
2.908 |
-4.988 |
0.0000 |
Hurst exponent (of daily return price)
| 12-day | 24-day | 48-day | 96-day |
| 0.565 |
0.454 |
0.286 |
0.413 |