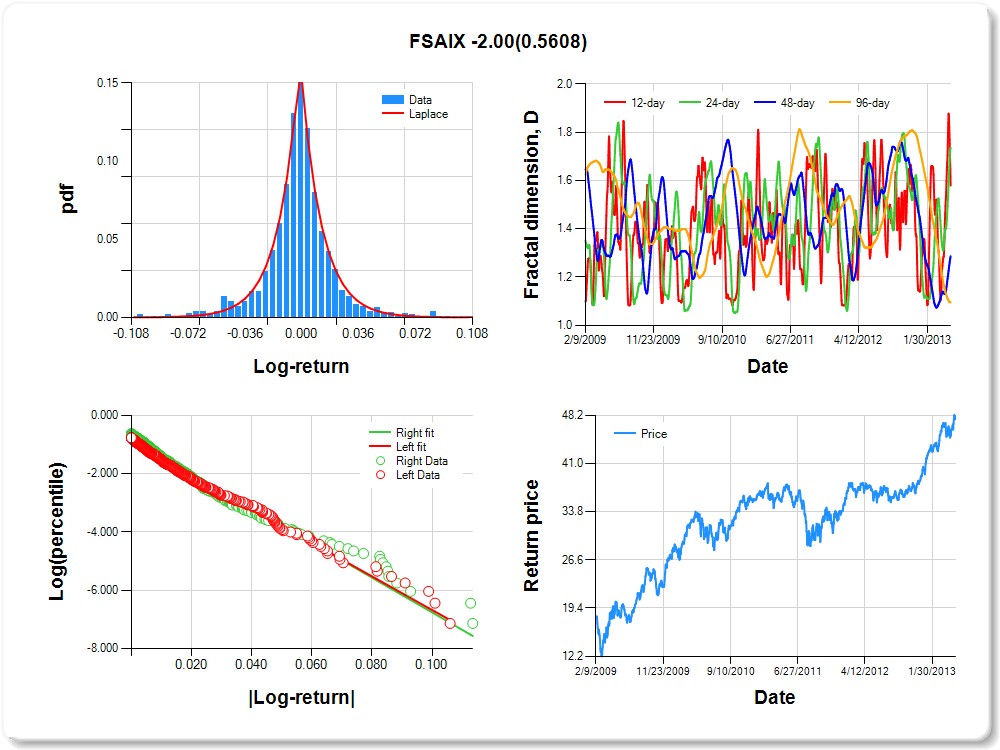
FSAIX
Percentile values of daily loss(gain) in per cent
| 0.5 | 1 | 5 | 10 | 25 | 50 | 75 | 90 | 95 | 99 | 99.5 |
| -0.08 |
-0.06 |
-0.04 |
-0.02 |
-0.01 |
0.00 |
0.01 |
0.03 |
0.07 |
0.09 |
0.00 |
Daily log-return distribution fitting results
| Distribution | Location, a | Scale, b |
| Laplace |
-0.045 |
0.206 |
Linear regression results [Model: y=log(percentile of log-return), x=|log-return|]
| Variable | Coef(b) | s.e.(b) | t-value | P-value |
| Constant |
-0.897 |
0.056 |
-16.108 |
0.0000 |
|log-return| |
-57.719 |
2.460 |
-23.459 |
0.0000 |
I(right-tail) |
0.117 |
0.076 |
1.539 |
0.1242 |
|log-return|*I(right-tail) |
-1.996 |
3.431 |
-0.582 |
0.5608 |
Hurst exponent (of daily return price)
| 12-day | 24-day | 48-day | 96-day |
| 0.421 |
0.263 |
0.714 |
0.905 |
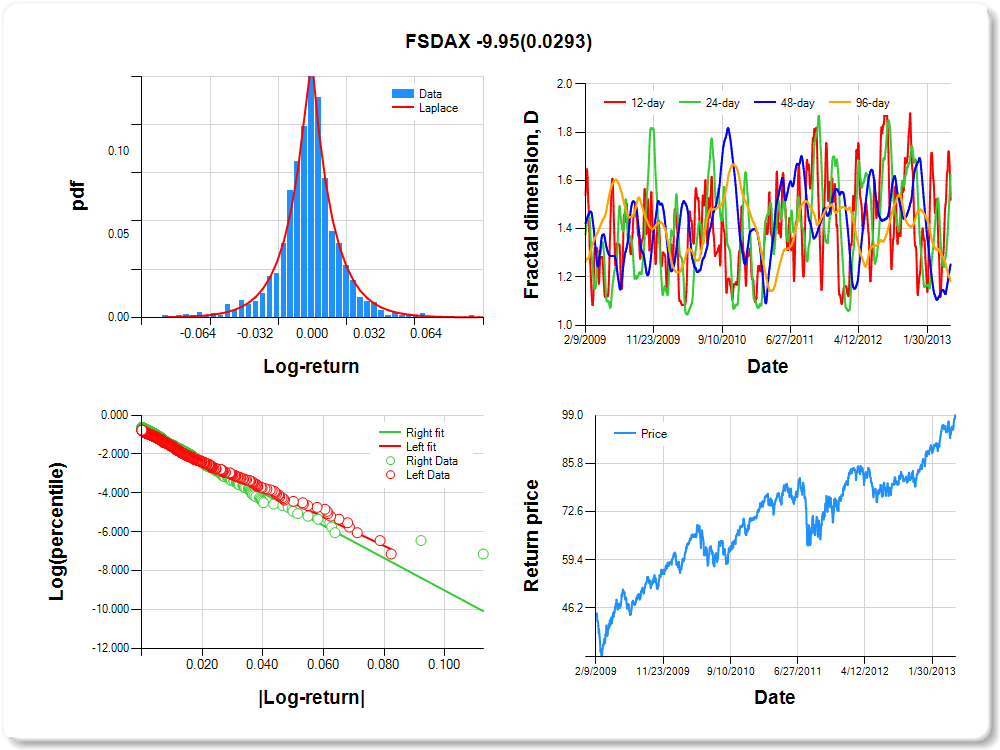
FSDAX
Percentile values of daily loss(gain) in per cent
| 0.5 | 1 | 5 | 10 | 25 | 50 | 75 | 90 | 95 | 99 | 99.5 |
| -0.06 |
-0.05 |
-0.03 |
-0.02 |
-0.01 |
0.00 |
0.01 |
0.03 |
0.04 |
0.06 |
0.59 |
Daily log-return distribution fitting results
| Distribution | Location, a | Scale, b |
| Laplace |
-0.249 |
0.210 |
Linear regression results [Model: y=log(percentile of log-return), x=|log-return|]
| Variable | Coef(b) | s.e.(b) | t-value | P-value |
| Constant |
-0.841 |
0.057 |
-14.728 |
0.0000 |
|log-return| |
-73.418 |
3.121 |
-23.526 |
0.0000 |
I(right-tail) |
0.167 |
0.079 |
2.124 |
0.0339 |
|log-return|*I(right-tail) |
-9.945 |
4.558 |
-2.182 |
0.0293 |
Hurst exponent (of daily return price)
| 12-day | 24-day | 48-day | 96-day |
| 0.480 |
0.375 |
0.748 |
0.818 |
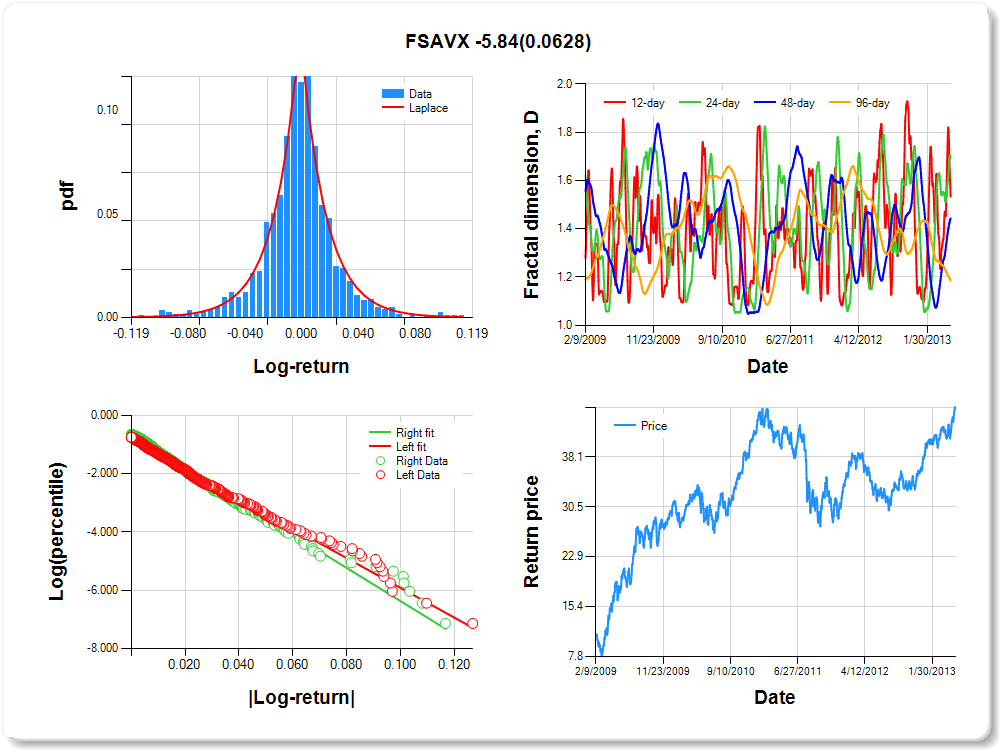
FSAVX
Percentile values of daily loss(gain) in per cent
| 0.5 | 1 | 5 | 10 | 25 | 50 | 75 | 90 | 95 | 99 | 99.5 |
| -0.09 |
-0.08 |
-0.04 |
-0.03 |
-0.01 |
0.00 |
0.01 |
0.04 |
0.07 |
0.10 |
1.48 |
Daily log-return distribution fitting results
| Distribution | Location, a | Scale, b |
| Laplace |
0.085 |
0.246 |
Linear regression results [Model: y=log(percentile of log-return), x=|log-return|]
| Variable | Coef(b) | s.e.(b) | t-value | P-value |
| Constant |
-0.808 |
0.057 |
-14.162 |
0.0000 |
|log-return| |
-51.052 |
2.151 |
-23.738 |
0.0000 |
I(right-tail) |
0.133 |
0.079 |
1.669 |
0.0954 |
|log-return|*I(right-tail) |
-5.840 |
3.136 |
-1.863 |
0.0628 |
Hurst exponent (of daily return price)
| 12-day | 24-day | 48-day | 96-day |
| 0.467 |
0.306 |
0.557 |
0.815 |
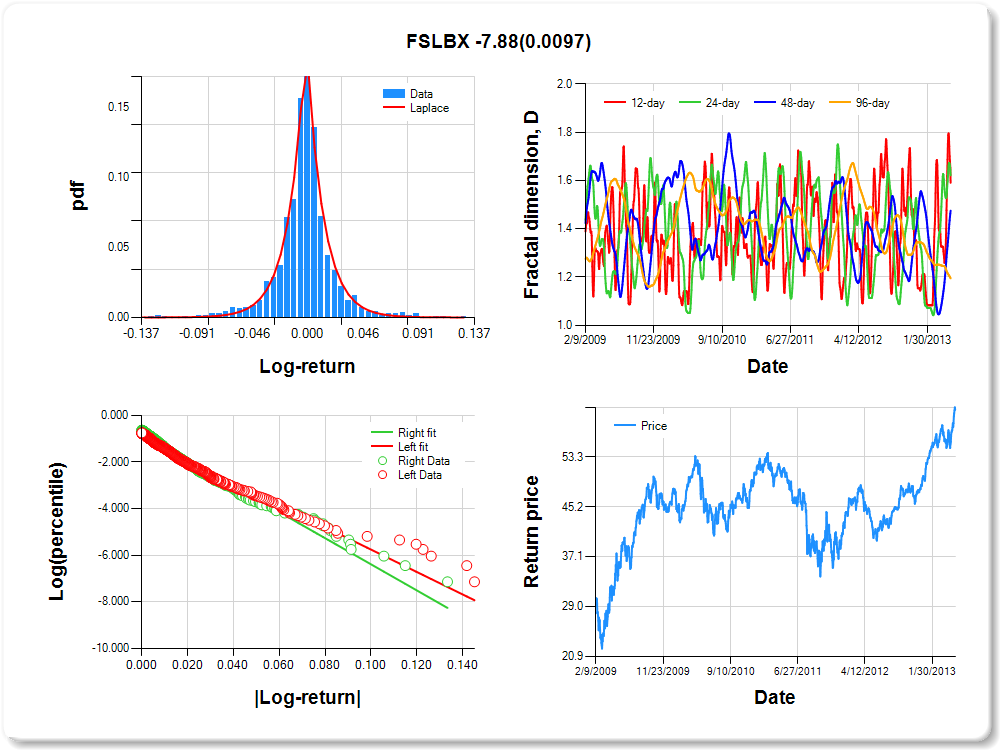
FSLBX
Percentile values of daily loss(gain) in per cent
| 0.5 | 1 | 5 | 10 | 25 | 50 | 75 | 90 | 95 | 99 | 99.5 |
| -0.11 |
-0.07 |
-0.04 |
-0.02 |
-0.01 |
0.00 |
0.01 |
0.04 |
0.08 |
0.09 |
0.67 |
Daily log-return distribution fitting results
| Distribution | Location, a | Scale, b |
| Laplace |
0.085 |
0.171 |
Linear regression results [Model: y=log(percentile of log-return), x=|log-return|]
| Variable | Coef(b) | s.e.(b) | t-value | P-value |
| Constant |
-0.945 |
0.054 |
-17.547 |
0.0000 |
|log-return| |
-48.050 |
2.056 |
-23.375 |
0.0000 |
I(right-tail) |
0.158 |
0.075 |
2.118 |
0.0344 |
|log-return|*I(right-tail) |
-7.883 |
3.042 |
-2.591 |
0.0097 |
Hurst exponent (of daily return price)
| 12-day | 24-day | 48-day | 96-day |
| 0.409 |
0.378 |
0.525 |
0.806 |
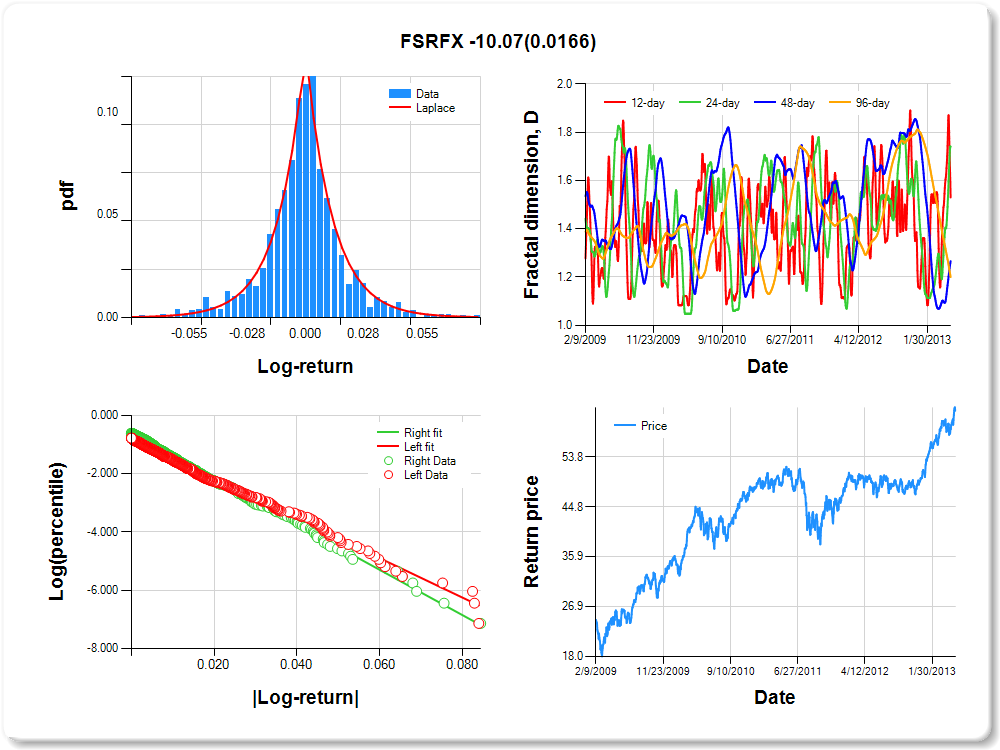
FSRFX
Percentile values of daily loss(gain) in per cent
| 0.5 | 1 | 5 | 10 | 25 | 50 | 75 | 90 | 95 | 99 | 99.5 |
| -0.06 |
-0.05 |
-0.03 |
-0.02 |
-0.01 |
0.00 |
0.01 |
0.03 |
0.05 |
0.06 |
0.55 |
Daily log-return distribution fitting results
| Distribution | Location, a | Scale, b |
| Laplace |
0.023 |
0.260 |
Linear regression results [Model: y=log(percentile of log-return), x=|log-return|]
| Variable | Coef(b) | s.e.(b) | t-value | P-value |
| Constant |
-0.835 |
0.058 |
-14.401 |
0.0000 |
|log-return| |
-67.573 |
2.889 |
-23.389 |
0.0000 |
I(right-tail) |
0.206 |
0.080 |
2.592 |
0.0097 |
|log-return|*I(right-tail) |
-10.069 |
4.197 |
-2.399 |
0.0166 |
Hurst exponent (of daily return price)
| 12-day | 24-day | 48-day | 96-day |
| 0.470 |
0.259 |
0.734 |
0.800 |
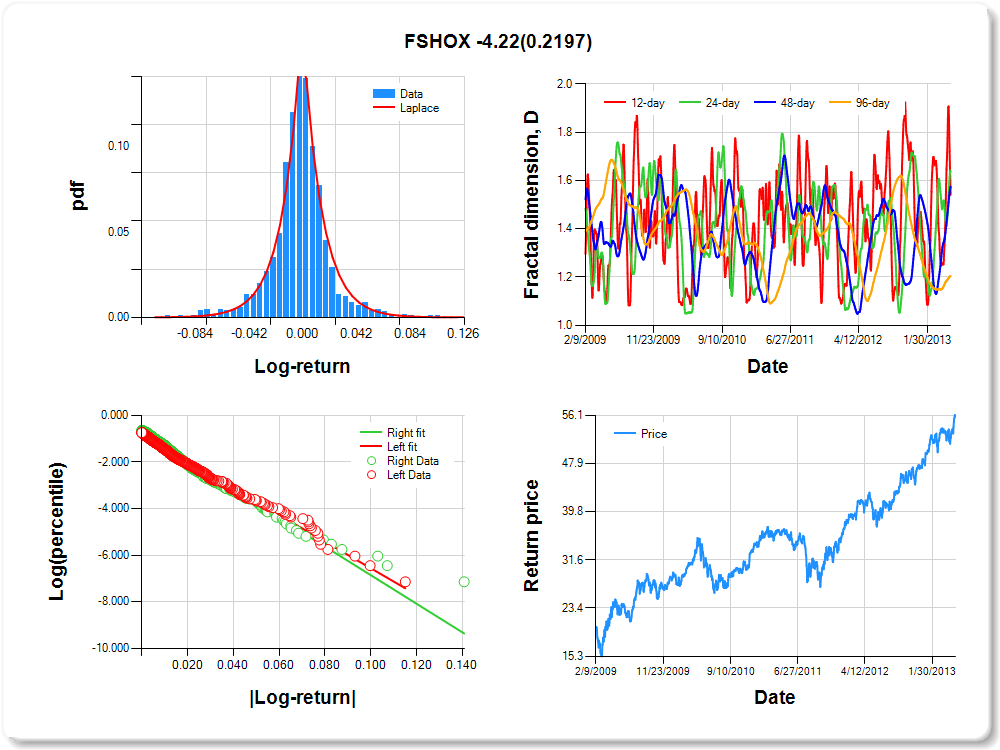
FSHOX
Percentile values of daily loss(gain) in per cent
| 0.5 | 1 | 5 | 10 | 25 | 50 | 75 | 90 | 95 | 99 | 99.5 |
| -0.07 |
-0.07 |
-0.04 |
-0.02 |
-0.01 |
0.00 |
0.01 |
0.04 |
0.06 |
0.07 |
1.02 |
Daily log-return distribution fitting results
| Distribution | Location, a | Scale, b |
| Laplace |
-0.146 |
0.198 |
Linear regression results [Model: y=log(percentile of log-return), x=|log-return|]
| Variable | Coef(b) | s.e.(b) | t-value | P-value |
| Constant |
-0.847 |
0.056 |
-15.254 |
0.0000 |
|log-return| |
-57.022 |
2.396 |
-23.796 |
0.0000 |
I(right-tail) |
0.126 |
0.077 |
1.626 |
0.1043 |
|log-return|*I(right-tail) |
-4.222 |
3.439 |
-1.228 |
0.2197 |
Hurst exponent (of daily return price)
| 12-day | 24-day | 48-day | 96-day |
| 0.459 |
0.361 |
0.425 |
0.796 |
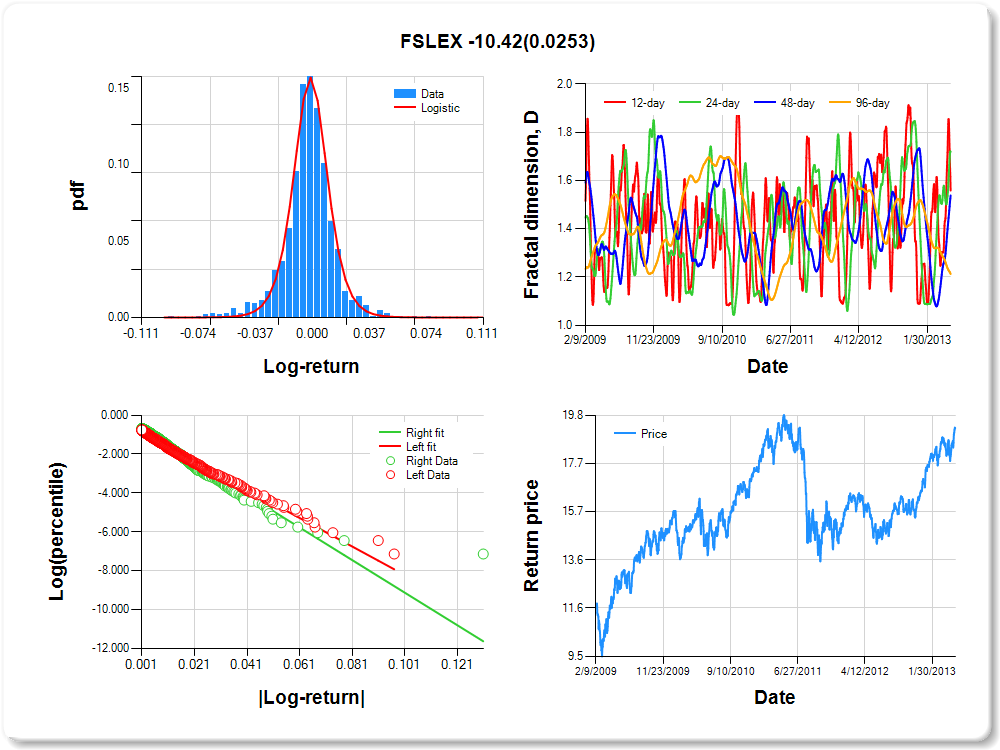
FSLEX
Percentile values of daily loss(gain) in per cent
| 0.5 | 1 | 5 | 10 | 25 | 50 | 75 | 90 | 95 | 99 | 99.5 |
| -0.06 |
-0.05 |
-0.03 |
-0.02 |
-0.01 |
0.00 |
0.01 |
0.02 |
0.05 |
0.05 |
1.10 |
Daily log-return distribution fitting results
| Distribution | Location, a | Scale, b |
| Logistic |
-0.241 |
0.109 |
Linear regression results [Model: y=log(percentile of log-return), x=|log-return|]
| Variable | Coef(b) | s.e.(b) | t-value | P-value |
| Constant |
-0.845 |
0.056 |
-15.052 |
0.0000 |
|log-return| |
-73.444 |
3.102 |
-23.679 |
0.0000 |
I(right-tail) |
0.140 |
0.079 |
1.755 |
0.0795 |
|log-return|*I(right-tail) |
-10.423 |
4.655 |
-2.239 |
0.0253 |
Hurst exponent (of daily return price)
| 12-day | 24-day | 48-day | 96-day |
| 0.442 |
0.280 |
0.461 |
0.787 |
FCYIX
Percentile values of daily loss(gain) in per cent
| 0.5 | 1 | 5 | 10 | 25 | 50 | 75 | 90 | 95 | 99 | 99.5 |
| -0.07 |
-0.05 |
-0.03 |
-0.02 |
-0.01 |
0.00 |
0.01 |
0.03 |
0.05 |
0.07 |
2.16 |
Daily log-return distribution fitting results
| Distribution | Location, a | Scale, b |
| Laplace |
0.151 |
0.219 |
Linear regression results [Model: y=log(percentile of log-return), x=|log-return|]
| Variable | Coef(b) | s.e.(b) | t-value | P-value |
| Constant |
-0.878 |
0.058 |
-15.144 |
0.0000 |
|log-return| |
-65.152 |
2.819 |
-23.113 |
0.0000 |
I(right-tail) |
0.236 |
0.080 |
2.960 |
0.0031 |
|log-return|*I(right-tail) |
-13.452 |
4.196 |
-3.206 |
0.0014 |
Hurst exponent (of daily return price)
| 12-day | 24-day | 48-day | 96-day |
| 0.580 |
0.442 |
0.585 |
0.783 |

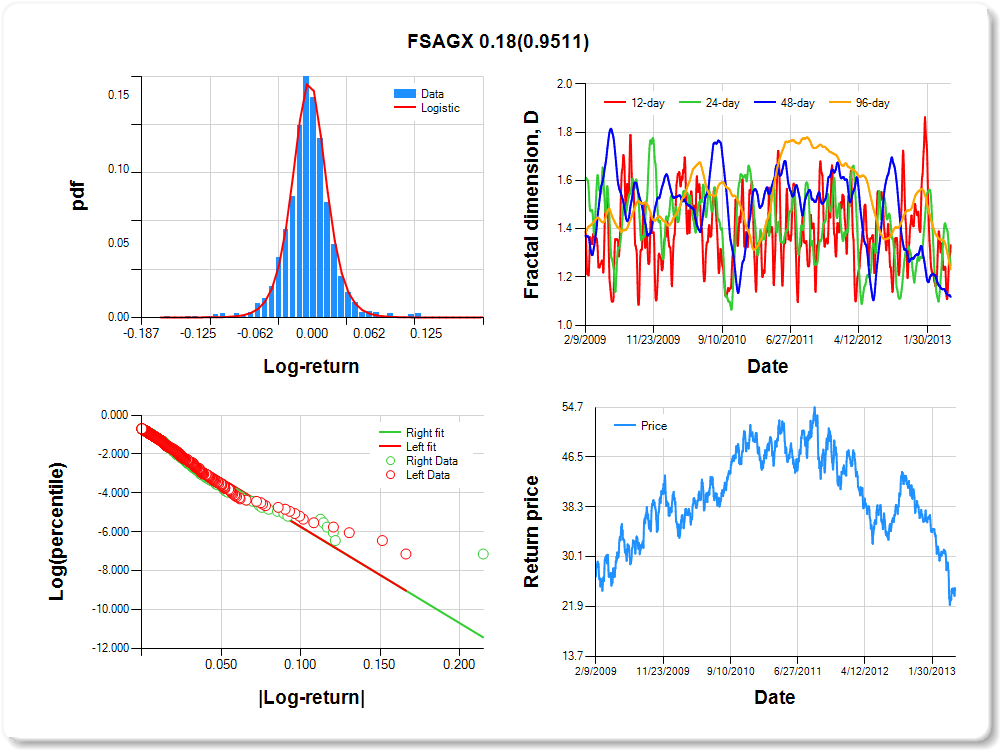
FSAGX
Percentile values of daily loss(gain) in per cent
| 0.5 | 1 | 5 | 10 | 25 | 50 | 75 | 90 | 95 | 99 | 99.5 |
| -0.10 |
-0.07 |
-0.04 |
-0.03 |
-0.01 |
0.00 |
0.01 |
0.04 |
0.08 |
0.10 |
1.63 |
Daily log-return distribution fitting results
| Distribution | Location, a | Scale, b |
| Logistic |
-0.216 |
0.108 |
Linear regression results [Model: y=log(percentile of log-return), x=|log-return|]
| Variable | Coef(b) | s.e.(b) | t-value | P-value |
| Constant |
-0.767 |
0.055 |
-13.892 |
0.0000 |
|log-return| |
-49.635 |
2.058 |
-24.116 |
0.0000 |
I(right-tail) |
-0.025 |
0.078 |
-0.325 |
0.7451 |
|log-return|*I(right-tail) |
0.180 |
2.929 |
0.061 |
0.9511 |
Hurst exponent (of daily return price)
| 12-day | 24-day | 48-day | 96-day |
| 0.668 |
0.753 |
0.882 |
0.768 |
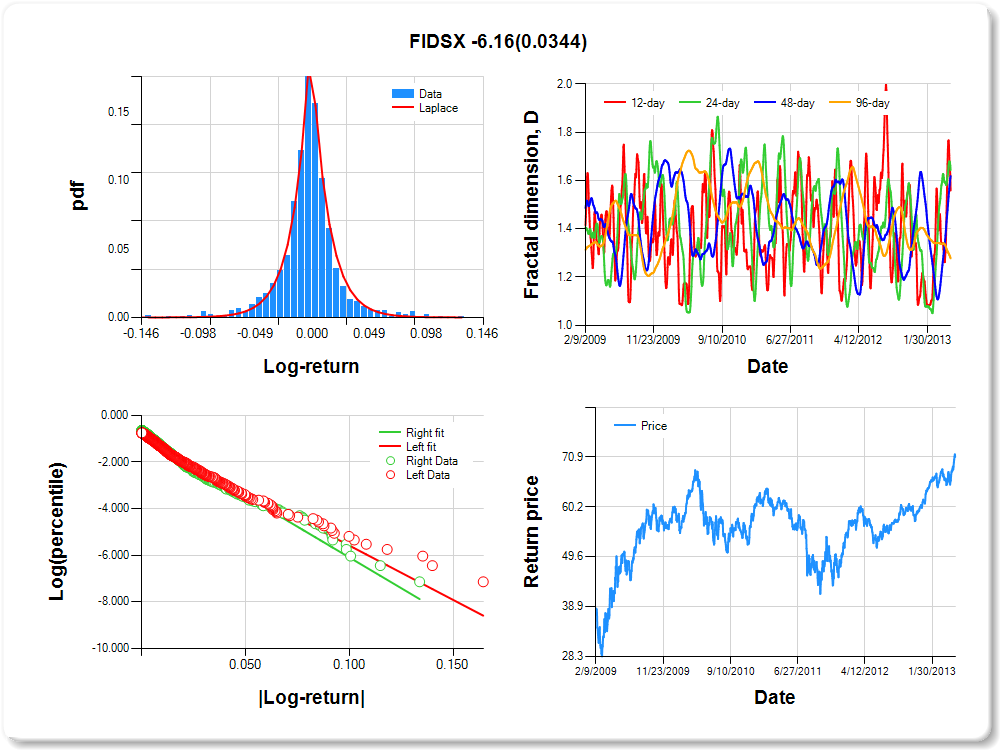
FIDSX
Percentile values of daily loss(gain) in per cent
| 0.5 | 1 | 5 | 10 | 25 | 50 | 75 | 90 | 95 | 99 | 99.5 |
| -0.10 |
-0.08 |
-0.04 |
-0.03 |
-0.01 |
0.00 |
0.01 |
0.04 |
0.08 |
0.10 |
0.40 |
Daily log-return distribution fitting results
| Distribution | Location, a | Scale, b |
| Laplace |
0.192 |
0.167 |
Linear regression results [Model: y=log(percentile of log-return), x=|log-return|]
| Variable | Coef(b) | s.e.(b) | t-value | P-value |
| Constant |
-0.924 |
0.054 |
-17.079 |
0.0000 |
|log-return| |
-46.583 |
1.986 |
-23.458 |
0.0000 |
I(right-tail) |
0.108 |
0.075 |
1.448 |
0.1480 |
|log-return|*I(right-tail) |
-6.160 |
2.909 |
-2.117 |
0.0344 |
Hurst exponent (of daily return price)
| 12-day | 24-day | 48-day | 96-day |
| 0.441 |
0.356 |
0.382 |
0.723 |
FBMPX
Percentile values of daily loss(gain) in per cent
| 0.5 | 1 | 5 | 10 | 25 | 50 | 75 | 90 | 95 | 99 | 99.5 |
| -0.07 |
-0.05 |
-0.03 |
-0.02 |
-0.01 |
0.00 |
0.01 |
0.03 |
0.05 |
0.06 |
0.45 |
Daily log-return distribution fitting results
| Distribution | Location, a | Scale, b |
| Laplace |
-0.137 |
0.158 |
Linear regression results [Model: y=log(percentile of log-return), x=|log-return|]
| Variable | Coef(b) | s.e.(b) | t-value | P-value |
| Constant |
-0.940 |
0.056 |
-16.908 |
0.0000 |
|log-return| |
-65.469 |
2.830 |
-23.132 |
0.0000 |
I(right-tail) |
0.180 |
0.076 |
2.372 |
0.0178 |
|log-return|*I(right-tail) |
-6.100 |
4.041 |
-1.510 |
0.1313 |
Hurst exponent (of daily return price)
| 12-day | 24-day | 48-day | 96-day |
| 0.429 |
0.791 |
0.869 |
0.700 |

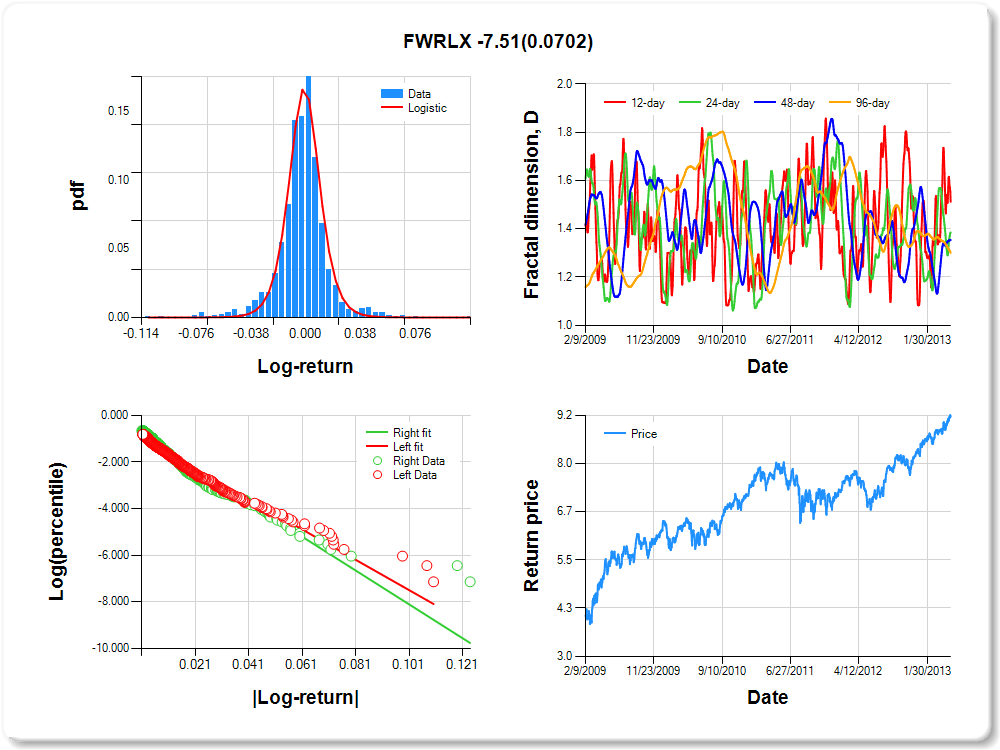
FWRLX
Percentile values of daily loss(gain) in per cent
| 0.5 | 1 | 5 | 10 | 25 | 50 | 75 | 90 | 95 | 99 | 99.5 |
| -0.07 |
-0.06 |
-0.03 |
-0.02 |
-0.01 |
0.00 |
0.01 |
0.03 |
0.05 |
0.06 |
0.09 |
Daily log-return distribution fitting results
| Distribution | Location, a | Scale, b |
| Logistic |
-0.083 |
0.103 |
Linear regression results [Model: y=log(percentile of log-return), x=|log-return|]
| Variable | Coef(b) | s.e.(b) | t-value | P-value |
| Constant |
-0.947 |
0.057 |
-16.623 |
0.0000 |
|log-return| |
-65.024 |
2.864 |
-22.705 |
0.0000 |
I(right-tail) |
0.147 |
0.078 |
1.891 |
0.0589 |
|log-return|*I(right-tail) |
-7.512 |
4.145 |
-1.812 |
0.0702 |
Hurst exponent (of daily return price)
| 12-day | 24-day | 48-day | 96-day |
| 0.488 |
0.615 |
0.646 |
0.700 |
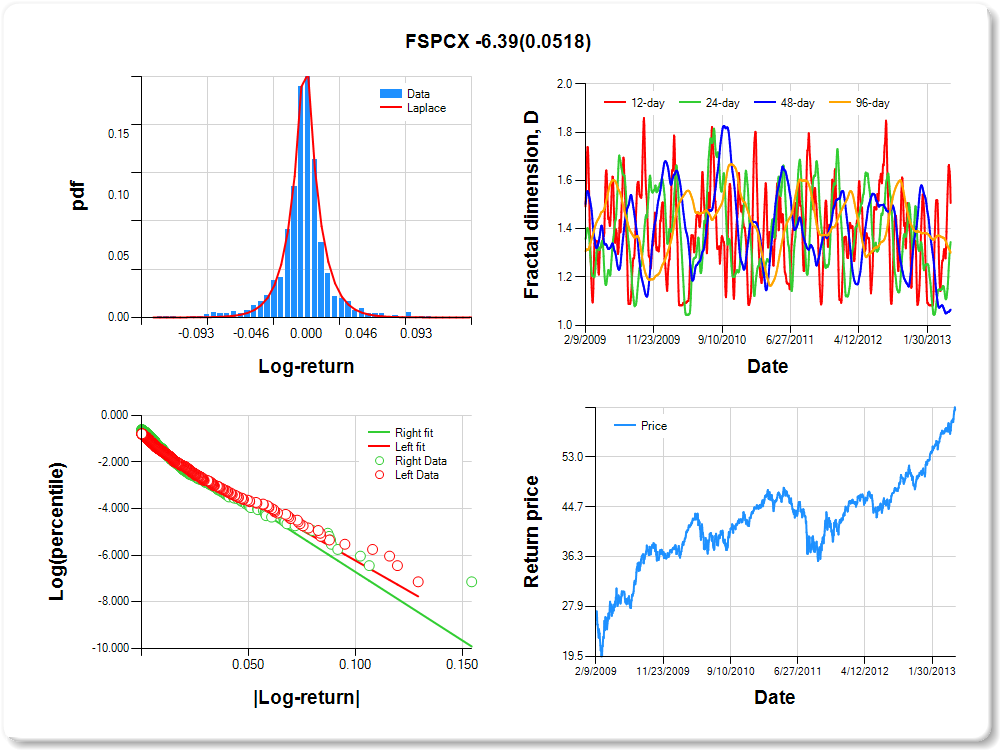
FSPCX
Percentile values of daily loss(gain) in per cent
| 0.5 | 1 | 5 | 10 | 25 | 50 | 75 | 90 | 95 | 99 | 99.5 |
| -0.08 |
-0.07 |
-0.03 |
-0.02 |
-0.01 |
0.00 |
0.01 |
0.03 |
0.07 |
0.09 |
2.21 |
Daily log-return distribution fitting results
| Distribution | Location, a | Scale, b |
| Laplace |
-0.133 |
0.139 |
Linear regression results [Model: y=log(percentile of log-return), x=|log-return|]
| Variable | Coef(b) | s.e.(b) | t-value | P-value |
| Constant |
-0.994 |
0.054 |
-18.266 |
0.0000 |
|log-return| |
-52.332 |
2.278 |
-22.972 |
0.0000 |
I(right-tail) |
0.152 |
0.074 |
2.070 |
0.0386 |
|log-return|*I(right-tail) |
-6.393 |
3.284 |
-1.946 |
0.0518 |
Hurst exponent (of daily return price)
| 12-day | 24-day | 48-day | 96-day |
| 0.493 |
0.655 |
0.935 |
0.699 |
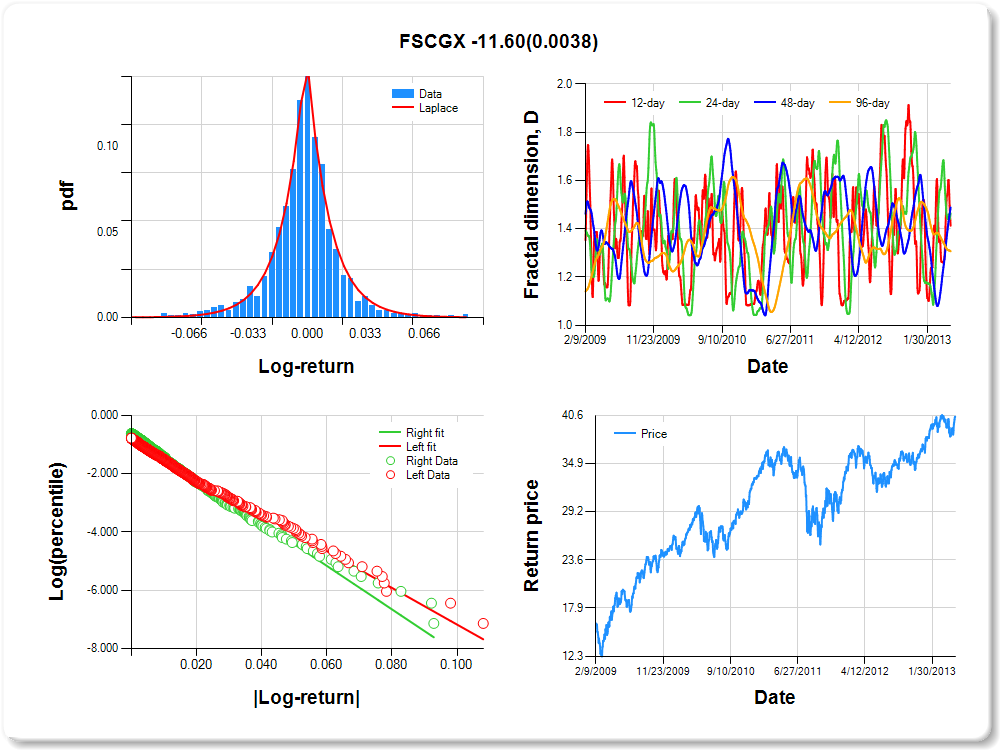
FSCGX
Percentile values of daily loss(gain) in per cent
| 0.5 | 1 | 5 | 10 | 25 | 50 | 75 | 90 | 95 | 99 | 99.5 |
| -0.07 |
-0.06 |
-0.03 |
-0.02 |
-0.01 |
0.00 |
0.01 |
0.03 |
0.06 |
0.07 |
1.15 |
Daily log-return distribution fitting results
| Distribution | Location, a | Scale, b |
| Laplace |
0.153 |
0.218 |
Linear regression results [Model: y=log(percentile of log-return), x=|log-return|]
| Variable | Coef(b) | s.e.(b) | t-value | P-value |
| Constant |
-0.867 |
0.057 |
-15.185 |
0.0000 |
|log-return| |
-62.986 |
2.696 |
-23.364 |
0.0000 |
I(right-tail) |
0.193 |
0.079 |
2.458 |
0.0141 |
|log-return|*I(right-tail) |
-11.596 |
3.999 |
-2.900 |
0.0038 |
Hurst exponent (of daily return price)
| 12-day | 24-day | 48-day | 96-day |
| 0.587 |
0.536 |
0.512 |
0.693 |
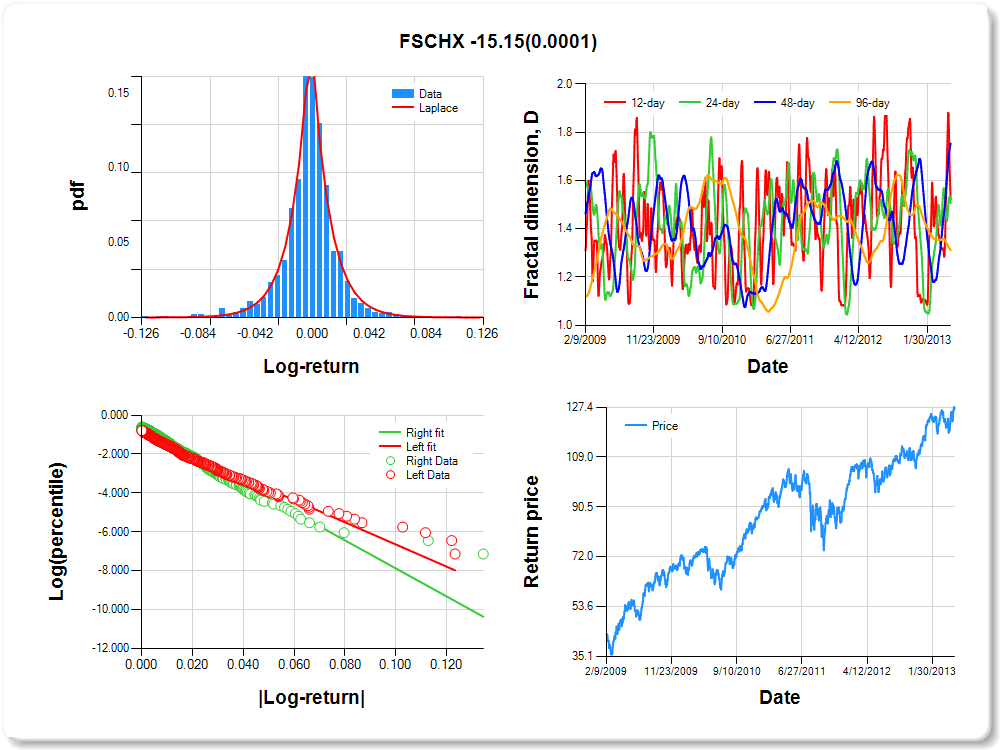
FSCHX
Percentile values of daily loss(gain) in per cent
| 0.5 | 1 | 5 | 10 | 25 | 50 | 75 | 90 | 95 | 99 | 99.5 |
| -0.08 |
-0.06 |
-0.03 |
-0.02 |
-0.01 |
0.00 |
0.01 |
0.03 |
0.05 |
0.06 |
1.41 |
Daily log-return distribution fitting results
| Distribution | Location, a | Scale, b |
| Laplace |
-0.058 |
0.176 |
Linear regression results [Model: y=log(percentile of log-return), x=|log-return|]
| Variable | Coef(b) | s.e.(b) | t-value | P-value |
| Constant |
-0.948 |
0.055 |
-17.082 |
0.0000 |
|log-return| |
-56.938 |
2.469 |
-23.057 |
0.0000 |
I(right-tail) |
0.285 |
0.077 |
3.701 |
0.0002 |
|log-return|*I(right-tail) |
-15.148 |
3.780 |
-4.008 |
0.0001 |
Hurst exponent (of daily return price)
| 12-day | 24-day | 48-day | 96-day |
| 0.477 |
0.493 |
0.246 |
0.689 |
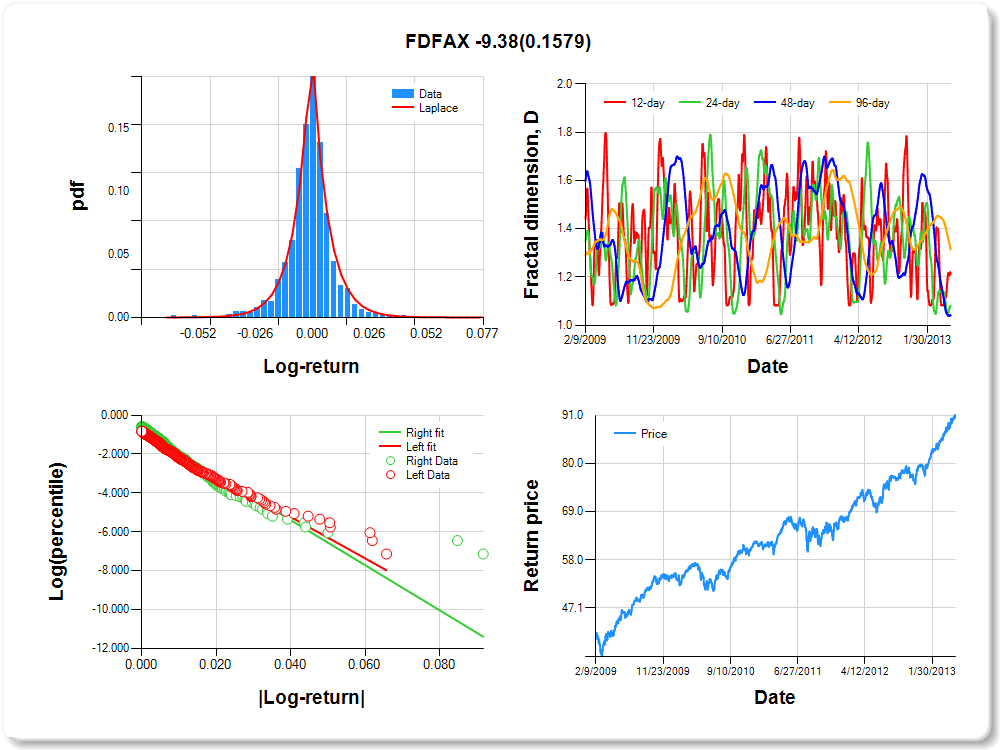
FDFAX
Percentile values of daily loss(gain) in per cent
| 0.5 | 1 | 5 | 10 | 25 | 50 | 75 | 90 | 95 | 99 | 99.5 |
| -0.05 |
-0.03 |
-0.02 |
-0.01 |
0.00 |
0.00 |
0.01 |
0.02 |
0.03 |
0.04 |
1.54 |
Daily log-return distribution fitting results
| Distribution | Location, a | Scale, b |
| Laplace |
-0.258 |
0.156 |
Linear regression results [Model: y=log(percentile of log-return), x=|log-return|]
| Variable | Coef(b) | s.e.(b) | t-value | P-value |
| Constant |
-0.960 |
0.057 |
-16.791 |
0.0000 |
|log-return| |
-106.521 |
4.712 |
-22.607 |
0.0000 |
I(right-tail) |
0.214 |
0.076 |
2.794 |
0.0053 |
|log-return|*I(right-tail) |
-9.383 |
6.640 |
-1.413 |
0.1579 |
Hurst exponent (of daily return price)
| 12-day | 24-day | 48-day | 96-day |
| 0.788 |
0.919 |
0.958 |
0.686 |
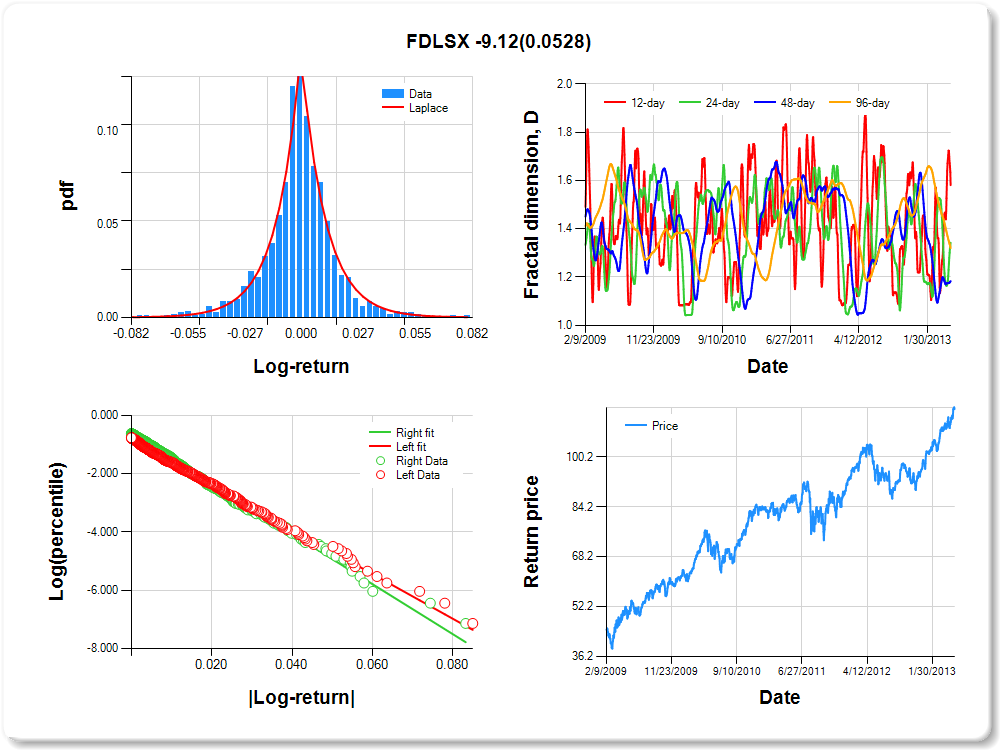
FDLSX
Percentile values of daily loss(gain) in per cent
| 0.5 | 1 | 5 | 10 | 25 | 50 | 75 | 90 | 95 | 99 | 99.5 |
| -0.06 |
-0.05 |
-0.03 |
-0.02 |
-0.01 |
0.00 |
0.01 |
0.03 |
0.05 |
0.06 |
0.67 |
Daily log-return distribution fitting results
| Distribution | Location, a | Scale, b |
| Laplace |
0.042 |
0.239 |
Linear regression results [Model: y=log(percentile of log-return), x=|log-return|]
| Variable | Coef(b) | s.e.(b) | t-value | P-value |
| Constant |
-0.835 |
0.057 |
-14.572 |
0.0000 |
|log-return| |
-76.767 |
3.258 |
-23.559 |
0.0000 |
I(right-tail) |
0.201 |
0.079 |
2.525 |
0.0117 |
|log-return|*I(right-tail) |
-9.117 |
4.704 |
-1.938 |
0.0528 |
Hurst exponent (of daily return price)
| 12-day | 24-day | 48-day | 96-day |
| 0.419 |
0.657 |
0.817 |
0.680 |
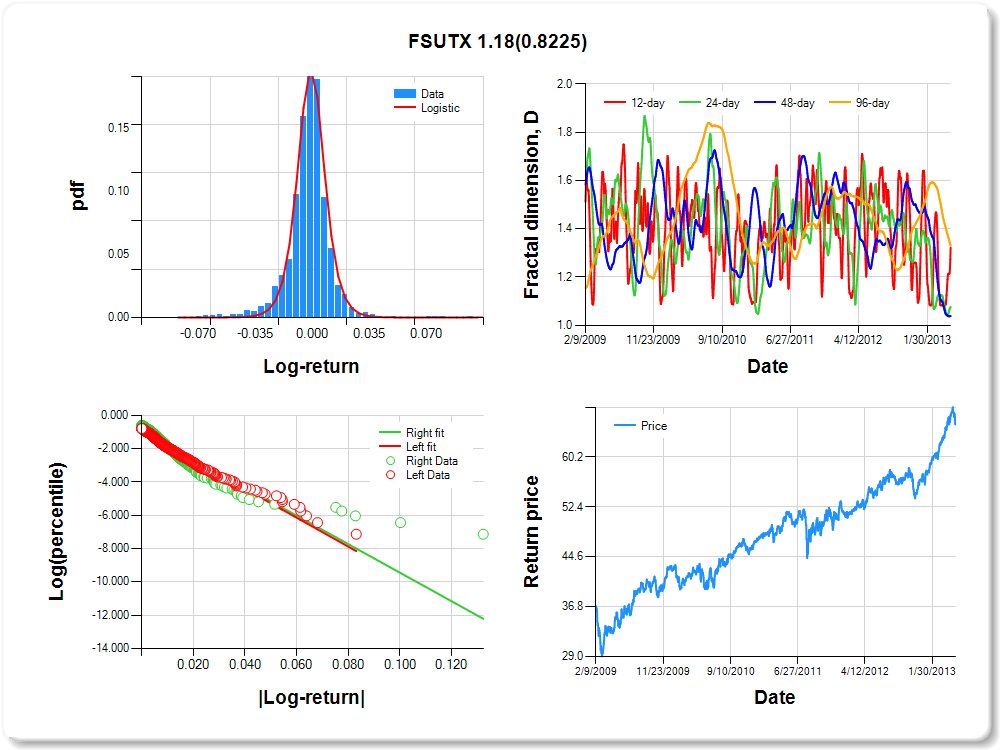
FSUTX
Percentile values of daily loss(gain) in per cent
| 0.5 | 1 | 5 | 10 | 25 | 50 | 75 | 90 | 95 | 99 | 99.5 |
| -0.06 |
-0.04 |
-0.02 |
-0.01 |
-0.01 |
0.00 |
0.01 |
0.02 |
0.04 |
0.05 |
2.34 |
Daily log-return distribution fitting results
| Distribution | Location, a | Scale, b |
| Logistic |
-0.372 |
0.086 |
Linear regression results [Model: y=log(percentile of log-return), x=|log-return|]
| Variable | Coef(b) | s.e.(b) | t-value | P-value |
| Constant |
-0.929 |
0.057 |
-16.424 |
0.0000 |
|log-return| |
-86.802 |
3.781 |
-22.956 |
0.0000 |
I(right-tail) |
0.055 |
0.075 |
0.737 |
0.4616 |
|log-return|*I(right-tail) |
1.179 |
5.255 |
0.224 |
0.8225 |
Hurst exponent (of daily return price)
| 12-day | 24-day | 48-day | 96-day |
| 0.678 |
0.924 |
0.962 |
0.671 |
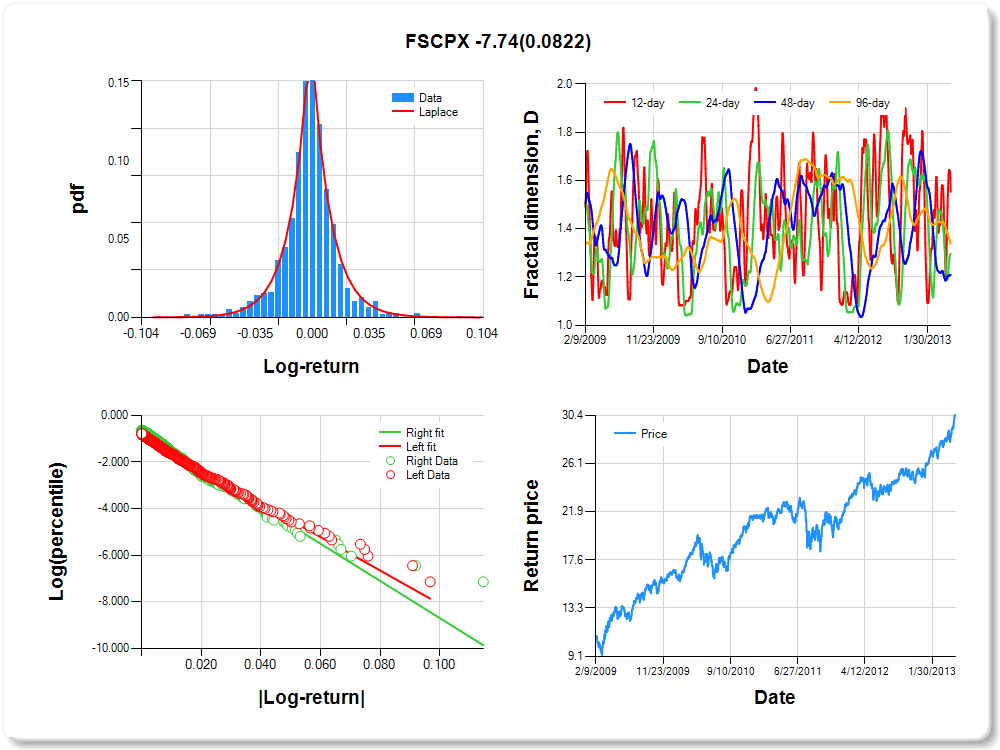
FSCPX
Percentile values of daily loss(gain) in per cent
| 0.5 | 1 | 5 | 10 | 25 | 50 | 75 | 90 | 95 | 99 | 99.5 |
| -0.06 |
-0.05 |
-0.03 |
-0.02 |
-0.01 |
0.00 |
0.01 |
0.03 |
0.05 |
0.05 |
1.17 |
Daily log-return distribution fitting results
| Distribution | Location, a | Scale, b |
| Laplace |
-0.129 |
0.185 |
Linear regression results [Model: y=log(percentile of log-return), x=|log-return|]
| Variable | Coef(b) | s.e.(b) | t-value | P-value |
| Constant |
-0.880 |
0.057 |
-15.455 |
0.0000 |
|log-return| |
-71.873 |
3.087 |
-23.286 |
0.0000 |
I(right-tail) |
0.175 |
0.079 |
2.234 |
0.0257 |
|log-return|*I(right-tail) |
-7.738 |
4.448 |
-1.739 |
0.0822 |
Hurst exponent (of daily return price)
| 12-day | 24-day | 48-day | 96-day |
| 0.447 |
0.704 |
0.792 |
0.662 |
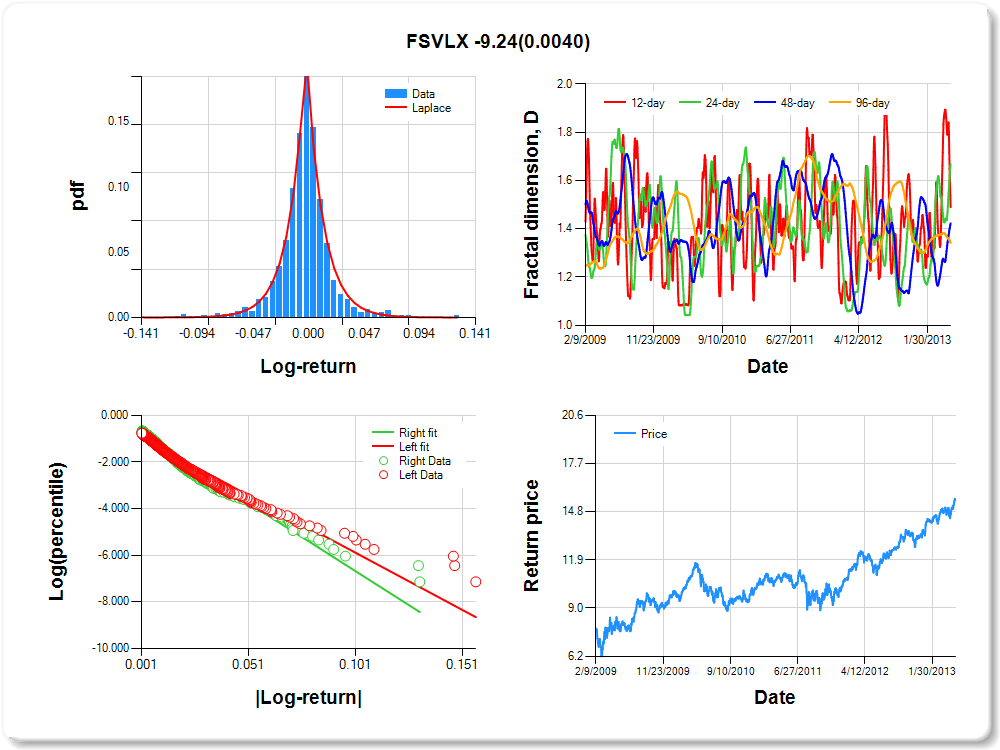
FSVLX
Percentile values of daily loss(gain) in per cent
| 0.5 | 1 | 5 | 10 | 25 | 50 | 75 | 90 | 95 | 99 | 99.5 |
| -0.10 |
-0.07 |
-0.03 |
-0.02 |
-0.01 |
0.00 |
0.01 |
0.03 |
0.07 |
0.08 |
1.07 |
Daily log-return distribution fitting results
| Distribution | Location, a | Scale, b |
| Laplace |
0.164 |
0.167 |
Linear regression results [Model: y=log(percentile of log-return), x=|log-return|]
| Variable | Coef(b) | s.e.(b) | t-value | P-value |
| Constant |
-0.966 |
0.054 |
-17.876 |
0.0000 |
|log-return| |
-49.069 |
2.131 |
-23.026 |
0.0000 |
I(right-tail) |
0.138 |
0.075 |
1.833 |
0.0671 |
|log-return|*I(right-tail) |
-9.239 |
3.208 |
-2.880 |
0.0040 |
Hurst exponent (of daily return price)
| 12-day | 24-day | 48-day | 96-day |
| 0.510 |
0.332 |
0.577 |
0.659 |
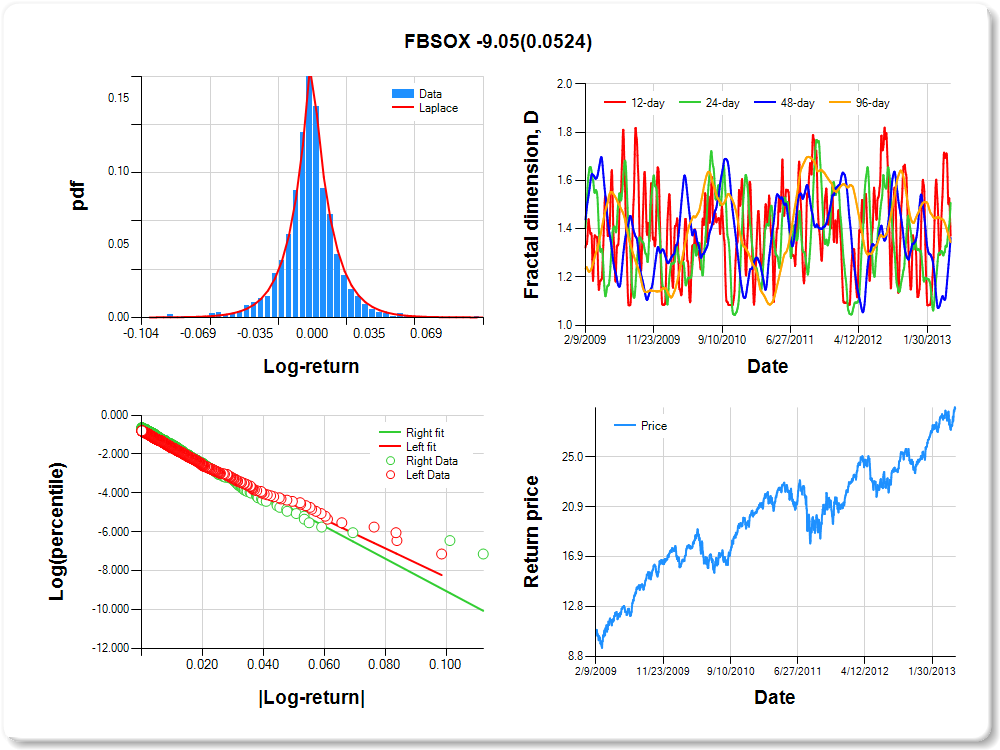
FBSOX
Percentile values of daily loss(gain) in per cent
| 0.5 | 1 | 5 | 10 | 25 | 50 | 75 | 90 | 95 | 99 | 99.5 |
| -0.06 |
-0.05 |
-0.03 |
-0.02 |
-0.01 |
0.00 |
0.01 |
0.03 |
0.05 |
0.06 |
0.25 |
Daily log-return distribution fitting results
| Distribution | Location, a | Scale, b |
| Laplace |
-0.087 |
0.185 |
Linear regression results [Model: y=log(percentile of log-return), x=|log-return|]
| Variable | Coef(b) | s.e.(b) | t-value | P-value |
| Constant |
-0.881 |
0.058 |
-15.234 |
0.0000 |
|log-return| |
-74.241 |
3.221 |
-23.052 |
0.0000 |
I(right-tail) |
0.194 |
0.080 |
2.442 |
0.0148 |
|log-return|*I(right-tail) |
-9.045 |
4.658 |
-1.942 |
0.0524 |
Hurst exponent (of daily return price)
| 12-day | 24-day | 48-day | 96-day |
| 0.629 |
0.492 |
0.637 |
0.655 |
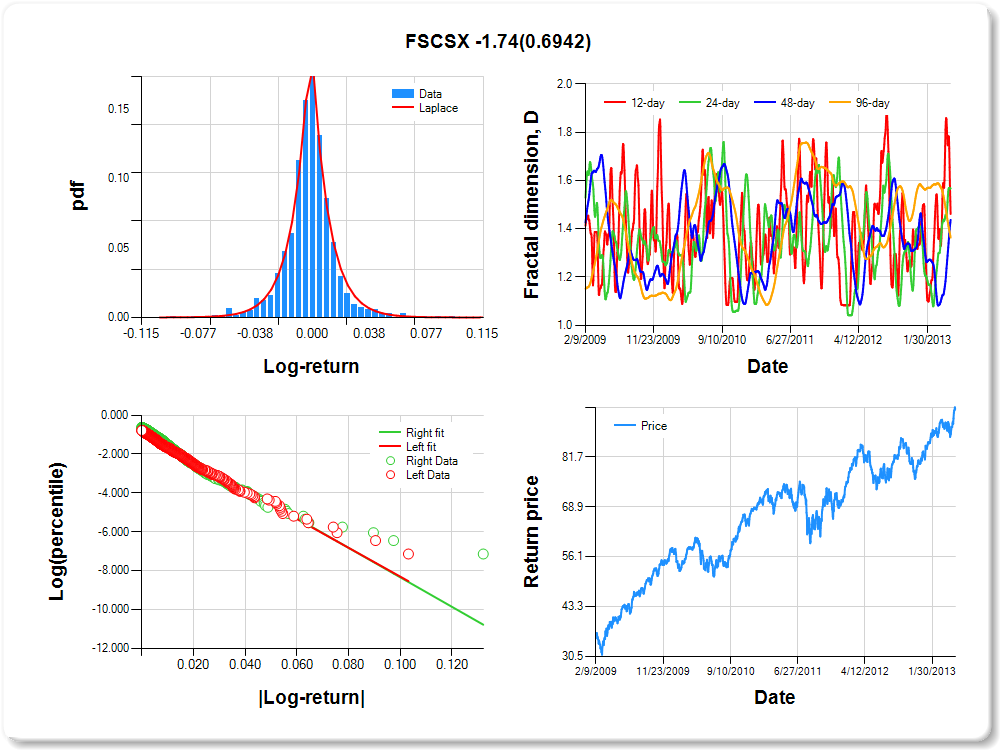
FSCSX
Percentile values of daily loss(gain) in per cent
| 0.5 | 1 | 5 | 10 | 25 | 50 | 75 | 90 | 95 | 99 | 99.5 |
| -0.06 |
-0.05 |
-0.03 |
-0.02 |
-0.01 |
0.00 |
0.01 |
0.03 |
0.05 |
0.06 |
1.21 |
Daily log-return distribution fitting results
| Distribution | Location, a | Scale, b |
| Laplace |
-0.194 |
0.167 |
Linear regression results [Model: y=log(percentile of log-return), x=|log-return|]
| Variable | Coef(b) | s.e.(b) | t-value | P-value |
| Constant |
-0.882 |
0.057 |
-15.522 |
0.0000 |
|log-return| |
-74.132 |
3.189 |
-23.247 |
0.0000 |
I(right-tail) |
0.135 |
0.077 |
1.756 |
0.0793 |
|log-return|*I(right-tail) |
-1.739 |
4.421 |
-0.393 |
0.6942 |
Hurst exponent (of daily return price)
| 12-day | 24-day | 48-day | 96-day |
| 0.539 |
0.432 |
0.563 |
0.637 |
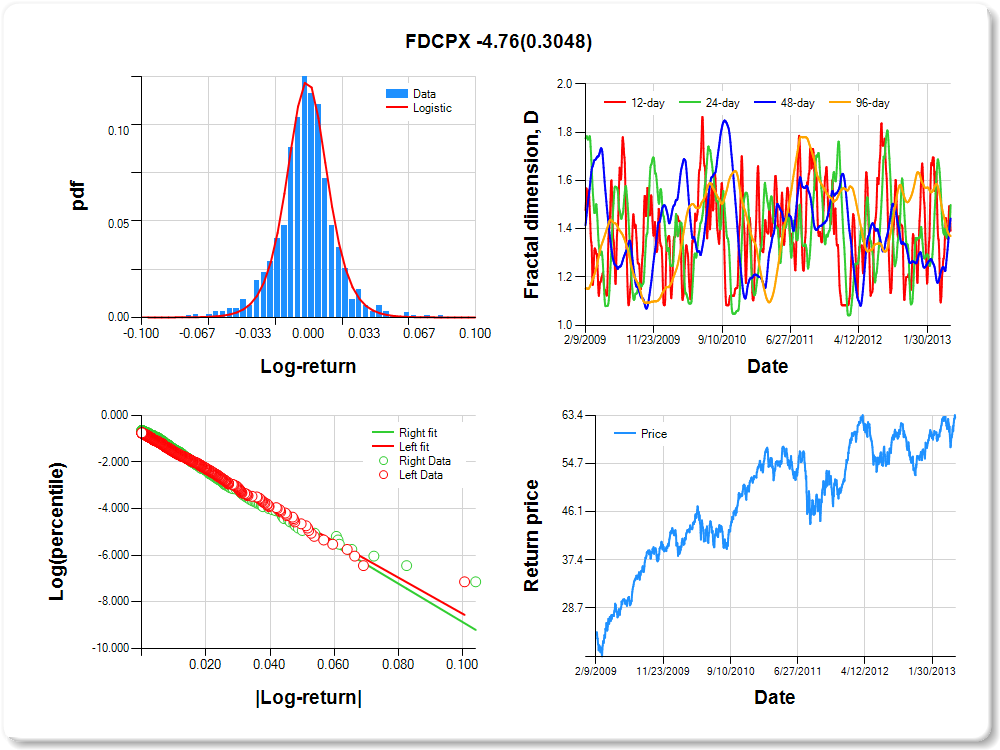
FDCPX
Percentile values of daily loss(gain) in per cent
| 0.5 | 1 | 5 | 10 | 25 | 50 | 75 | 90 | 95 | 99 | 99.5 |
| -0.06 |
-0.05 |
-0.03 |
-0.02 |
-0.01 |
0.00 |
0.01 |
0.03 |
0.05 |
0.06 |
2.10 |
Daily log-return distribution fitting results
| Distribution | Location, a | Scale, b |
| Logistic |
-0.011 |
0.135 |
Linear regression results [Model: y=log(percentile of log-return), x=|log-return|]
| Variable | Coef(b) | s.e.(b) | t-value | P-value |
| Constant |
-0.755 |
0.059 |
-12.897 |
0.0000 |
|log-return| |
-77.423 |
3.259 |
-23.755 |
0.0000 |
I(right-tail) |
0.122 |
0.081 |
1.505 |
0.1325 |
|log-return|*I(right-tail) |
-4.760 |
4.636 |
-1.027 |
0.3048 |
Hurst exponent (of daily return price)
| 12-day | 24-day | 48-day | 96-day |
| 0.608 |
0.501 |
0.557 |
0.629 |
FSRPX
Percentile values of daily loss(gain) in per cent
| 0.5 | 1 | 5 | 10 | 25 | 50 | 75 | 90 | 95 | 99 | 99.5 |
| -0.06 |
-0.05 |
-0.03 |
-0.02 |
-0.01 |
0.00 |
0.01 |
0.03 |
0.05 |
0.06 |
0.46 |
Daily log-return distribution fitting results
| Distribution | Location, a | Scale, b |
| Laplace |
-0.130 |
0.199 |
Linear regression results [Model: y=log(percentile of log-return), x=|log-return|]
| Variable | Coef(b) | s.e.(b) | t-value | P-value |
| Constant |
-0.826 |
0.059 |
-13.897 |
0.0000 |
|log-return| |
-74.376 |
3.221 |
-23.092 |
0.0000 |
I(right-tail) |
0.132 |
0.079 |
1.672 |
0.0947 |
|log-return|*I(right-tail) |
-2.086 |
4.417 |
-0.472 |
0.6369 |
Hurst exponent (of daily return price)
| 12-day | 24-day | 48-day | 96-day |
| 0.349 |
0.463 |
0.553 |
0.620 |

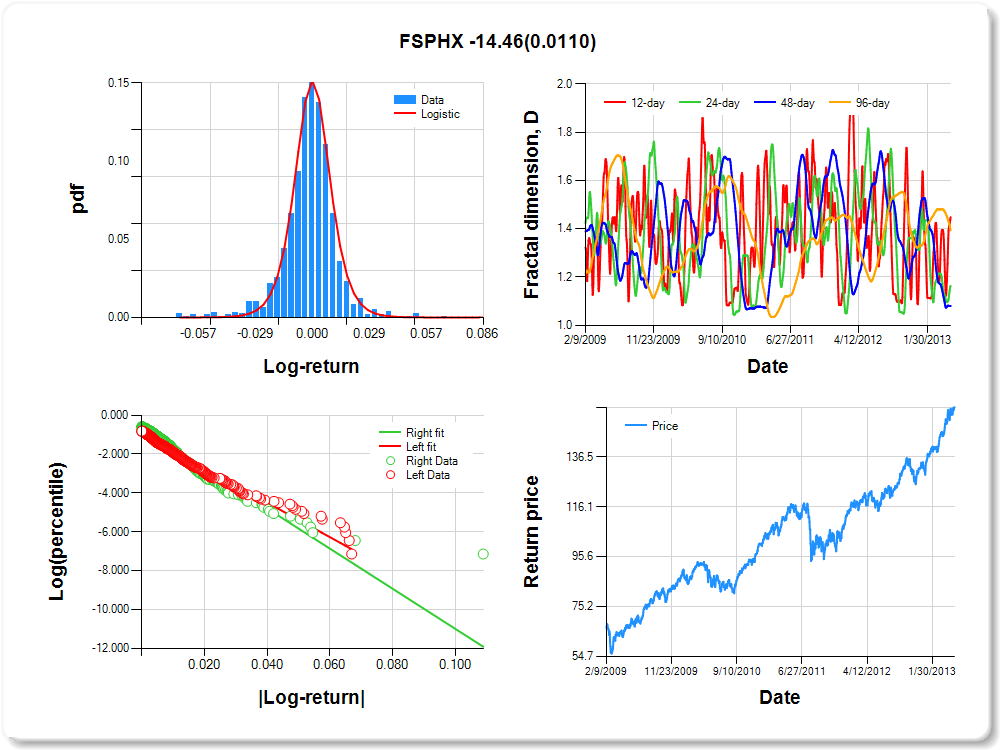
FSPHX
Percentile values of daily loss(gain) in per cent
| 0.5 | 1 | 5 | 10 | 25 | 50 | 75 | 90 | 95 | 99 | 99.5 |
| -0.06 |
-0.05 |
-0.02 |
-0.01 |
0.00 |
0.00 |
0.01 |
0.02 |
0.04 |
0.05 |
0.42 |
Daily log-return distribution fitting results
| Distribution | Location, a | Scale, b |
| Logistic |
-0.375 |
0.113 |
Linear regression results [Model: y=log(percentile of log-return), x=|log-return|]
| Variable | Coef(b) | s.e.(b) | t-value | P-value |
| Constant |
-0.943 |
0.057 |
-16.534 |
0.0000 |
|log-return| |
-88.763 |
3.900 |
-22.762 |
0.0000 |
I(right-tail) |
0.278 |
0.078 |
3.574 |
0.0004 |
|log-return|*I(right-tail) |
-14.459 |
5.680 |
-2.546 |
0.0110 |
Hurst exponent (of daily return price)
| 12-day | 24-day | 48-day | 96-day |
| 0.552 |
0.837 |
0.919 |
0.606 |
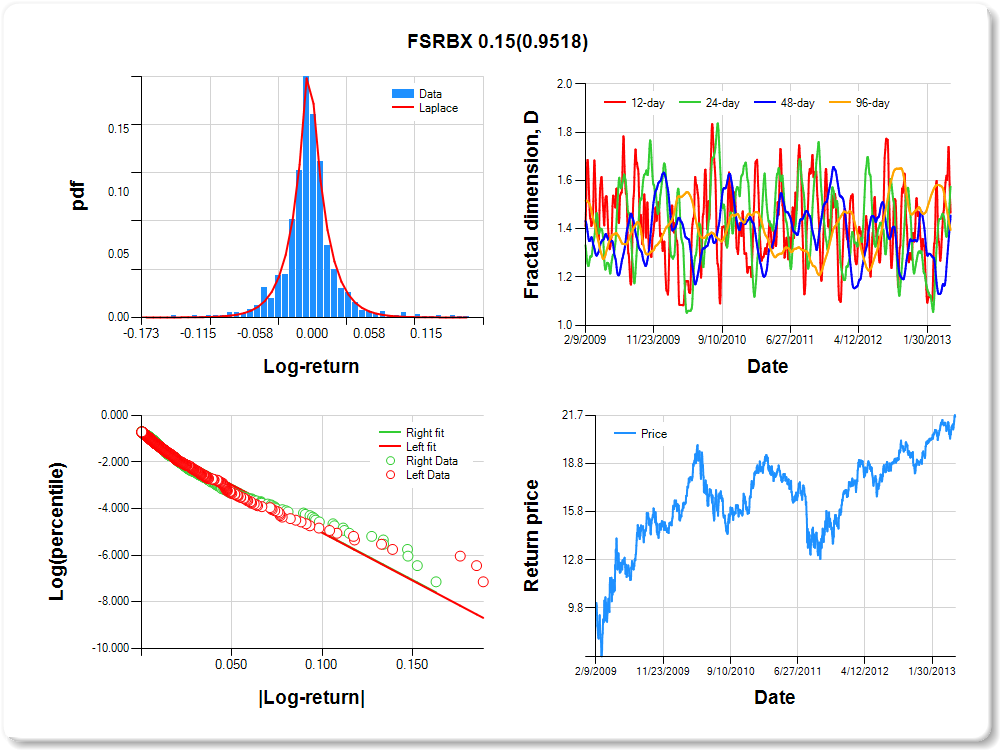
FSRBX
Percentile values of daily loss(gain) in per cent
| 0.5 | 1 | 5 | 10 | 25 | 50 | 75 | 90 | 95 | 99 | 99.5 |
| -0.11 |
-0.08 |
-0.04 |
-0.03 |
-0.01 |
0.00 |
0.01 |
0.04 |
0.10 |
0.14 |
2.39 |
Daily log-return distribution fitting results
| Distribution | Location, a | Scale, b |
| Laplace |
0.129 |
0.153 |
Linear regression results [Model: y=log(percentile of log-return), x=|log-return|]
| Variable | Coef(b) | s.e.(b) | t-value | P-value |
| Constant |
-0.931 |
0.052 |
-17.896 |
0.0000 |
|log-return| |
-40.860 |
1.725 |
-23.683 |
0.0000 |
I(right-tail) |
0.000 |
0.073 |
-0.001 |
0.9989 |
|log-return|*I(right-tail) |
0.147 |
2.432 |
0.061 |
0.9518 |
Hurst exponent (of daily return price)
| 12-day | 24-day | 48-day | 96-day |
| 0.533 |
0.425 |
0.545 |
0.605 |
FSELX
Percentile values of daily loss(gain) in per cent
| 0.5 | 1 | 5 | 10 | 25 | 50 | 75 | 90 | 95 | 99 | 99.5 |
| -0.07 |
-0.06 |
-0.03 |
-0.02 |
-0.01 |
0.00 |
0.01 |
0.03 |
0.05 |
0.06 |
1.04 |
Daily log-return distribution fitting results
| Distribution | Location, a | Scale, b |
| Logistic |
-0.008 |
0.179 |
Linear regression results [Model: y=log(percentile of log-return), x=|log-return|]
| Variable | Coef(b) | s.e.(b) | t-value | P-value |
| Constant |
-0.670 |
0.059 |
-11.307 |
0.0000 |
|log-return| |
-66.658 |
2.759 |
-24.161 |
0.0000 |
I(right-tail) |
0.095 |
0.084 |
1.131 |
0.2585 |
|log-return|*I(right-tail) |
-4.583 |
3.996 |
-1.147 |
0.2516 |
Hurst exponent (of daily return price)
| 12-day | 24-day | 48-day | 96-day |
| 0.549 |
0.460 |
0.590 |
0.604 |

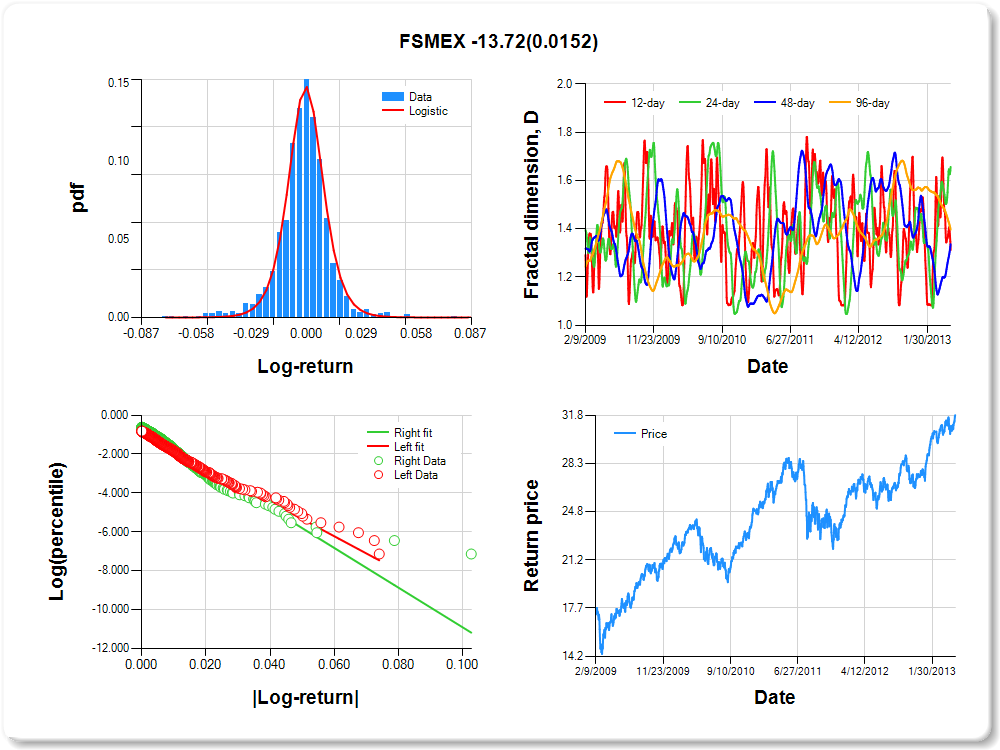
FSMEX
Percentile values of daily loss(gain) in per cent
| 0.5 | 1 | 5 | 10 | 25 | 50 | 75 | 90 | 95 | 99 | 99.5 |
| -0.05 |
-0.04 |
-0.02 |
-0.01 |
-0.01 |
0.00 |
0.01 |
0.02 |
0.04 |
0.05 |
0.29 |
Daily log-return distribution fitting results
| Distribution | Location, a | Scale, b |
| Logistic |
-0.251 |
0.116 |
Linear regression results [Model: y=log(percentile of log-return), x=|log-return|]
| Variable | Coef(b) | s.e.(b) | t-value | P-value |
| Constant |
-0.900 |
0.058 |
-15.486 |
0.0000 |
|log-return| |
-88.298 |
3.863 |
-22.857 |
0.0000 |
I(right-tail) |
0.225 |
0.079 |
2.840 |
0.0046 |
|log-return|*I(right-tail) |
-13.716 |
5.644 |
-2.430 |
0.0152 |
Hurst exponent (of daily return price)
| 12-day | 24-day | 48-day | 96-day |
| 0.688 |
0.343 |
0.664 |
0.603 |
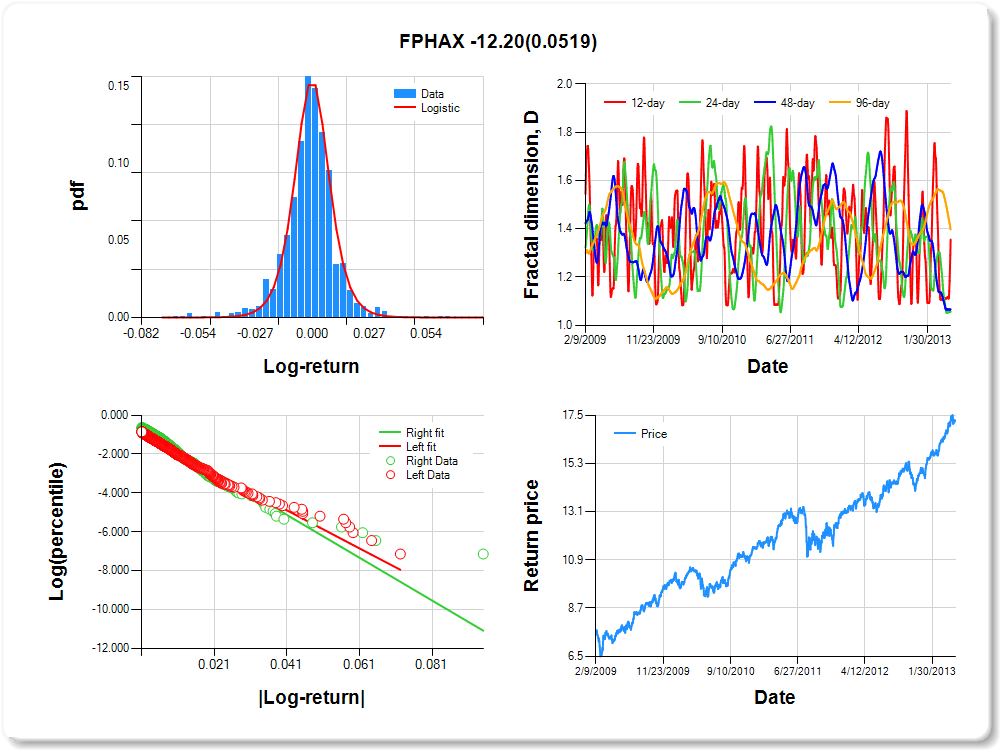
FPHAX
Percentile values of daily loss(gain) in per cent
| 0.5 | 1 | 5 | 10 | 25 | 50 | 75 | 90 | 95 | 99 | 99.5 |
| -0.05 |
-0.04 |
-0.02 |
-0.01 |
-0.01 |
0.00 |
0.01 |
0.02 |
0.03 |
0.04 |
1.27 |
Daily log-return distribution fitting results
| Distribution | Location, a | Scale, b |
| Logistic |
-0.206 |
0.111 |
Linear regression results [Model: y=log(percentile of log-return), x=|log-return|]
| Variable | Coef(b) | s.e.(b) | t-value | P-value |
| Constant |
-0.925 |
0.060 |
-15.504 |
0.0000 |
|log-return| |
-97.829 |
4.372 |
-22.376 |
0.0000 |
I(right-tail) |
0.258 |
0.082 |
3.168 |
0.0016 |
|log-return|*I(right-tail) |
-12.199 |
6.269 |
-1.946 |
0.0519 |
Hurst exponent (of daily return price)
| 12-day | 24-day | 48-day | 96-day |
| 0.645 |
0.943 |
0.934 |
0.603 |
FSDCX
Percentile values of daily loss(gain) in per cent
| 0.5 | 1 | 5 | 10 | 25 | 50 | 75 | 90 | 95 | 99 | 99.5 |
| -0.07 |
-0.05 |
-0.03 |
-0.02 |
-0.01 |
0.00 |
0.01 |
0.03 |
0.05 |
0.06 |
1.13 |
Daily log-return distribution fitting results
| Distribution | Location, a | Scale, b |
| Laplace |
0.011 |
0.243 |
Linear regression results [Model: y=log(percentile of log-return), x=|log-return|]
| Variable | Coef(b) | s.e.(b) | t-value | P-value |
| Constant |
-0.755 |
0.060 |
-12.679 |
0.0000 |
|log-return| |
-69.044 |
2.933 |
-23.537 |
0.0000 |
I(right-tail) |
0.129 |
0.082 |
1.569 |
0.1170 |
|log-return|*I(right-tail) |
-8.277 |
4.260 |
-1.943 |
0.0522 |
Hurst exponent (of daily return price)
| 12-day | 24-day | 48-day | 96-day |
| 0.640 |
0.574 |
0.552 |
0.595 |

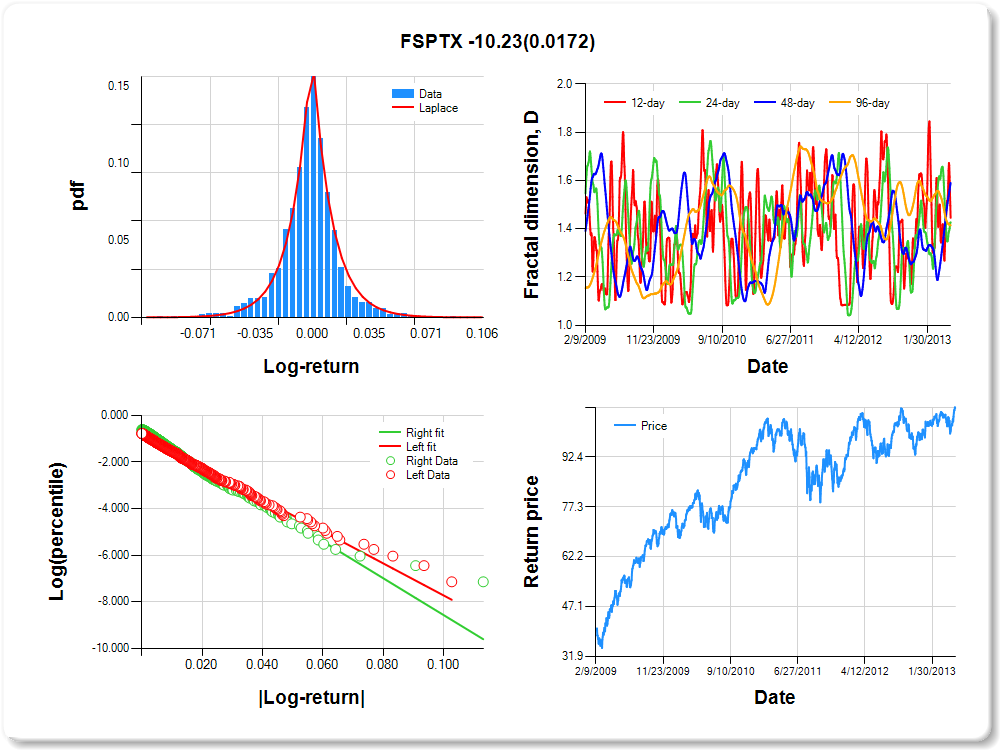
FSPTX
Percentile values of daily loss(gain) in per cent
| 0.5 | 1 | 5 | 10 | 25 | 50 | 75 | 90 | 95 | 99 | 99.5 |
| -0.06 |
-0.05 |
-0.03 |
-0.02 |
-0.01 |
0.00 |
0.01 |
0.03 |
0.05 |
0.06 |
0.78 |
Daily log-return distribution fitting results
| Distribution | Location, a | Scale, b |
| Laplace |
-0.056 |
0.194 |
Linear regression results [Model: y=log(percentile of log-return), x=|log-return|]
| Variable | Coef(b) | s.e.(b) | t-value | P-value |
| Constant |
-0.853 |
0.057 |
-14.862 |
0.0000 |
|log-return| |
-68.646 |
2.936 |
-23.377 |
0.0000 |
I(right-tail) |
0.184 |
0.079 |
2.333 |
0.0198 |
|log-return|*I(right-tail) |
-10.233 |
4.290 |
-2.385 |
0.0172 |
Hurst exponent (of daily return price)
| 12-day | 24-day | 48-day | 96-day |
| 0.554 |
0.573 |
0.410 |
0.586 |
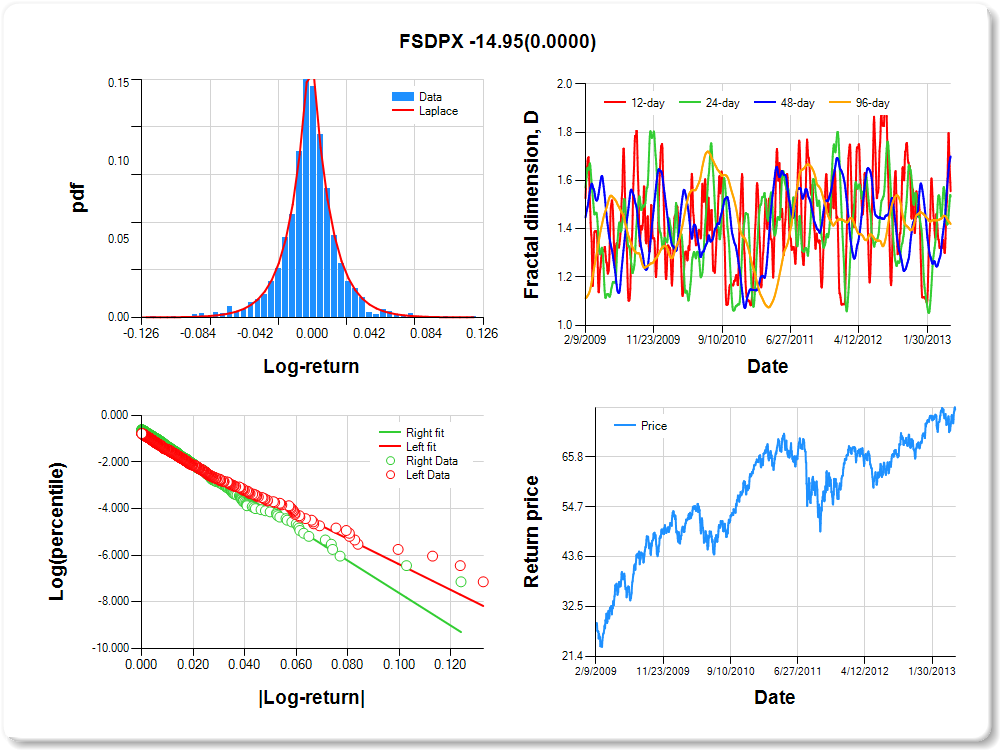
FSDPX
Percentile values of daily loss(gain) in per cent
| 0.5 | 1 | 5 | 10 | 25 | 50 | 75 | 90 | 95 | 99 | 99.5 |
| -0.08 |
-0.06 |
-0.03 |
-0.02 |
-0.01 |
0.00 |
0.01 |
0.03 |
0.06 |
0.07 |
2.17 |
Daily log-return distribution fitting results
| Distribution | Location, a | Scale, b |
| Laplace |
0.072 |
0.187 |
Linear regression results [Model: y=log(percentile of log-return), x=|log-return|]
| Variable | Coef(b) | s.e.(b) | t-value | P-value |
| Constant |
-0.920 |
0.056 |
-16.487 |
0.0000 |
|log-return| |
-54.679 |
2.357 |
-23.201 |
0.0000 |
I(right-tail) |
0.264 |
0.078 |
3.402 |
0.0007 |
|log-return|*I(right-tail) |
-14.948 |
3.625 |
-4.123 |
0.0000 |
Hurst exponent (of daily return price)
| 12-day | 24-day | 48-day | 96-day |
| 0.444 |
0.467 |
0.300 |
0.580 |
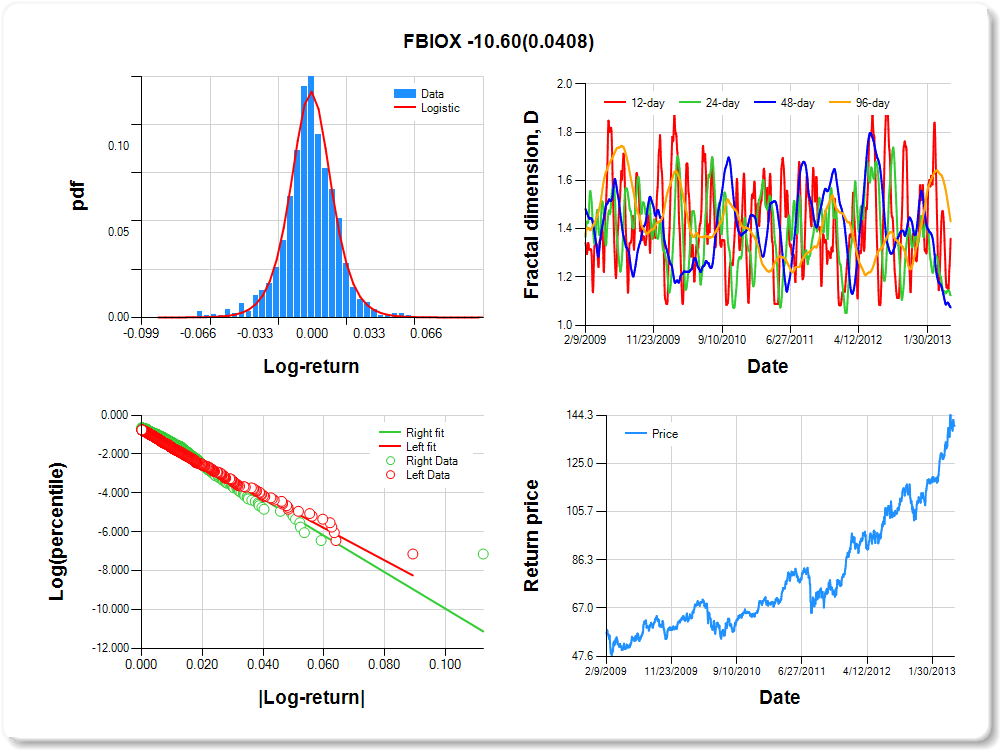
FBIOX
Percentile values of daily loss(gain) in per cent
| 0.5 | 1 | 5 | 10 | 25 | 50 | 75 | 90 | 95 | 99 | 99.5 |
| -0.06 |
-0.05 |
-0.03 |
-0.02 |
-0.01 |
0.00 |
0.01 |
0.02 |
0.04 |
0.05 |
1.28 |
Daily log-return distribution fitting results
| Distribution | Location, a | Scale, b |
| Logistic |
-0.177 |
0.130 |
Linear regression results [Model: y=log(percentile of log-return), x=|log-return|]
| Variable | Coef(b) | s.e.(b) | t-value | P-value |
| Constant |
-0.801 |
0.057 |
-13.980 |
0.0000 |
|log-return| |
-83.303 |
3.510 |
-23.733 |
0.0000 |
I(right-tail) |
0.241 |
0.082 |
2.941 |
0.0033 |
|log-return|*I(right-tail) |
-10.605 |
5.180 |
-2.047 |
0.0408 |
Hurst exponent (of daily return price)
| 12-day | 24-day | 48-day | 96-day |
| 0.641 |
0.875 |
0.926 |
0.569 |
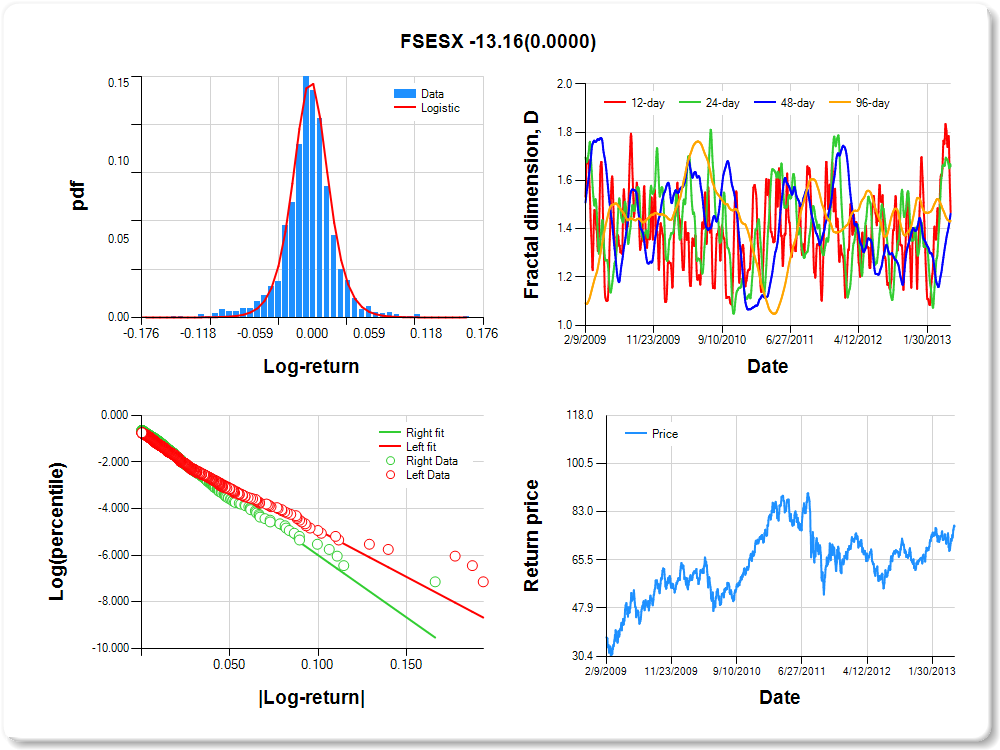
FSESX
Percentile values of daily loss(gain) in per cent
| 0.5 | 1 | 5 | 10 | 25 | 50 | 75 | 90 | 95 | 99 | 99.5 |
| -0.11 |
-0.09 |
-0.04 |
-0.03 |
-0.01 |
0.00 |
0.01 |
0.04 |
0.08 |
0.09 |
0.70 |
Daily log-return distribution fitting results
| Distribution | Location, a | Scale, b |
| Logistic |
0.144 |
0.113 |
Linear regression results [Model: y=log(percentile of log-return), x=|log-return|]
| Variable | Coef(b) | s.e.(b) | t-value | P-value |
| Constant |
-0.921 |
0.054 |
-17.009 |
0.0000 |
|log-return| |
-40.014 |
1.715 |
-23.326 |
0.0000 |
I(right-tail) |
0.243 |
0.077 |
3.145 |
0.0017 |
|log-return|*I(right-tail) |
-13.162 |
2.738 |
-4.807 |
0.0000 |
Hurst exponent (of daily return price)
| 12-day | 24-day | 48-day | 96-day |
| 0.532 |
0.341 |
0.537 |
0.566 |
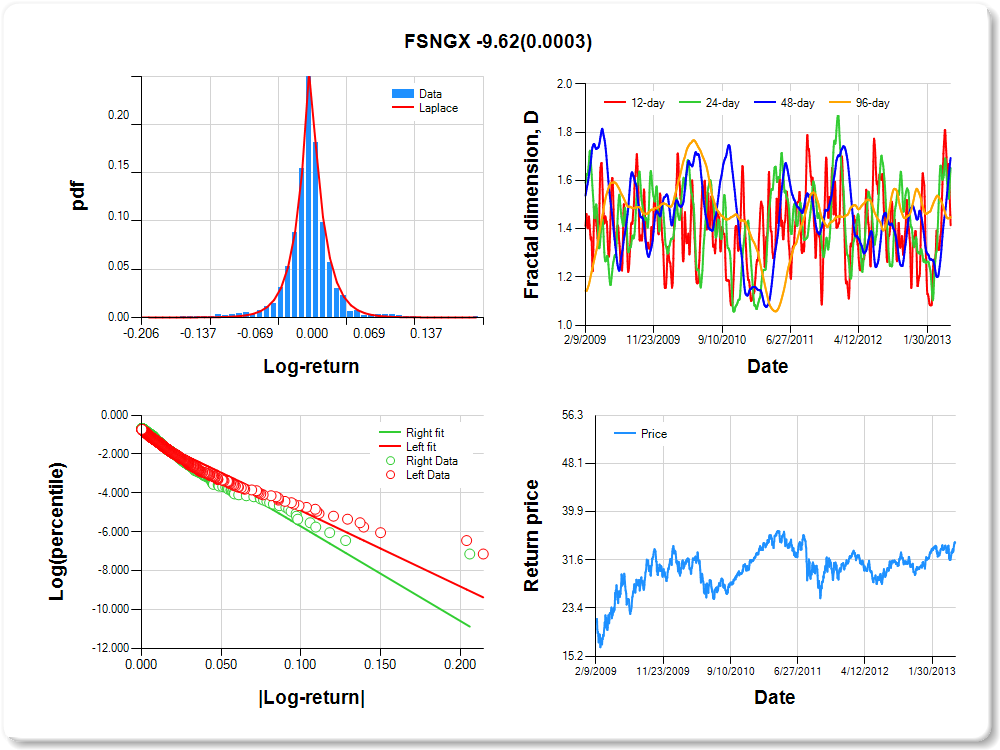
FSNGX
Percentile values of daily loss(gain) in per cent
| 0.5 | 1 | 5 | 10 | 25 | 50 | 75 | 90 | 95 | 99 | 99.5 |
| -0.12 |
-0.09 |
-0.04 |
-0.03 |
-0.01 |
0.00 |
0.01 |
0.04 |
0.08 |
0.10 |
0.81 |
Daily log-return distribution fitting results
| Distribution | Location, a | Scale, b |
| Laplace |
0.045 |
0.130 |
Linear regression results [Model: y=log(percentile of log-return), x=|log-return|]
| Variable | Coef(b) | s.e.(b) | t-value | P-value |
| Constant |
-1.003 |
0.051 |
-19.656 |
0.0000 |
|log-return| |
-38.977 |
1.675 |
-23.277 |
0.0000 |
I(right-tail) |
0.153 |
0.073 |
2.097 |
0.0362 |
|log-return|*I(right-tail) |
-9.621 |
2.622 |
-3.669 |
0.0003 |
Hurst exponent (of daily return price)
| 12-day | 24-day | 48-day | 96-day |
| 0.585 |
0.348 |
0.306 |
0.551 |
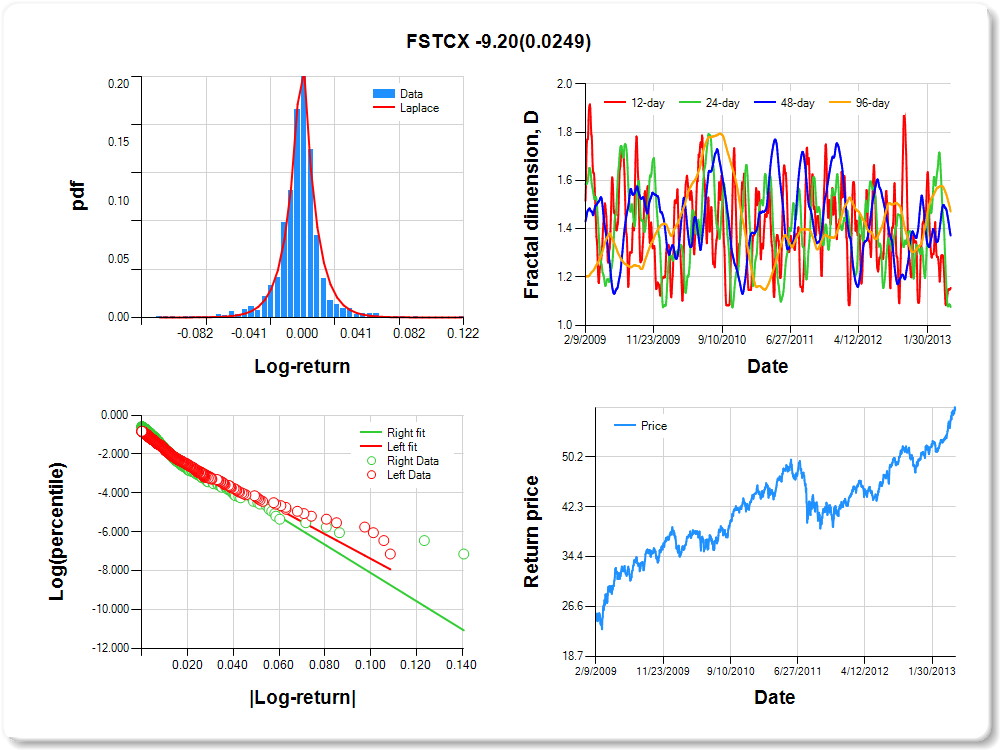
FSTCX
Percentile values of daily loss(gain) in per cent
| 0.5 | 1 | 5 | 10 | 25 | 50 | 75 | 90 | 95 | 99 | 99.5 |
| -0.08 |
-0.06 |
-0.03 |
-0.02 |
-0.01 |
0.00 |
0.01 |
0.02 |
0.05 |
0.06 |
1.31 |
Daily log-return distribution fitting results
| Distribution | Location, a | Scale, b |
| Laplace |
-0.196 |
0.137 |
Linear regression results [Model: y=log(percentile of log-return), x=|log-return|]
| Variable | Coef(b) | s.e.(b) | t-value | P-value |
| Constant |
-1.031 |
0.055 |
-18.640 |
0.0000 |
|log-return| |
-63.426 |
2.832 |
-22.394 |
0.0000 |
I(right-tail) |
0.192 |
0.074 |
2.611 |
0.0091 |
|log-return|*I(right-tail) |
-9.198 |
4.096 |
-2.246 |
0.0249 |
Hurst exponent (of daily return price)
| 12-day | 24-day | 48-day | 96-day |
| 0.845 |
0.924 |
0.628 |
0.528 |
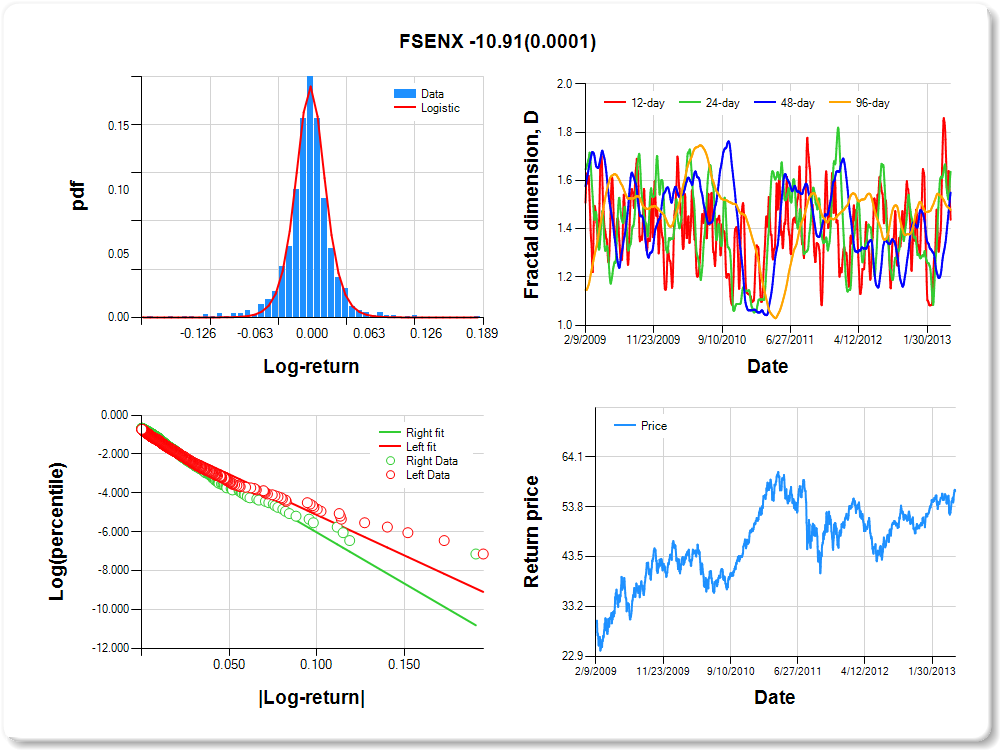
FSENX
Percentile values of daily loss(gain) in per cent
| 0.5 | 1 | 5 | 10 | 25 | 50 | 75 | 90 | 95 | 99 | 99.5 |
| -0.11 |
-0.09 |
-0.04 |
-0.03 |
-0.01 |
0.00 |
0.01 |
0.04 |
0.08 |
0.09 |
1.53 |
Daily log-return distribution fitting results
| Distribution | Location, a | Scale, b |
| Logistic |
0.032 |
0.094 |
Linear regression results [Model: y=log(percentile of log-return), x=|log-return|]
| Variable | Coef(b) | s.e.(b) | t-value | P-value |
| Constant |
-0.955 |
0.052 |
-18.407 |
0.0000 |
|log-return| |
-41.693 |
1.771 |
-23.537 |
0.0000 |
I(right-tail) |
0.190 |
0.075 |
2.535 |
0.0114 |
|log-return|*I(right-tail) |
-10.906 |
2.794 |
-3.903 |
0.0001 |
Hurst exponent (of daily return price)
| 12-day | 24-day | 48-day | 96-day |
| 0.562 |
0.363 |
0.450 |
0.522 |
FSHCX
Percentile values of daily loss(gain) in per cent
| 0.5 | 1 | 5 | 10 | 25 | 50 | 75 | 90 | 95 | 99 | 99.5 |
| -0.07 |
-0.06 |
-0.02 |
-0.02 |
-0.01 |
0.00 |
0.01 |
0.02 |
0.04 |
0.05 |
1.54 |
Daily log-return distribution fitting results
| Distribution | Location, a | Scale, b |
| Logistic |
-0.340 |
0.113 |
Linear regression results [Model: y=log(percentile of log-return), x=|log-return|]
| Variable | Coef(b) | s.e.(b) | t-value | P-value |
| Constant |
-0.923 |
0.056 |
-16.400 |
0.0000 |
|log-return| |
-70.803 |
3.096 |
-22.867 |
0.0000 |
I(right-tail) |
0.268 |
0.079 |
3.410 |
0.0007 |
|log-return|*I(right-tail) |
-15.666 |
4.674 |
-3.352 |
0.0008 |
Hurst exponent (of daily return price)
| 12-day | 24-day | 48-day | 96-day |
| 0.586 |
0.440 |
0.644 |
0.512 |

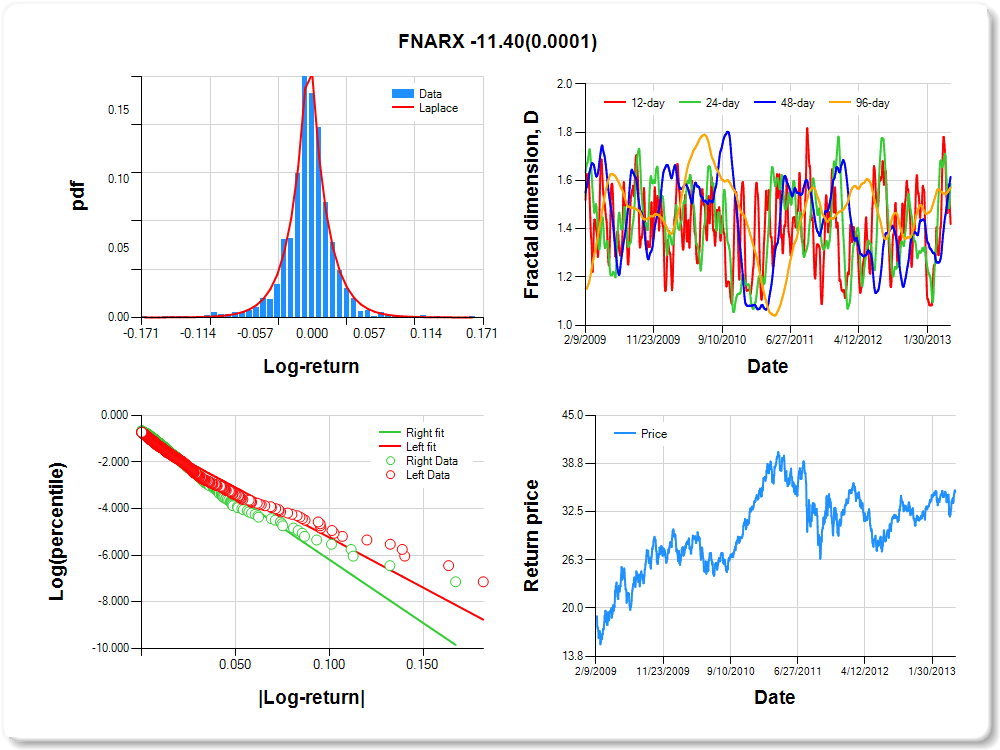
FNARX
Percentile values of daily loss(gain) in per cent
| 0.5 | 1 | 5 | 10 | 25 | 50 | 75 | 90 | 95 | 99 | 99.5 |
| -0.11 |
-0.09 |
-0.04 |
-0.03 |
-0.01 |
0.00 |
0.01 |
0.04 |
0.07 |
0.09 |
0.91 |
Daily log-return distribution fitting results
| Distribution | Location, a | Scale, b |
| Laplace |
0.074 |
0.164 |
Linear regression results [Model: y=log(percentile of log-return), x=|log-return|]
| Variable | Coef(b) | s.e.(b) | t-value | P-value |
| Constant |
-0.945 |
0.052 |
-18.045 |
0.0000 |
|log-return| |
-42.877 |
1.823 |
-23.520 |
0.0000 |
I(right-tail) |
0.196 |
0.076 |
2.584 |
0.0099 |
|log-return|*I(right-tail) |
-11.396 |
2.881 |
-3.955 |
0.0001 |
Hurst exponent (of daily return price)
| 12-day | 24-day | 48-day | 96-day |
| 0.580 |
0.414 |
0.384 |
0.429 |