FSAIX
Percentile values of daily loss(gain) in per cent
| 0.5 | 1 | 5 | 10 | 25 | 50 | 75 | 90 | 95 | 99 | 99.5 |
| -0.05 |
-0.05 |
-0.02 |
-0.01 |
-0.01 |
0.00 |
0.01 |
0.02 |
0.04 |
0.04 |
0.00 |
Daily log-return distribution fitting results
| Distribution | Location, a | Scale, b |
| Laplace |
-0.190 |
0.233 |
Linear regression results [Model: y=log(percentile of log-return), x=|log-return|]
| Variable | Coef(b) | s.e.(b) | t-value | P-value |
| Constant |
-0.868 |
0.093 |
-9.360 |
0.0000 |
|log-return| |
-93.090 |
6.523 |
-14.271 |
0.0000 |
I(right-tail) |
0.232 |
0.127 |
1.828 |
0.0681 |
|log-return|*I(right-tail) |
-8.771 |
9.249 |
-0.948 |
0.3434 |
Hurst exponent (of daily return price)
| 12-day | 24-day | 48-day | 96-day |
| 0.421 |
0.263 |
0.714 |
0.905 |

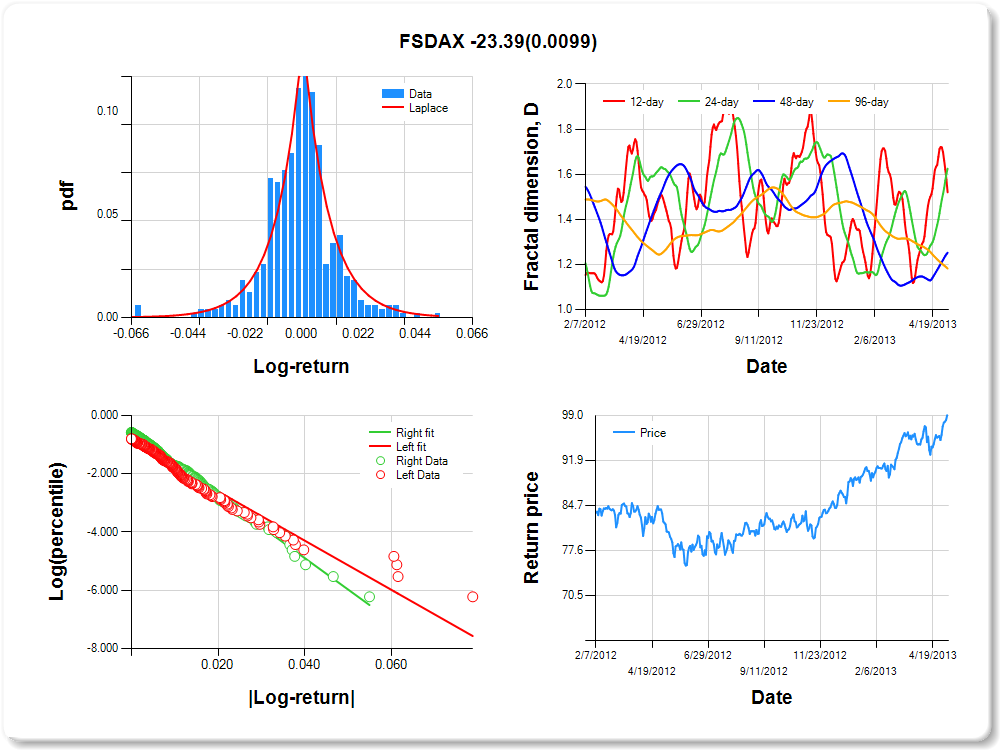
FSDAX
Percentile values of daily loss(gain) in per cent
| 0.5 | 1 | 5 | 10 | 25 | 50 | 75 | 90 | 95 | 99 | 99.5 |
| -0.06 |
-0.04 |
-0.02 |
-0.01 |
-0.01 |
0.00 |
0.01 |
0.02 |
0.04 |
0.04 |
2.41 |
Daily log-return distribution fitting results
| Distribution | Location, a | Scale, b |
| Laplace |
0.347 |
0.254 |
Linear regression results [Model: y=log(percentile of log-return), x=|log-return|]
| Variable | Coef(b) | s.e.(b) | t-value | P-value |
| Constant |
-0.916 |
0.092 |
-9.998 |
0.0000 |
|log-return| |
-84.560 |
6.041 |
-13.999 |
0.0000 |
I(right-tail) |
0.337 |
0.126 |
2.682 |
0.0076 |
|log-return|*I(right-tail) |
-23.387 |
9.033 |
-2.589 |
0.0099 |
Hurst exponent (of daily return price)
| 12-day | 24-day | 48-day | 96-day |
| 0.480 |
0.375 |
0.748 |
0.818 |
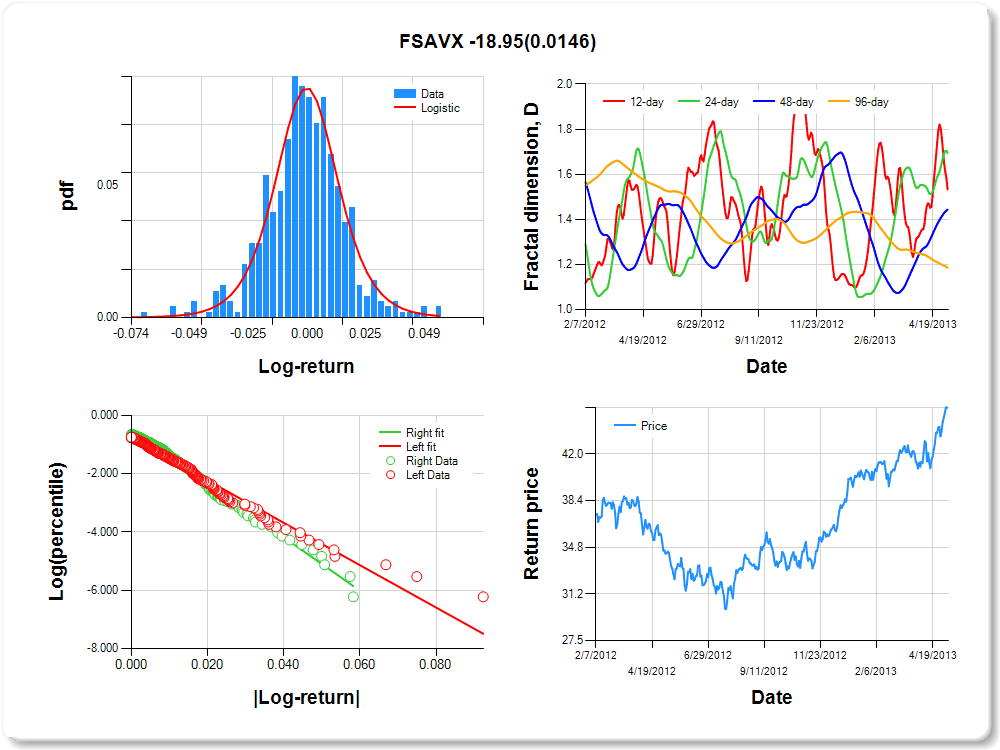
FSAVX
Percentile values of daily loss(gain) in per cent
| 0.5 | 1 | 5 | 10 | 25 | 50 | 75 | 90 | 95 | 99 | 99.5 |
| -0.06 |
-0.05 |
-0.03 |
-0.02 |
-0.01 |
0.00 |
0.01 |
0.03 |
0.05 |
0.05 |
1.38 |
Daily log-return distribution fitting results
| Distribution | Location, a | Scale, b |
| Logistic |
0.416 |
0.198 |
Linear regression results [Model: y=log(percentile of log-return), x=|log-return|]
| Variable | Coef(b) | s.e.(b) | t-value | P-value |
| Constant |
-0.767 |
0.093 |
-8.256 |
0.0000 |
|log-return| |
-72.639 |
4.967 |
-14.623 |
0.0000 |
I(right-tail) |
0.265 |
0.134 |
1.980 |
0.0482 |
|log-return|*I(right-tail) |
-18.946 |
7.732 |
-2.450 |
0.0146 |
Hurst exponent (of daily return price)
| 12-day | 24-day | 48-day | 96-day |
| 0.467 |
0.306 |
0.557 |
0.815 |
FSLBX
Percentile values of daily loss(gain) in per cent
| 0.5 | 1 | 5 | 10 | 25 | 50 | 75 | 90 | 95 | 99 | 99.5 |
| -0.06 |
-0.06 |
-0.03 |
-0.02 |
-0.01 |
0.00 |
0.01 |
0.03 |
0.05 |
0.06 |
3.51 |
Daily log-return distribution fitting results
| Distribution | Location, a | Scale, b |
| Laplace |
0.092 |
0.212 |
Linear regression results [Model: y=log(percentile of log-return), x=|log-return|]
| Variable | Coef(b) | s.e.(b) | t-value | P-value |
| Constant |
-0.916 |
0.089 |
-10.252 |
0.0000 |
|log-return| |
-66.780 |
4.662 |
-14.325 |
0.0000 |
I(right-tail) |
0.188 |
0.122 |
1.541 |
0.1240 |
|log-return|*I(right-tail) |
-8.413 |
6.706 |
-1.254 |
0.2103 |
Hurst exponent (of daily return price)
| 12-day | 24-day | 48-day | 96-day |
| 0.409 |
0.378 |
0.525 |
0.806 |

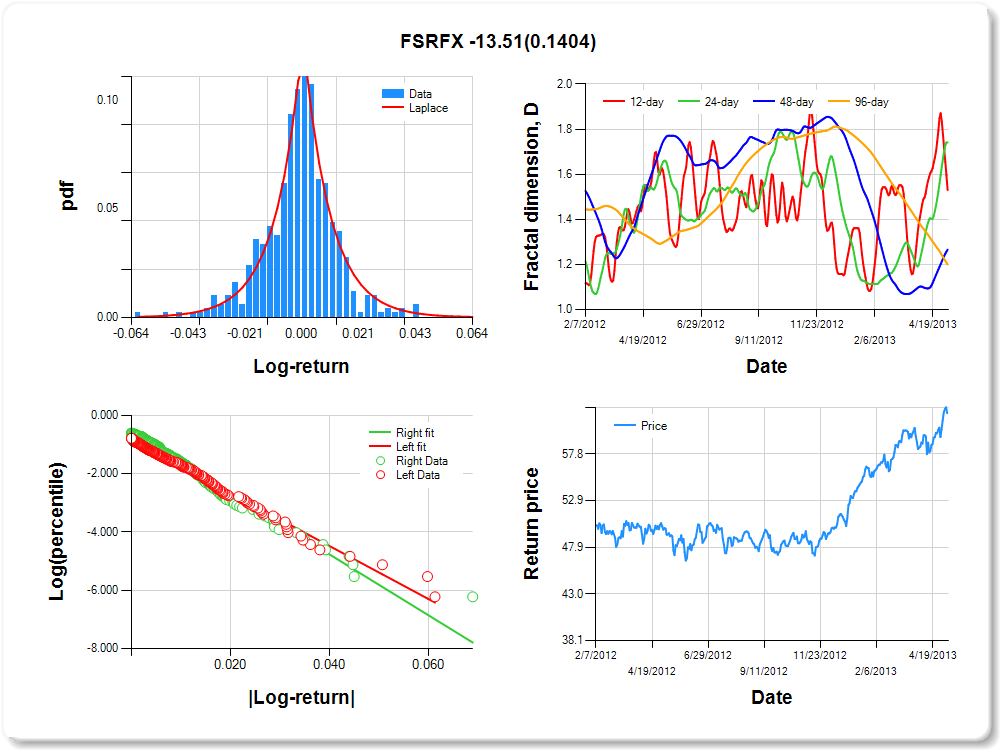
FSRFX
Percentile values of daily loss(gain) in per cent
| 0.5 | 1 | 5 | 10 | 25 | 50 | 75 | 90 | 95 | 99 | 99.5 |
| -0.05 |
-0.04 |
-0.02 |
-0.02 |
-0.01 |
0.00 |
0.01 |
0.02 |
0.04 |
0.05 |
2.16 |
Daily log-return distribution fitting results
| Distribution | Location, a | Scale, b |
| Laplace |
-0.057 |
0.266 |
Linear regression results [Model: y=log(percentile of log-return), x=|log-return|]
| Variable | Coef(b) | s.e.(b) | t-value | P-value |
| Constant |
-0.828 |
0.093 |
-8.886 |
0.0000 |
|log-return| |
-90.995 |
6.311 |
-14.419 |
0.0000 |
I(right-tail) |
0.256 |
0.129 |
1.986 |
0.0476 |
|log-return|*I(right-tail) |
-13.515 |
9.152 |
-1.477 |
0.1404 |
Hurst exponent (of daily return price)
| 12-day | 24-day | 48-day | 96-day |
| 0.470 |
0.259 |
0.734 |
0.800 |
FSHOX
Percentile values of daily loss(gain) in per cent
| 0.5 | 1 | 5 | 10 | 25 | 50 | 75 | 90 | 95 | 99 | 99.5 |
| -0.05 |
-0.04 |
-0.03 |
-0.01 |
-0.01 |
0.00 |
0.01 |
0.02 |
0.04 |
0.04 |
1.58 |
Daily log-return distribution fitting results
| Distribution | Location, a | Scale, b |
| Logistic |
0.376 |
0.178 |
Linear regression results [Model: y=log(percentile of log-return), x=|log-return|]
| Variable | Coef(b) | s.e.(b) | t-value | P-value |
| Constant |
-0.865 |
0.090 |
-9.606 |
0.0000 |
|log-return| |
-83.577 |
5.776 |
-14.471 |
0.0000 |
I(right-tail) |
0.387 |
0.131 |
2.953 |
0.0033 |
|log-return|*I(right-tail) |
-19.821 |
8.764 |
-2.262 |
0.0242 |
Hurst exponent (of daily return price)
| 12-day | 24-day | 48-day | 96-day |
| 0.459 |
0.361 |
0.425 |
0.796 |

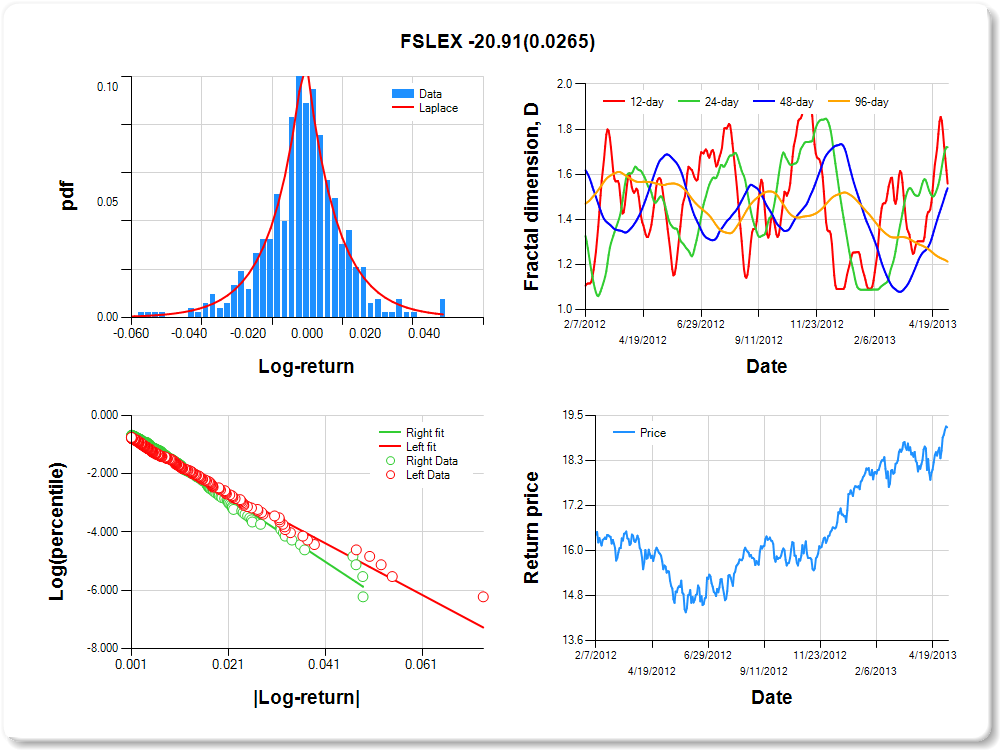
FSLEX
Percentile values of daily loss(gain) in per cent
| 0.5 | 1 | 5 | 10 | 25 | 50 | 75 | 90 | 95 | 99 | 99.5 |
| -0.05 |
-0.05 |
-0.02 |
-0.02 |
-0.01 |
0.00 |
0.01 |
0.02 |
0.04 |
0.05 |
3.44 |
Daily log-return distribution fitting results
| Distribution | Location, a | Scale, b |
| Laplace |
0.360 |
0.294 |
Linear regression results [Model: y=log(percentile of log-return), x=|log-return|]
| Variable | Coef(b) | s.e.(b) | t-value | P-value |
| Constant |
-0.799 |
0.092 |
-8.701 |
0.0000 |
|log-return| |
-88.618 |
6.060 |
-14.623 |
0.0000 |
I(right-tail) |
0.213 |
0.132 |
1.611 |
0.1078 |
|log-return|*I(right-tail) |
-20.912 |
9.398 |
-2.225 |
0.0265 |
Hurst exponent (of daily return price)
| 12-day | 24-day | 48-day | 96-day |
| 0.442 |
0.280 |
0.461 |
0.787 |
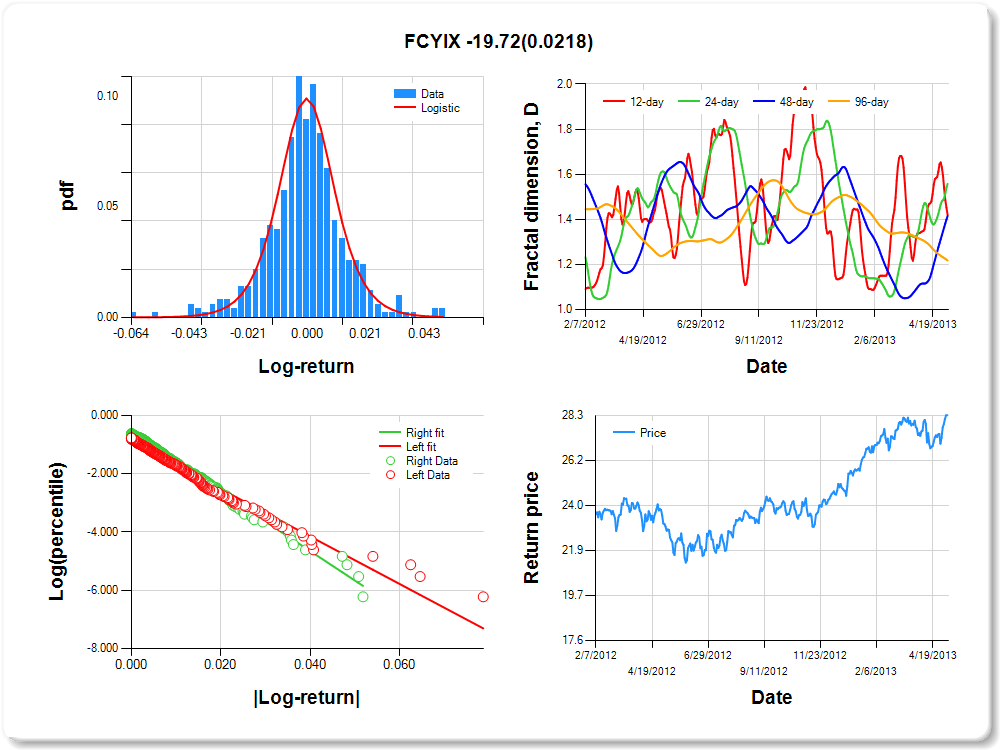
FCYIX
Percentile values of daily loss(gain) in per cent
| 0.5 | 1 | 5 | 10 | 25 | 50 | 75 | 90 | 95 | 99 | 99.5 |
| -0.06 |
-0.04 |
-0.02 |
-0.02 |
-0.01 |
0.00 |
0.01 |
0.02 |
0.04 |
0.05 |
3.17 |
Daily log-return distribution fitting results
| Distribution | Location, a | Scale, b |
| Logistic |
0.380 |
0.174 |
Linear regression results [Model: y=log(percentile of log-return), x=|log-return|]
| Variable | Coef(b) | s.e.(b) | t-value | P-value |
| Constant |
-0.874 |
0.090 |
-9.688 |
0.0000 |
|log-return| |
-81.527 |
5.659 |
-14.407 |
0.0000 |
I(right-tail) |
0.295 |
0.127 |
2.319 |
0.0208 |
|log-return|*I(right-tail) |
-19.725 |
8.573 |
-2.301 |
0.0218 |
Hurst exponent (of daily return price)
| 12-day | 24-day | 48-day | 96-day |
| 0.580 |
0.442 |
0.585 |
0.783 |
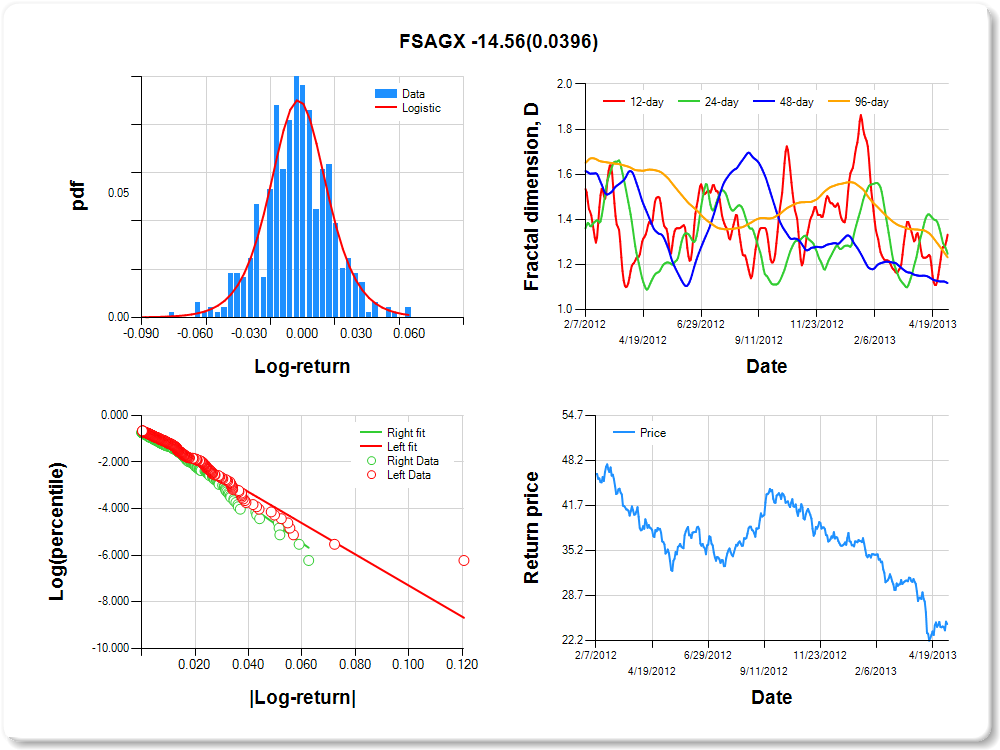
FSAGX
Percentile values of daily loss(gain) in per cent
| 0.5 | 1 | 5 | 10 | 25 | 50 | 75 | 90 | 95 | 99 | 99.5 |
| -0.06 |
-0.05 |
-0.03 |
-0.02 |
-0.01 |
0.00 |
0.01 |
0.03 |
0.05 |
0.05 |
2.23 |
Daily log-return distribution fitting results
| Distribution | Location, a | Scale, b |
| Logistic |
0.531 |
0.197 |
Linear regression results [Model: y=log(percentile of log-return), x=|log-return|]
| Variable | Coef(b) | s.e.(b) | t-value | P-value |
| Constant |
-0.610 |
0.093 |
-6.556 |
0.0000 |
|log-return| |
-66.830 |
4.420 |
-15.119 |
0.0000 |
I(right-tail) |
0.028 |
0.137 |
0.204 |
0.8385 |
|log-return|*I(right-tail) |
-14.559 |
7.058 |
-2.063 |
0.0396 |
Hurst exponent (of daily return price)
| 12-day | 24-day | 48-day | 96-day |
| 0.668 |
0.753 |
0.882 |
0.768 |
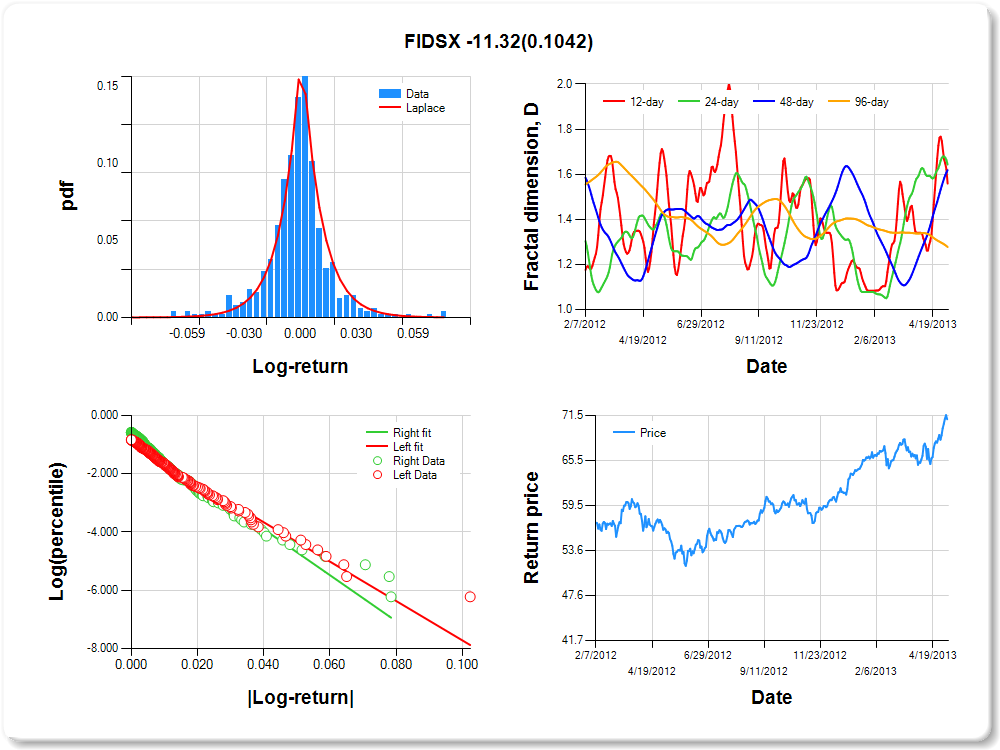
FIDSX
Percentile values of daily loss(gain) in per cent
| 0.5 | 1 | 5 | 10 | 25 | 50 | 75 | 90 | 95 | 99 | 99.5 |
| -0.06 |
-0.05 |
-0.03 |
-0.02 |
-0.01 |
0.00 |
0.01 |
0.03 |
0.05 |
0.06 |
4.50 |
Daily log-return distribution fitting results
| Distribution | Location, a | Scale, b |
| Laplace |
0.268 |
0.193 |
Linear regression results [Model: y=log(percentile of log-return), x=|log-return|]
| Variable | Coef(b) | s.e.(b) | t-value | P-value |
| Constant |
-0.959 |
0.092 |
-10.420 |
0.0000 |
|log-return| |
-67.552 |
4.856 |
-13.910 |
0.0000 |
I(right-tail) |
0.214 |
0.121 |
1.765 |
0.0782 |
|log-return|*I(right-tail) |
-11.315 |
6.950 |
-1.628 |
0.1042 |
Hurst exponent (of daily return price)
| 12-day | 24-day | 48-day | 96-day |
| 0.441 |
0.356 |
0.382 |
0.723 |
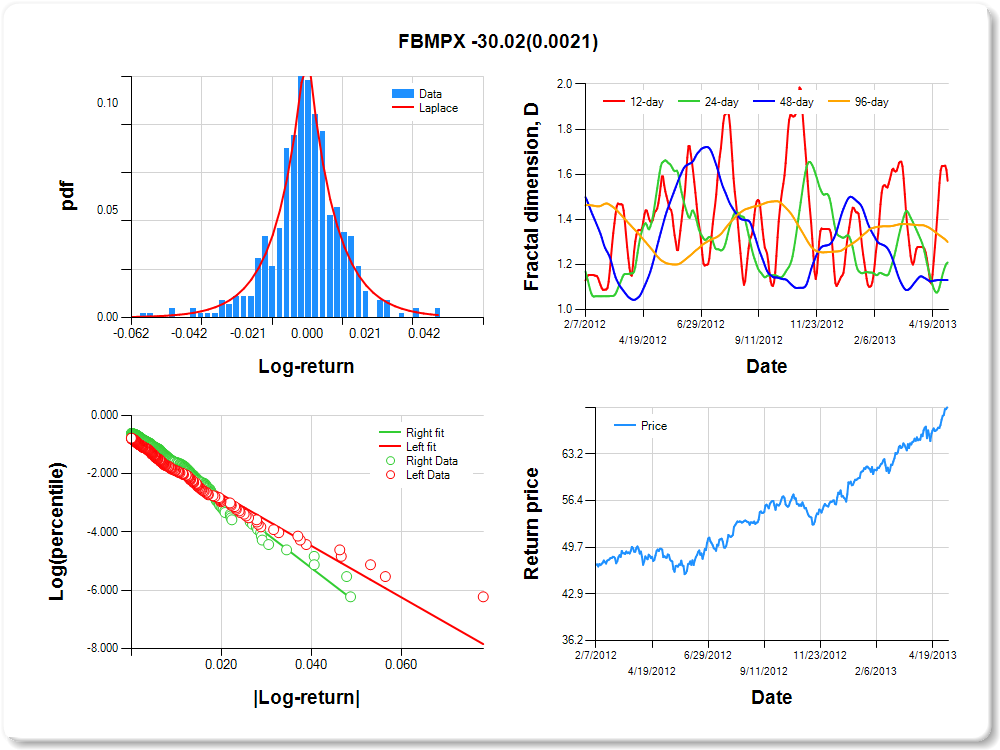
FBMPX
Percentile values of daily loss(gain) in per cent
| 0.5 | 1 | 5 | 10 | 25 | 50 | 75 | 90 | 95 | 99 | 99.5 |
| -0.05 |
-0.05 |
-0.02 |
-0.01 |
-0.01 |
0.00 |
0.01 |
0.02 |
0.03 |
0.04 |
0.86 |
Daily log-return distribution fitting results
| Distribution | Location, a | Scale, b |
| Laplace |
0.424 |
0.263 |
Linear regression results [Model: y=log(percentile of log-return), x=|log-return|]
| Variable | Coef(b) | s.e.(b) | t-value | P-value |
| Constant |
-0.937 |
0.088 |
-10.632 |
0.0000 |
|log-return| |
-88.263 |
6.185 |
-14.271 |
0.0000 |
I(right-tail) |
0.446 |
0.128 |
3.474 |
0.0006 |
|log-return|*I(right-tail) |
-30.018 |
9.726 |
-3.086 |
0.0021 |
Hurst exponent (of daily return price)
| 12-day | 24-day | 48-day | 96-day |
| 0.429 |
0.791 |
0.869 |
0.700 |
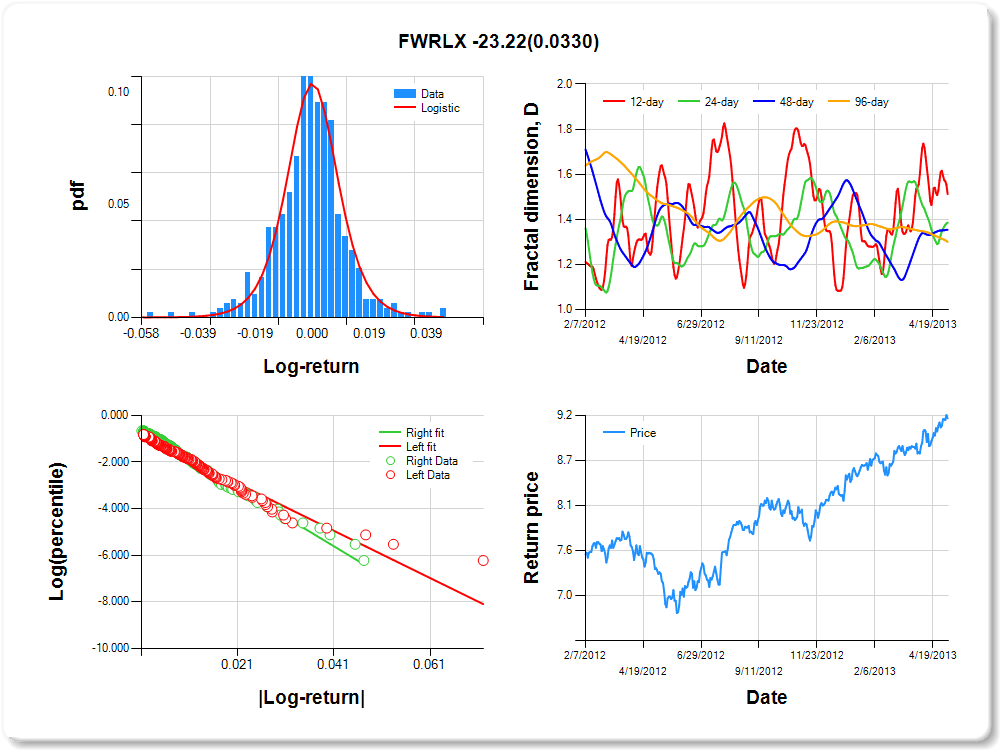
FWRLX
Percentile values of daily loss(gain) in per cent
| 0.5 | 1 | 5 | 10 | 25 | 50 | 75 | 90 | 95 | 99 | 99.5 |
| -0.05 |
-0.03 |
-0.02 |
-0.01 |
-0.01 |
0.00 |
0.01 |
0.02 |
0.03 |
0.04 |
1.90 |
Daily log-return distribution fitting results
| Distribution | Location, a | Scale, b |
| Logistic |
0.393 |
0.165 |
Linear regression results [Model: y=log(percentile of log-return), x=|log-return|]
| Variable | Coef(b) | s.e.(b) | t-value | P-value |
| Constant |
-0.839 |
0.097 |
-8.658 |
0.0000 |
|log-return| |
-101.121 |
7.252 |
-13.944 |
0.0000 |
I(right-tail) |
0.283 |
0.135 |
2.087 |
0.0374 |
|log-return|*I(right-tail) |
-23.221 |
10.858 |
-2.139 |
0.0330 |
Hurst exponent (of daily return price)
| 12-day | 24-day | 48-day | 96-day |
| 0.488 |
0.615 |
0.646 |
0.700 |
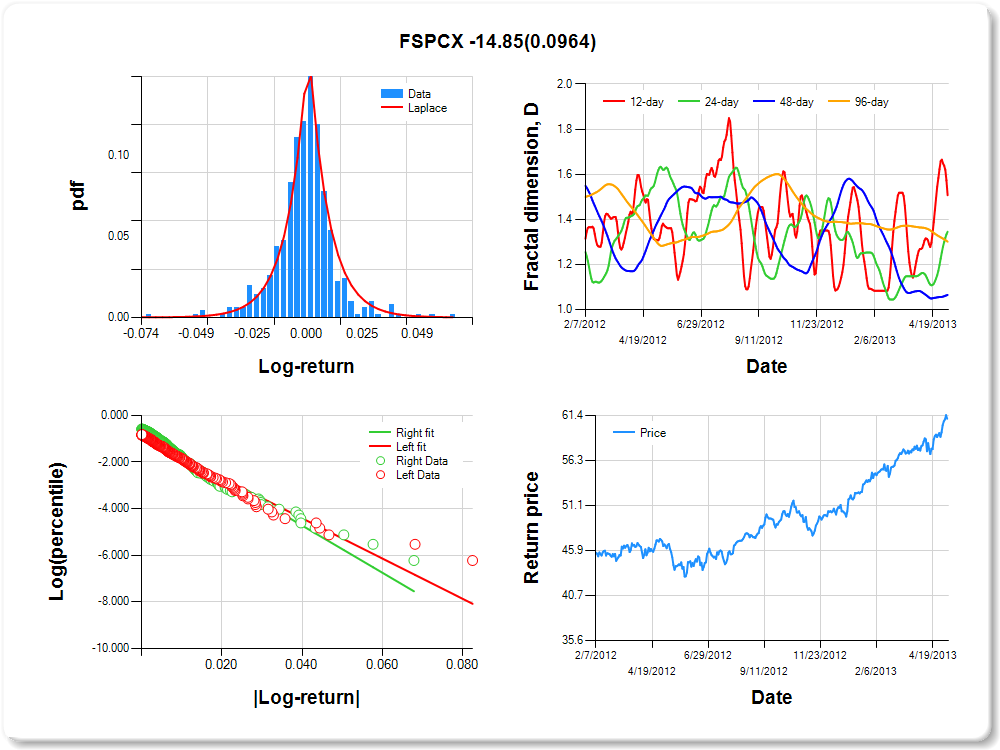
FSPCX
Percentile values of daily loss(gain) in per cent
| 0.5 | 1 | 5 | 10 | 25 | 50 | 75 | 90 | 95 | 99 | 99.5 |
| -0.05 |
-0.04 |
-0.02 |
-0.01 |
-0.01 |
0.00 |
0.01 |
0.02 |
0.04 |
0.04 |
2.67 |
Daily log-return distribution fitting results
| Distribution | Location, a | Scale, b |
| Laplace |
0.214 |
0.203 |
Linear regression results [Model: y=log(percentile of log-return), x=|log-return|]
| Variable | Coef(b) | s.e.(b) | t-value | P-value |
| Constant |
-0.956 |
0.091 |
-10.481 |
0.0000 |
|log-return| |
-86.197 |
6.208 |
-13.885 |
0.0000 |
I(right-tail) |
0.285 |
0.123 |
2.309 |
0.0213 |
|log-return|*I(right-tail) |
-14.851 |
8.915 |
-1.666 |
0.0964 |
Hurst exponent (of daily return price)
| 12-day | 24-day | 48-day | 96-day |
| 0.493 |
0.655 |
0.935 |
0.699 |
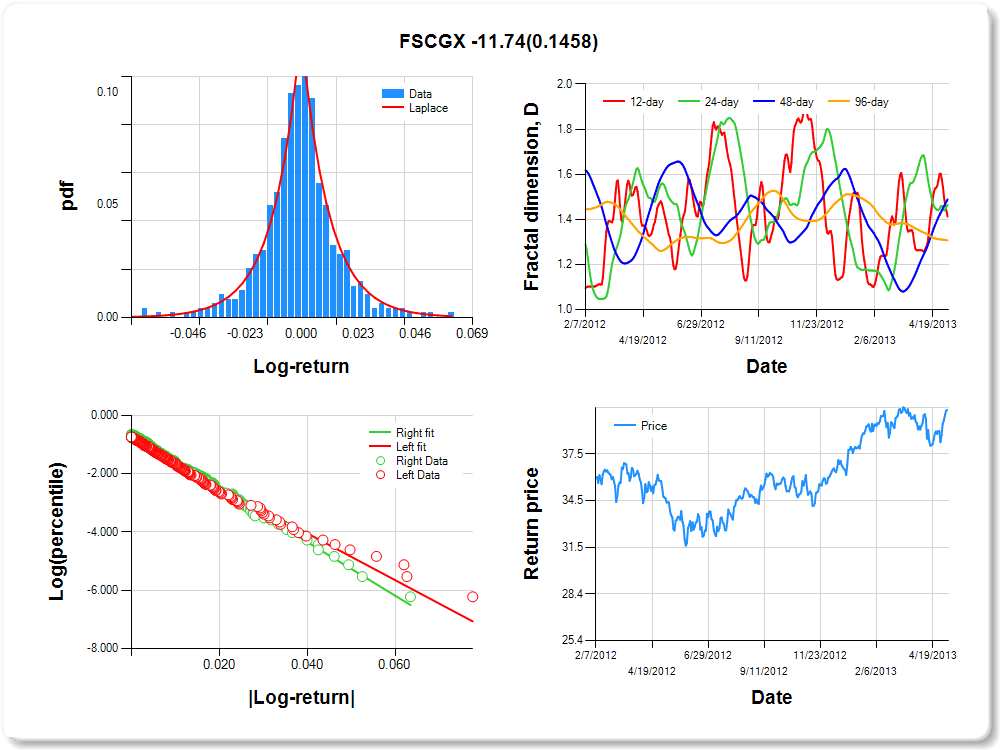
FSCGX
Percentile values of daily loss(gain) in per cent
| 0.5 | 1 | 5 | 10 | 25 | 50 | 75 | 90 | 95 | 99 | 99.5 |
| -0.06 |
-0.05 |
-0.02 |
-0.02 |
-0.01 |
0.00 |
0.01 |
0.03 |
0.04 |
0.05 |
3.75 |
Daily log-return distribution fitting results
| Distribution | Location, a | Scale, b |
| Laplace |
0.196 |
0.271 |
Linear regression results [Model: y=log(percentile of log-return), x=|log-return|]
| Variable | Coef(b) | s.e.(b) | t-value | P-value |
| Constant |
-0.823 |
0.089 |
-9.222 |
0.0000 |
|log-return| |
-80.246 |
5.450 |
-14.723 |
0.0000 |
I(right-tail) |
0.175 |
0.126 |
1.383 |
0.1672 |
|log-return|*I(right-tail) |
-11.740 |
8.060 |
-1.457 |
0.1458 |
Hurst exponent (of daily return price)
| 12-day | 24-day | 48-day | 96-day |
| 0.587 |
0.536 |
0.512 |
0.693 |
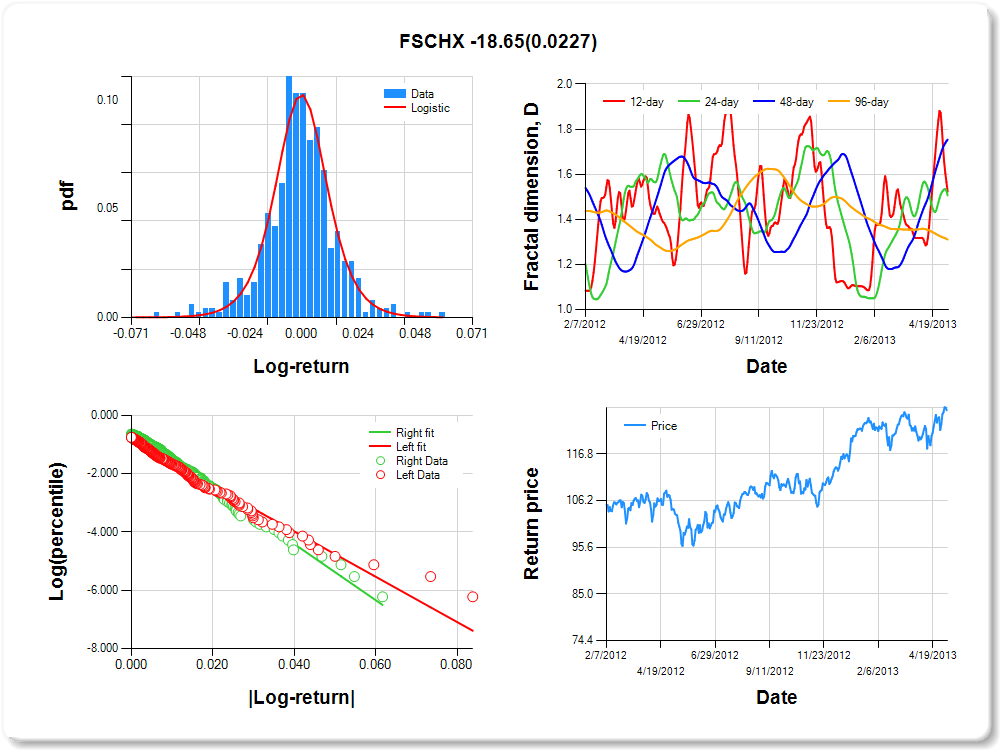
FSCHX
Percentile values of daily loss(gain) in per cent
| 0.5 | 1 | 5 | 10 | 25 | 50 | 75 | 90 | 95 | 99 | 99.5 |
| -0.06 |
-0.04 |
-0.03 |
-0.02 |
-0.01 |
0.00 |
0.01 |
0.02 |
0.04 |
0.05 |
1.90 |
Daily log-return distribution fitting results
| Distribution | Location, a | Scale, b |
| Logistic |
0.288 |
0.167 |
Linear regression results [Model: y=log(percentile of log-return), x=|log-return|]
| Variable | Coef(b) | s.e.(b) | t-value | P-value |
| Constant |
-0.873 |
0.088 |
-9.890 |
0.0000 |
|log-return| |
-77.705 |
5.331 |
-14.576 |
0.0000 |
I(right-tail) |
0.317 |
0.128 |
2.478 |
0.0136 |
|log-return|*I(right-tail) |
-18.653 |
8.160 |
-2.286 |
0.0227 |
Hurst exponent (of daily return price)
| 12-day | 24-day | 48-day | 96-day |
| 0.477 |
0.493 |
0.246 |
0.689 |
FDFAX
Percentile values of daily loss(gain) in per cent
| 0.5 | 1 | 5 | 10 | 25 | 50 | 75 | 90 | 95 | 99 | 99.5 |
| -0.04 |
-0.02 |
-0.01 |
-0.01 |
0.00 |
0.00 |
0.01 |
0.01 |
0.02 |
0.03 |
1.37 |
Daily log-return distribution fitting results
| Distribution | Location, a | Scale, b |
| Logistic |
0.340 |
0.170 |
Linear regression results [Model: y=log(percentile of log-return), x=|log-return|]
| Variable | Coef(b) | s.e.(b) | t-value | P-value |
| Constant |
-0.929 |
0.096 |
-9.672 |
0.0000 |
|log-return| |
-142.470 |
10.437 |
-13.651 |
0.0000 |
I(right-tail) |
0.421 |
0.130 |
3.244 |
0.0013 |
|log-return|*I(right-tail) |
-29.273 |
14.846 |
-1.972 |
0.0492 |
Hurst exponent (of daily return price)
| 12-day | 24-day | 48-day | 96-day |
| 0.788 |
0.919 |
0.958 |
0.686 |

FDLSX
Percentile values of daily loss(gain) in per cent
| 0.5 | 1 | 5 | 10 | 25 | 50 | 75 | 90 | 95 | 99 | 99.5 |
| -0.05 |
-0.04 |
-0.02 |
-0.01 |
0.00 |
0.00 |
0.01 |
0.02 |
0.04 |
0.04 |
2.13 |
Daily log-return distribution fitting results
| Distribution | Location, a | Scale, b |
| Laplace |
0.233 |
0.259 |
Linear regression results [Model: y=log(percentile of log-return), x=|log-return|]
| Variable | Coef(b) | s.e.(b) | t-value | P-value |
| Constant |
-0.918 |
0.087 |
-10.568 |
0.0000 |
|log-return| |
-88.546 |
6.097 |
-14.523 |
0.0000 |
I(right-tail) |
0.307 |
0.125 |
2.463 |
0.0141 |
|log-return|*I(right-tail) |
-15.293 |
9.034 |
-1.693 |
0.0911 |
Hurst exponent (of daily return price)
| 12-day | 24-day | 48-day | 96-day |
| 0.419 |
0.657 |
0.817 |
0.680 |

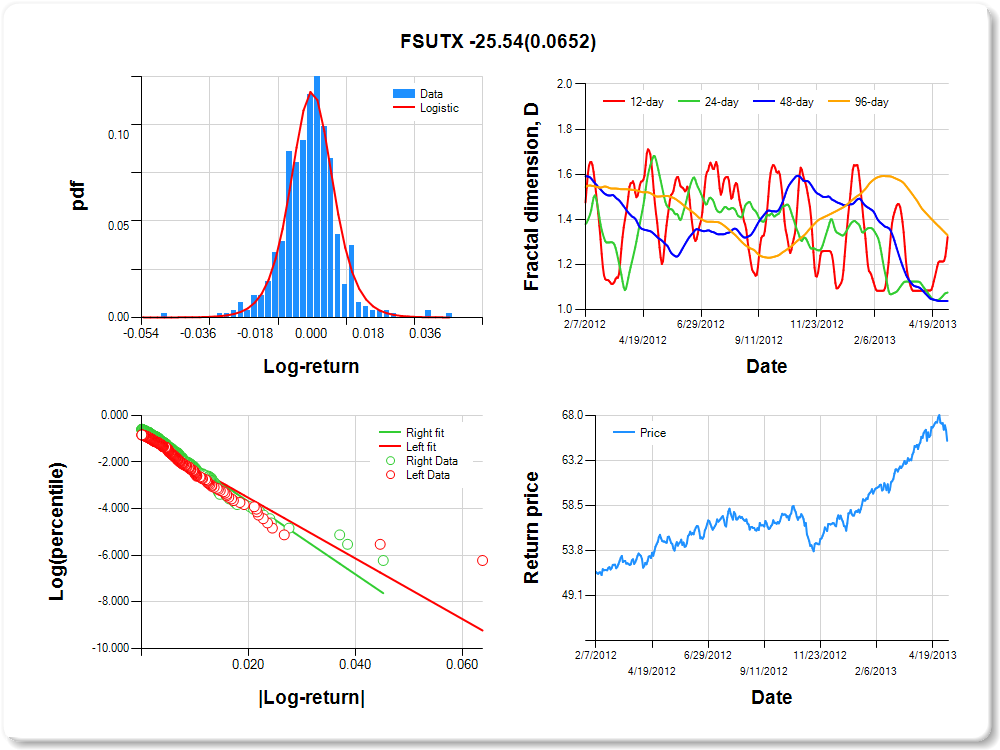
FSUTX
Percentile values of daily loss(gain) in per cent
| 0.5 | 1 | 5 | 10 | 25 | 50 | 75 | 90 | 95 | 99 | 99.5 |
| -0.03 |
-0.02 |
-0.01 |
-0.01 |
0.00 |
0.00 |
0.01 |
0.01 |
0.02 |
0.03 |
2.26 |
Daily log-return distribution fitting results
| Distribution | Location, a | Scale, b |
| Logistic |
0.323 |
0.138 |
Linear regression results [Model: y=log(percentile of log-return), x=|log-return|]
| Variable | Coef(b) | s.e.(b) | t-value | P-value |
| Constant |
-0.931 |
0.095 |
-9.777 |
0.0000 |
|log-return| |
-129.733 |
9.694 |
-13.383 |
0.0000 |
I(right-tail) |
0.347 |
0.129 |
2.686 |
0.0075 |
|log-return|*I(right-tail) |
-25.540 |
13.819 |
-1.848 |
0.0652 |
Hurst exponent (of daily return price)
| 12-day | 24-day | 48-day | 96-day |
| 0.678 |
0.924 |
0.962 |
0.671 |
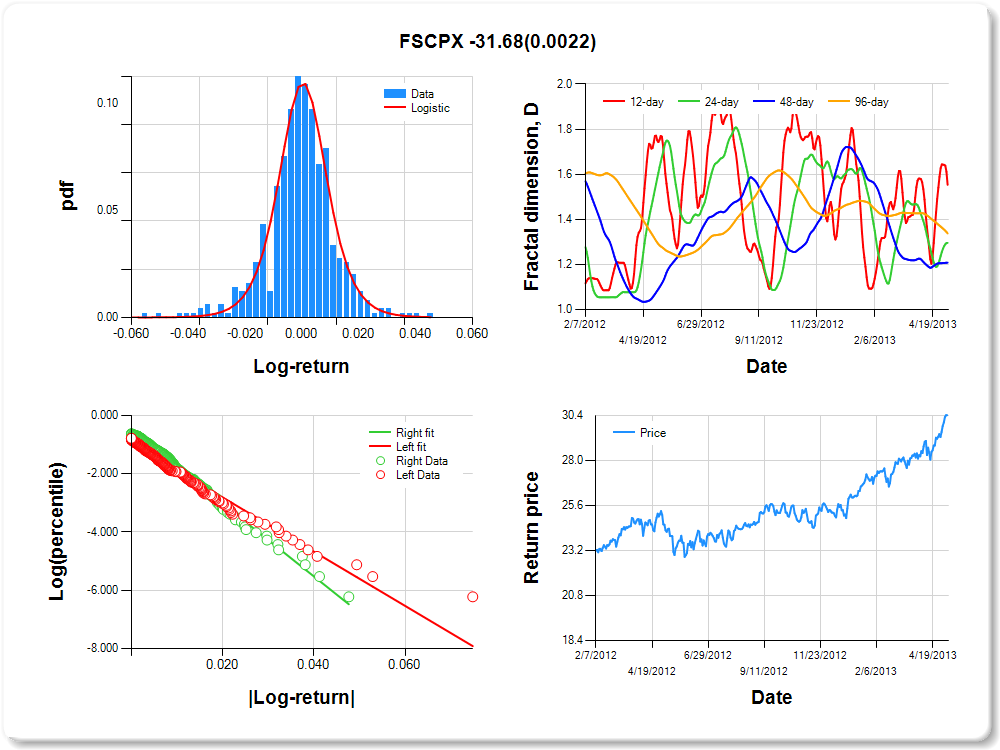
FSCPX
Percentile values of daily loss(gain) in per cent
| 0.5 | 1 | 5 | 10 | 25 | 50 | 75 | 90 | 95 | 99 | 99.5 |
| -0.05 |
-0.04 |
-0.02 |
-0.01 |
-0.01 |
0.00 |
0.01 |
0.02 |
0.03 |
0.04 |
2.72 |
Daily log-return distribution fitting results
| Distribution | Location, a | Scale, b |
| Logistic |
0.421 |
0.156 |
Linear regression results [Model: y=log(percentile of log-return), x=|log-return|]
| Variable | Coef(b) | s.e.(b) | t-value | P-value |
| Constant |
-0.922 |
0.089 |
-10.340 |
0.0000 |
|log-return| |
-93.055 |
6.522 |
-14.268 |
0.0000 |
I(right-tail) |
0.430 |
0.130 |
3.302 |
0.0010 |
|log-return|*I(right-tail) |
-31.680 |
10.293 |
-3.078 |
0.0022 |
Hurst exponent (of daily return price)
| 12-day | 24-day | 48-day | 96-day |
| 0.447 |
0.704 |
0.792 |
0.662 |
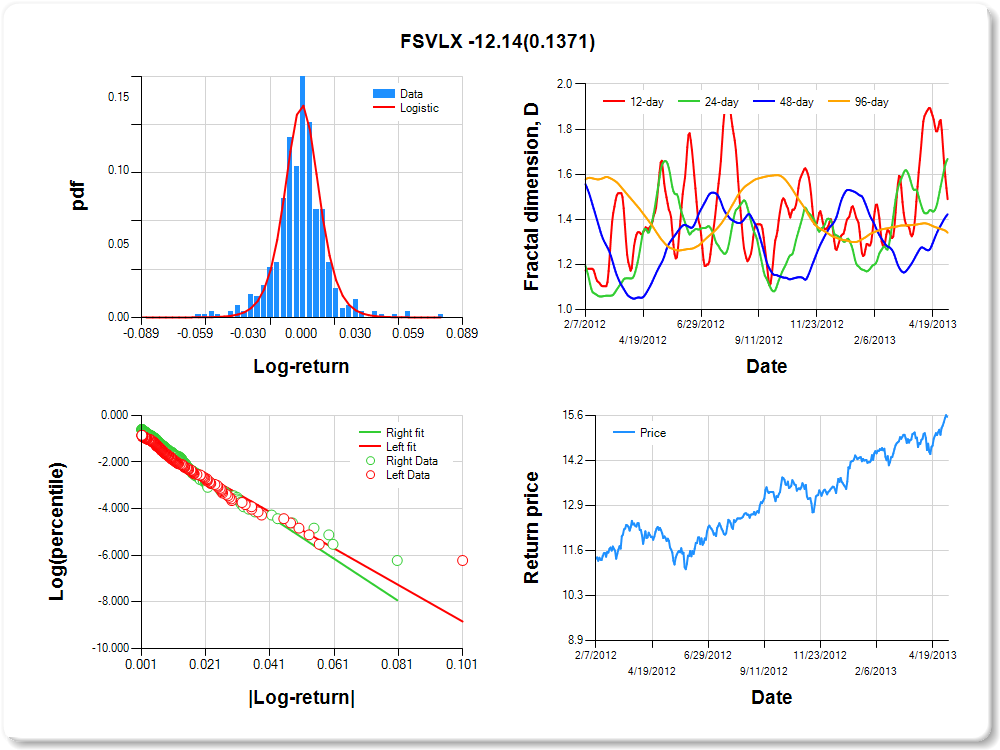
FSVLX
Percentile values of daily loss(gain) in per cent
| 0.5 | 1 | 5 | 10 | 25 | 50 | 75 | 90 | 95 | 99 | 99.5 |
| -0.05 |
-0.05 |
-0.02 |
-0.01 |
-0.01 |
0.00 |
0.01 |
0.02 |
0.04 |
0.06 |
2.46 |
Daily log-return distribution fitting results
| Distribution | Location, a | Scale, b |
| Logistic |
0.224 |
0.118 |
Linear regression results [Model: y=log(percentile of log-return), x=|log-return|]
| Variable | Coef(b) | s.e.(b) | t-value | P-value |
| Constant |
-0.975 |
0.094 |
-10.404 |
0.0000 |
|log-return| |
-78.059 |
5.765 |
-13.539 |
0.0000 |
I(right-tail) |
0.297 |
0.126 |
2.357 |
0.0188 |
|log-return|*I(right-tail) |
-12.142 |
8.154 |
-1.489 |
0.1371 |
Hurst exponent (of daily return price)
| 12-day | 24-day | 48-day | 96-day |
| 0.510 |
0.332 |
0.577 |
0.659 |
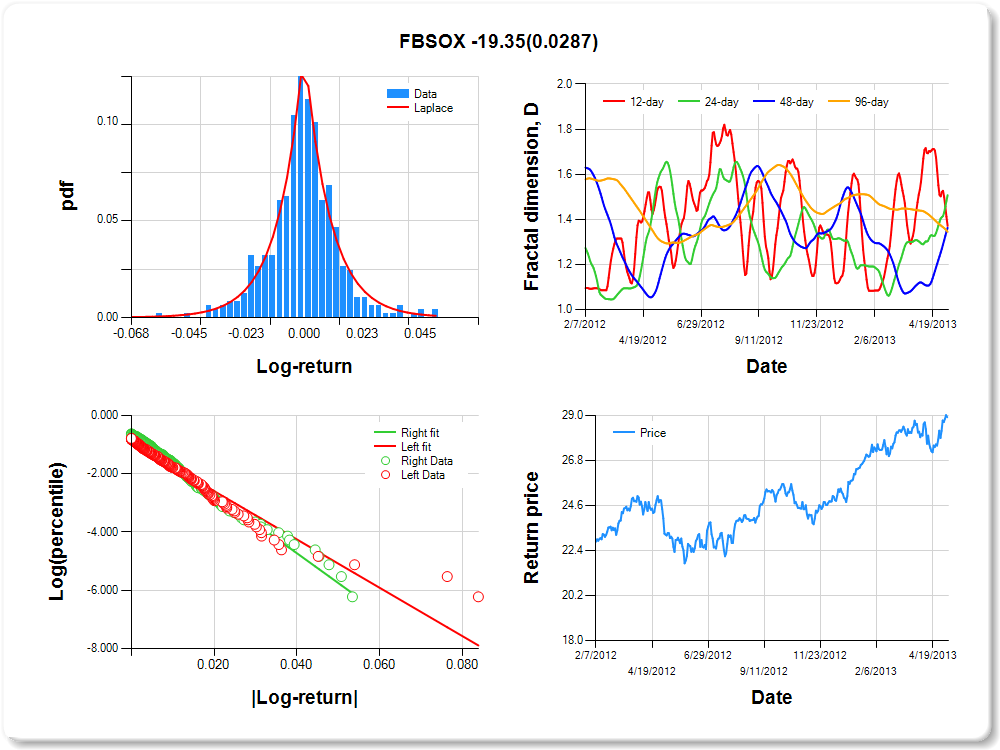
FBSOX
Percentile values of daily loss(gain) in per cent
| 0.5 | 1 | 5 | 10 | 25 | 50 | 75 | 90 | 95 | 99 | 99.5 |
| -0.05 |
-0.04 |
-0.02 |
-0.02 |
-0.01 |
0.00 |
0.01 |
0.02 |
0.04 |
0.05 |
1.12 |
Daily log-return distribution fitting results
| Distribution | Location, a | Scale, b |
| Laplace |
0.406 |
0.249 |
Linear regression results [Model: y=log(percentile of log-return), x=|log-return|]
| Variable | Coef(b) | s.e.(b) | t-value | P-value |
| Constant |
-0.915 |
0.090 |
-10.115 |
0.0000 |
|log-return| |
-82.907 |
5.891 |
-14.073 |
0.0000 |
I(right-tail) |
0.307 |
0.127 |
2.412 |
0.0162 |
|log-return|*I(right-tail) |
-19.352 |
8.817 |
-2.195 |
0.0287 |
Hurst exponent (of daily return price)
| 12-day | 24-day | 48-day | 96-day |
| 0.629 |
0.492 |
0.637 |
0.655 |
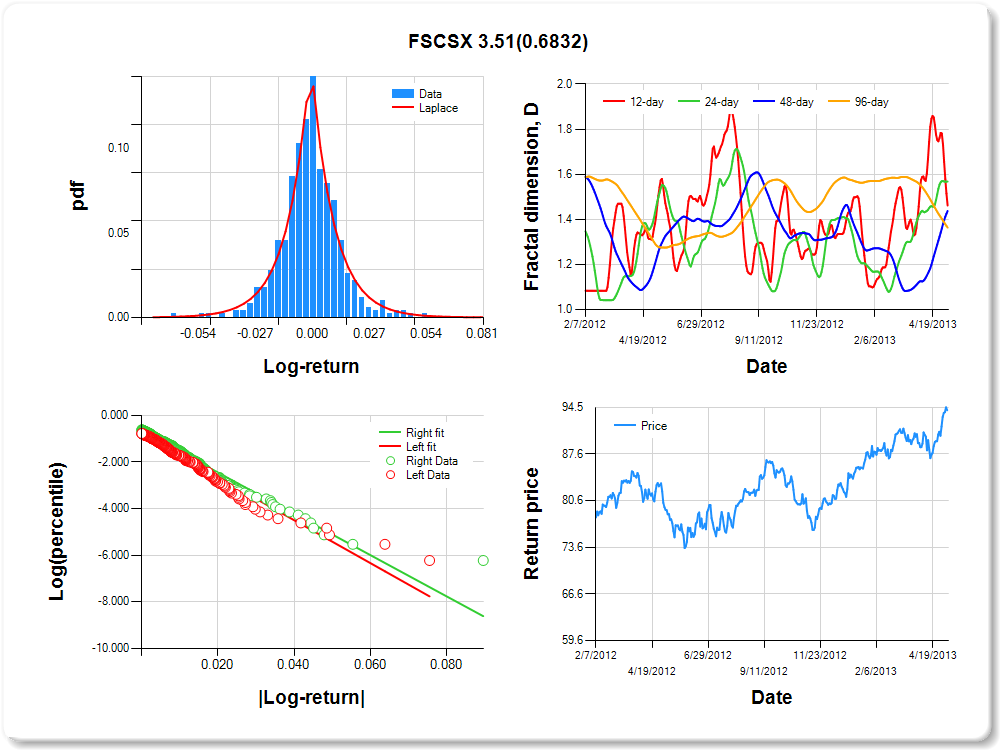
FSCSX
Percentile values of daily loss(gain) in per cent
| 0.5 | 1 | 5 | 10 | 25 | 50 | 75 | 90 | 95 | 99 | 99.5 |
| -0.05 |
-0.04 |
-0.02 |
-0.02 |
-0.01 |
0.00 |
0.01 |
0.02 |
0.04 |
0.05 |
2.29 |
Daily log-return distribution fitting results
| Distribution | Location, a | Scale, b |
| Laplace |
-0.129 |
0.224 |
Linear regression results [Model: y=log(percentile of log-return), x=|log-return|]
| Variable | Coef(b) | s.e.(b) | t-value | P-value |
| Constant |
-0.817 |
0.094 |
-8.719 |
0.0000 |
|log-return| |
-91.905 |
6.437 |
-14.278 |
0.0000 |
I(right-tail) |
0.132 |
0.127 |
1.045 |
0.2967 |
|log-return|*I(right-tail) |
3.512 |
8.599 |
0.408 |
0.6832 |
Hurst exponent (of daily return price)
| 12-day | 24-day | 48-day | 96-day |
| 0.539 |
0.432 |
0.563 |
0.637 |
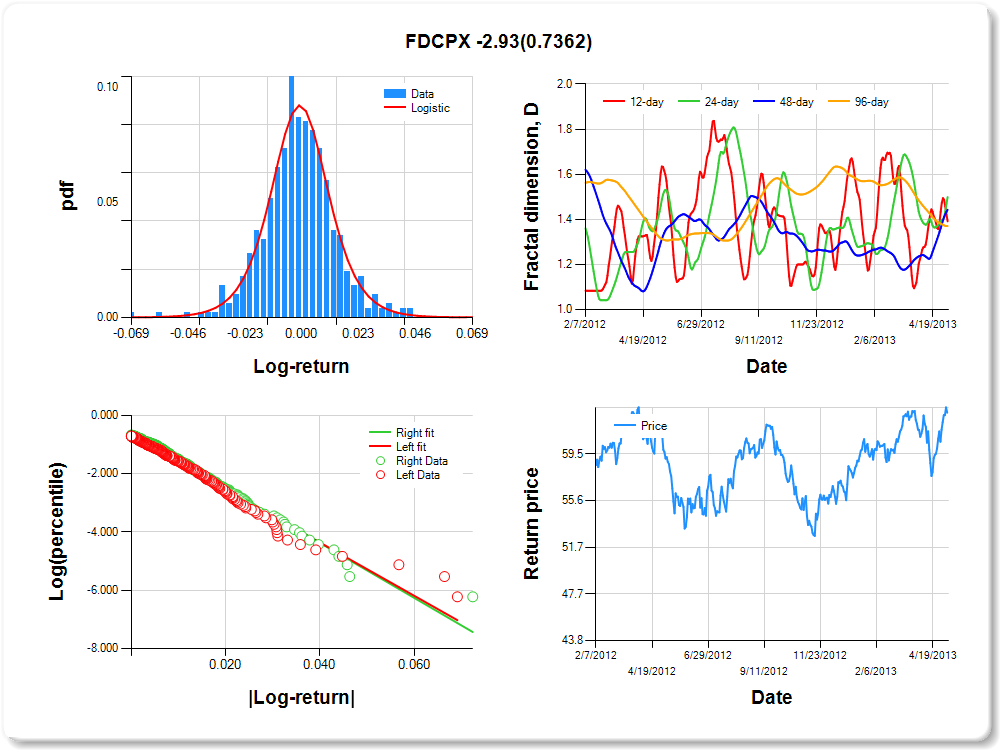
FDCPX
Percentile values of daily loss(gain) in per cent
| 0.5 | 1 | 5 | 10 | 25 | 50 | 75 | 90 | 95 | 99 | 99.5 |
| -0.06 |
-0.04 |
-0.02 |
-0.02 |
-0.01 |
0.00 |
0.01 |
0.02 |
0.04 |
0.05 |
2.94 |
Daily log-return distribution fitting results
| Distribution | Location, a | Scale, b |
| Logistic |
-0.028 |
0.186 |
Linear regression results [Model: y=log(percentile of log-return), x=|log-return|]
| Variable | Coef(b) | s.e.(b) | t-value | P-value |
| Constant |
-0.699 |
0.092 |
-7.573 |
0.0000 |
|log-return| |
-91.396 |
6.127 |
-14.918 |
0.0000 |
I(right-tail) |
0.105 |
0.132 |
0.793 |
0.4280 |
|log-return|*I(right-tail) |
-2.932 |
8.699 |
-0.337 |
0.7362 |
Hurst exponent (of daily return price)
| 12-day | 24-day | 48-day | 96-day |
| 0.608 |
0.501 |
0.557 |
0.629 |
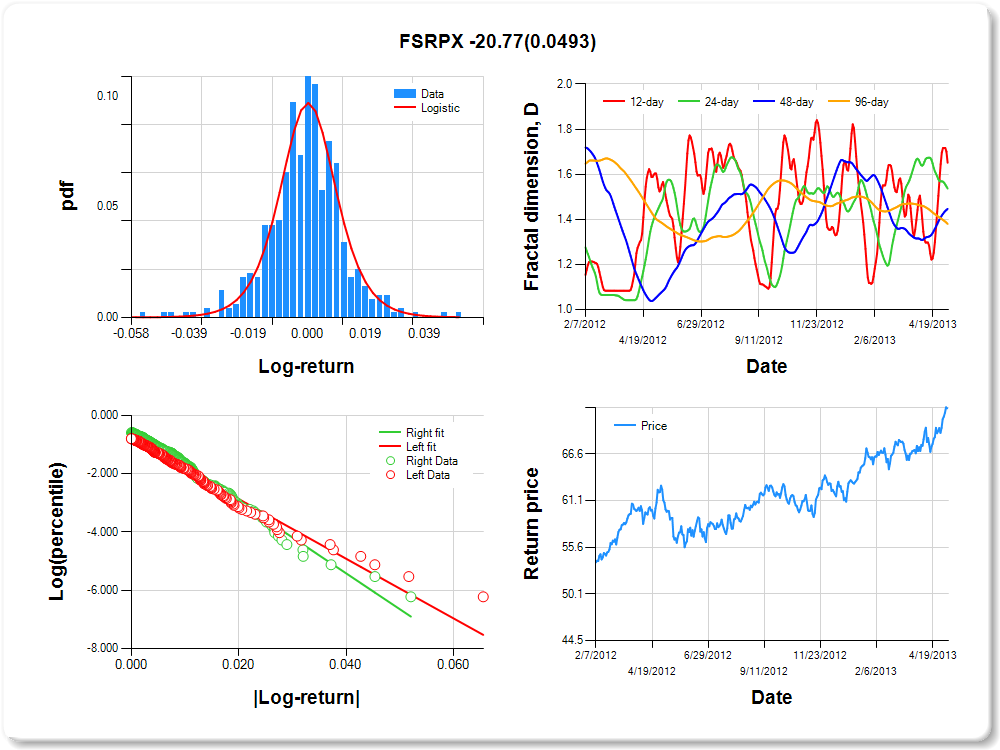
FSRPX
Percentile values of daily loss(gain) in per cent
| 0.5 | 1 | 5 | 10 | 25 | 50 | 75 | 90 | 95 | 99 | 99.5 |
| -0.04 |
-0.04 |
-0.02 |
-0.01 |
-0.01 |
0.00 |
0.01 |
0.02 |
0.03 |
0.03 |
1.90 |
Daily log-return distribution fitting results
| Distribution | Location, a | Scale, b |
| Logistic |
0.238 |
0.177 |
Linear regression results [Model: y=log(percentile of log-return), x=|log-return|]
| Variable | Coef(b) | s.e.(b) | t-value | P-value |
| Constant |
-0.817 |
0.095 |
-8.556 |
0.0000 |
|log-return| |
-102.251 |
7.193 |
-14.214 |
0.0000 |
I(right-tail) |
0.334 |
0.132 |
2.527 |
0.0118 |
|log-return|*I(right-tail) |
-20.774 |
10.543 |
-1.970 |
0.0493 |
Hurst exponent (of daily return price)
| 12-day | 24-day | 48-day | 96-day |
| 0.349 |
0.463 |
0.553 |
0.620 |
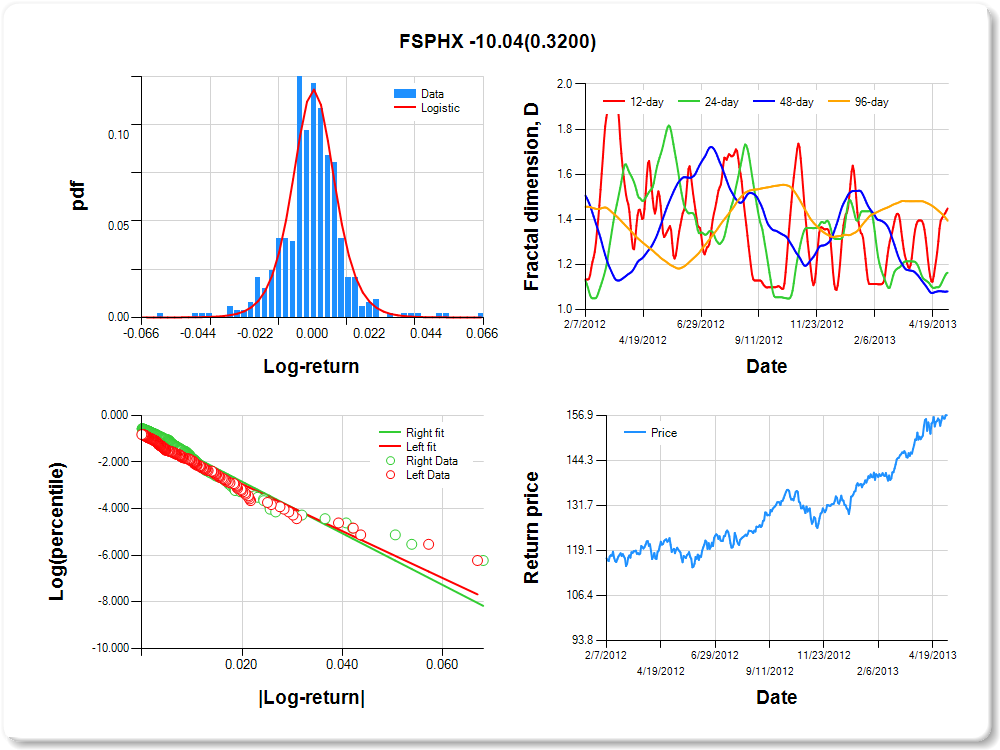
FSPHX
Percentile values of daily loss(gain) in per cent
| 0.5 | 1 | 5 | 10 | 25 | 50 | 75 | 90 | 95 | 99 | 99.5 |
| -0.04 |
-0.04 |
-0.02 |
-0.01 |
0.00 |
0.00 |
0.01 |
0.02 |
0.04 |
0.04 |
3.86 |
Daily log-return distribution fitting results
| Distribution | Location, a | Scale, b |
| Logistic |
0.030 |
0.137 |
Linear regression results [Model: y=log(percentile of log-return), x=|log-return|]
| Variable | Coef(b) | s.e.(b) | t-value | P-value |
| Constant |
-0.937 |
0.092 |
-10.188 |
0.0000 |
|log-return| |
-100.671 |
7.221 |
-13.941 |
0.0000 |
I(right-tail) |
0.307 |
0.125 |
2.469 |
0.0139 |
|log-return|*I(right-tail) |
-10.035 |
10.081 |
-0.995 |
0.3200 |
Hurst exponent (of daily return price)
| 12-day | 24-day | 48-day | 96-day |
| 0.552 |
0.837 |
0.919 |
0.606 |
FSRBX
Percentile values of daily loss(gain) in per cent
| 0.5 | 1 | 5 | 10 | 25 | 50 | 75 | 90 | 95 | 99 | 99.5 |
| -0.06 |
-0.05 |
-0.03 |
-0.02 |
-0.01 |
0.00 |
0.01 |
0.02 |
0.05 |
0.05 |
3.40 |
Daily log-return distribution fitting results
| Distribution | Location, a | Scale, b |
| Logistic |
0.361 |
0.146 |
Linear regression results [Model: y=log(percentile of log-return), x=|log-return|]
| Variable | Coef(b) | s.e.(b) | t-value | P-value |
| Constant |
-0.919 |
0.089 |
-10.329 |
0.0000 |
|log-return| |
-68.954 |
4.830 |
-14.276 |
0.0000 |
I(right-tail) |
0.246 |
0.125 |
1.974 |
0.0490 |
|log-return|*I(right-tail) |
-14.574 |
7.241 |
-2.013 |
0.0447 |
Hurst exponent (of daily return price)
| 12-day | 24-day | 48-day | 96-day |
| 0.533 |
0.425 |
0.545 |
0.605 |

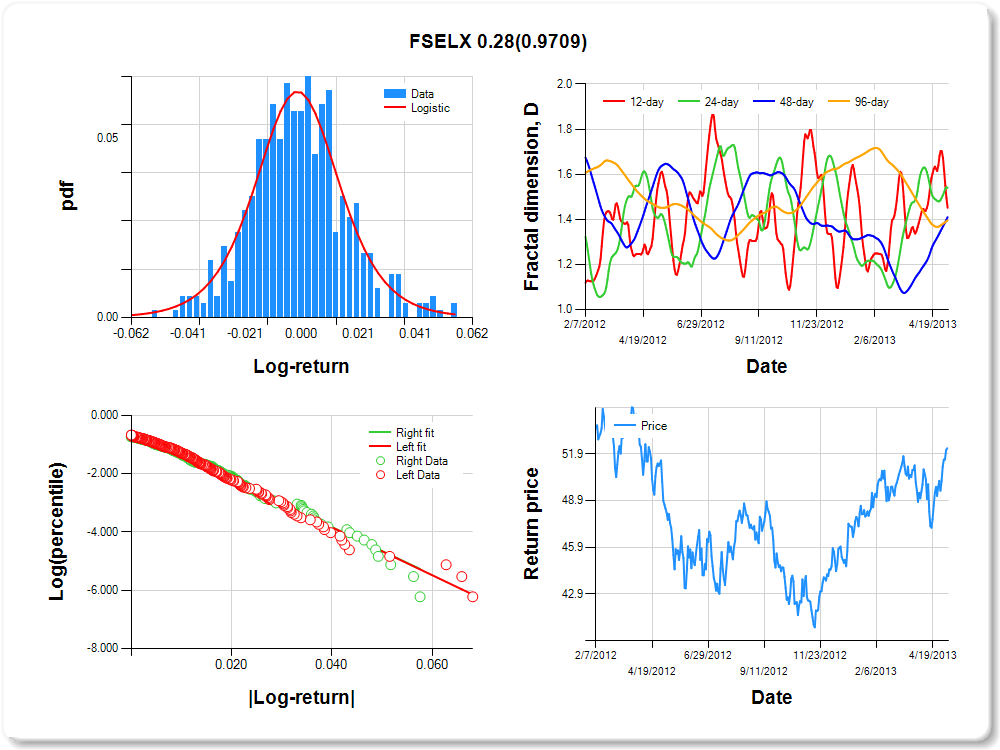
FSELX
Percentile values of daily loss(gain) in per cent
| 0.5 | 1 | 5 | 10 | 25 | 50 | 75 | 90 | 95 | 99 | 99.5 |
| -0.06 |
-0.04 |
-0.03 |
-0.02 |
-0.01 |
0.00 |
0.01 |
0.03 |
0.05 |
0.05 |
3.57 |
Daily log-return distribution fitting results
| Distribution | Location, a | Scale, b |
| Logistic |
0.132 |
0.273 |
Linear regression results [Model: y=log(percentile of log-return), x=|log-return|]
| Variable | Coef(b) | s.e.(b) | t-value | P-value |
| Constant |
-0.544 |
0.096 |
-5.643 |
0.0000 |
|log-return| |
-82.136 |
5.376 |
-15.280 |
0.0000 |
I(right-tail) |
-0.003 |
0.139 |
-0.025 |
0.9801 |
|log-return|*I(right-tail) |
0.280 |
7.681 |
0.036 |
0.9709 |
Hurst exponent (of daily return price)
| 12-day | 24-day | 48-day | 96-day |
| 0.549 |
0.460 |
0.590 |
0.604 |
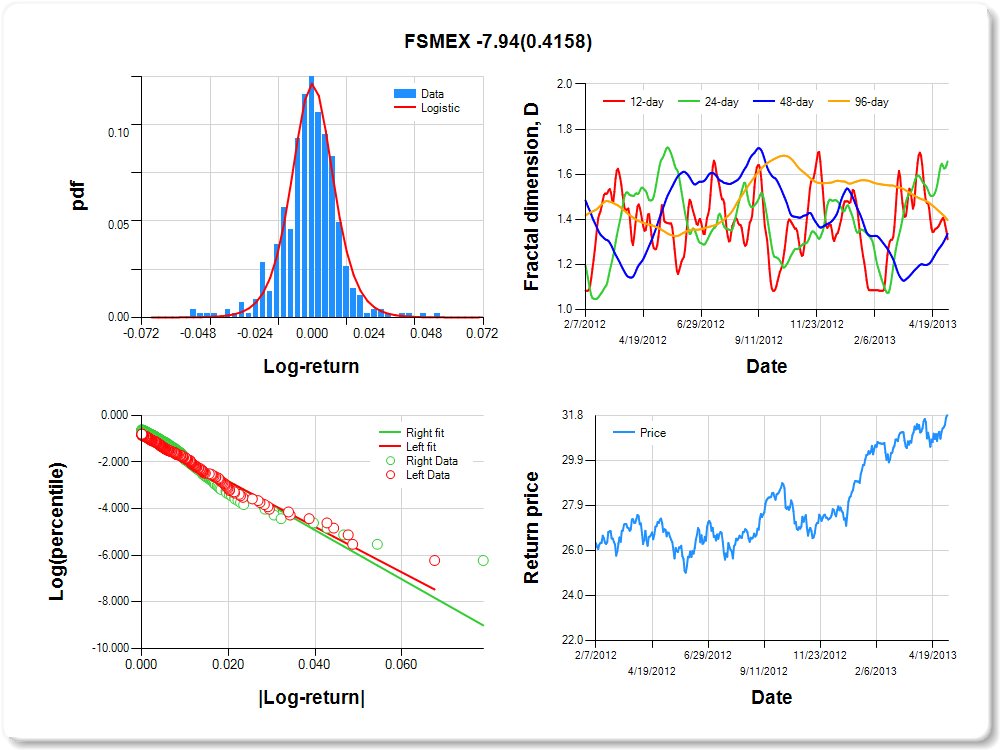
FSMEX
Percentile values of daily loss(gain) in per cent
| 0.5 | 1 | 5 | 10 | 25 | 50 | 75 | 90 | 95 | 99 | 99.5 |
| -0.05 |
-0.04 |
-0.02 |
-0.01 |
-0.01 |
0.00 |
0.01 |
0.02 |
0.03 |
0.04 |
2.03 |
Daily log-return distribution fitting results
| Distribution | Location, a | Scale, b |
| Logistic |
-0.098 |
0.135 |
Linear regression results [Model: y=log(percentile of log-return), x=|log-return|]
| Variable | Coef(b) | s.e.(b) | t-value | P-value |
| Constant |
-0.872 |
0.093 |
-9.371 |
0.0000 |
|log-return| |
-97.230 |
6.853 |
-14.189 |
0.0000 |
I(right-tail) |
0.180 |
0.127 |
1.424 |
0.1551 |
|log-return|*I(right-tail) |
-7.941 |
9.749 |
-0.815 |
0.4158 |
Hurst exponent (of daily return price)
| 12-day | 24-day | 48-day | 96-day |
| 0.688 |
0.343 |
0.664 |
0.603 |
FPHAX
Percentile values of daily loss(gain) in per cent
| 0.5 | 1 | 5 | 10 | 25 | 50 | 75 | 90 | 95 | 99 | 99.5 |
| -0.04 |
-0.03 |
-0.02 |
-0.01 |
0.00 |
0.00 |
0.01 |
0.02 |
0.03 |
0.04 |
2.90 |
Daily log-return distribution fitting results
| Distribution | Location, a | Scale, b |
| Logistic |
0.221 |
0.162 |
Linear regression results [Model: y=log(percentile of log-return), x=|log-return|]
| Variable | Coef(b) | s.e.(b) | t-value | P-value |
| Constant |
-0.944 |
0.094 |
-10.036 |
0.0000 |
|log-return| |
-110.141 |
8.044 |
-13.692 |
0.0000 |
I(right-tail) |
0.425 |
0.131 |
3.241 |
0.0013 |
|log-return|*I(right-tail) |
-31.077 |
12.049 |
-2.579 |
0.0102 |
Hurst exponent (of daily return price)
| 12-day | 24-day | 48-day | 96-day |
| 0.645 |
0.943 |
0.934 |
0.603 |

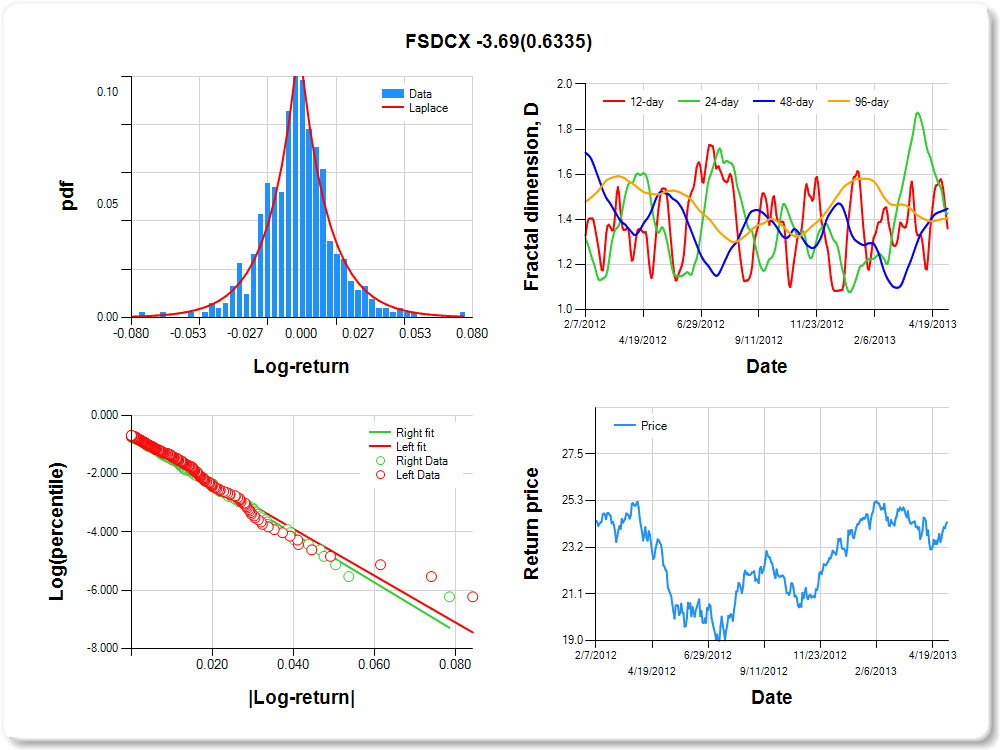
FSDCX
Percentile values of daily loss(gain) in per cent
| 0.5 | 1 | 5 | 10 | 25 | 50 | 75 | 90 | 95 | 99 | 99.5 |
| -0.06 |
-0.04 |
-0.03 |
-0.02 |
-0.01 |
0.00 |
0.01 |
0.03 |
0.05 |
0.05 |
2.25 |
Daily log-return distribution fitting results
| Distribution | Location, a | Scale, b |
| Laplace |
0.064 |
0.280 |
Linear regression results [Model: y=log(percentile of log-return), x=|log-return|]
| Variable | Coef(b) | s.e.(b) | t-value | P-value |
| Constant |
-0.664 |
0.092 |
-7.206 |
0.0000 |
|log-return| |
-80.225 |
5.326 |
-15.063 |
0.0000 |
I(right-tail) |
-0.010 |
0.132 |
-0.073 |
0.9416 |
|log-return|*I(right-tail) |
-3.693 |
7.740 |
-0.477 |
0.6335 |
Hurst exponent (of daily return price)
| 12-day | 24-day | 48-day | 96-day |
| 0.640 |
0.574 |
0.552 |
0.595 |
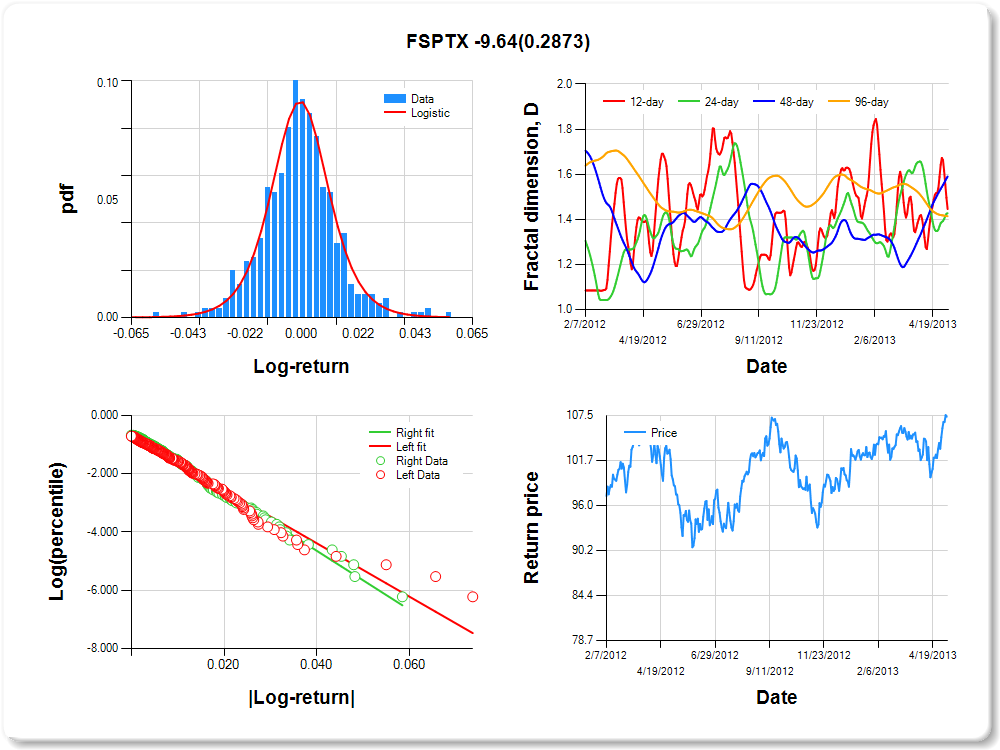
FSPTX
Percentile values of daily loss(gain) in per cent
| 0.5 | 1 | 5 | 10 | 25 | 50 | 75 | 90 | 95 | 99 | 99.5 |
| -0.05 |
-0.04 |
-0.02 |
-0.02 |
-0.01 |
0.00 |
0.01 |
0.02 |
0.04 |
0.05 |
1.47 |
Daily log-return distribution fitting results
| Distribution | Location, a | Scale, b |
| Logistic |
0.212 |
0.186 |
Linear regression results [Model: y=log(percentile of log-return), x=|log-return|]
| Variable | Coef(b) | s.e.(b) | t-value | P-value |
| Constant |
-0.719 |
0.092 |
-7.832 |
0.0000 |
|log-return| |
-91.620 |
6.168 |
-14.854 |
0.0000 |
I(right-tail) |
0.128 |
0.132 |
0.970 |
0.3327 |
|log-return|*I(right-tail) |
-9.642 |
9.052 |
-1.065 |
0.2873 |
Hurst exponent (of daily return price)
| 12-day | 24-day | 48-day | 96-day |
| 0.554 |
0.573 |
0.410 |
0.586 |
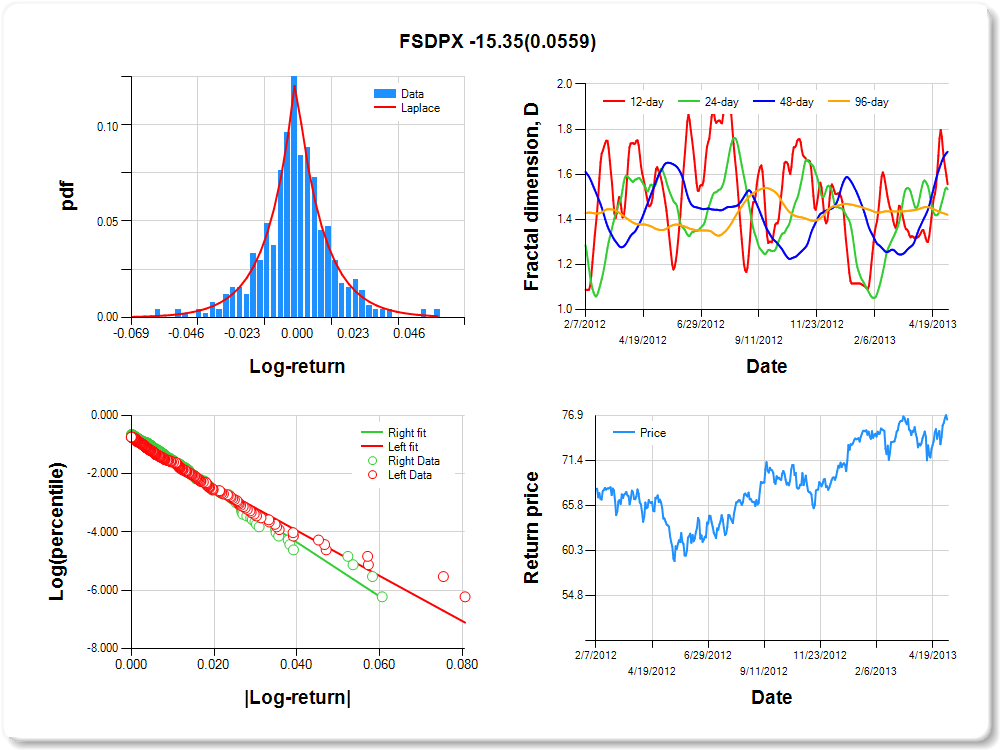
FSDPX
Percentile values of daily loss(gain) in per cent
| 0.5 | 1 | 5 | 10 | 25 | 50 | 75 | 90 | 95 | 99 | 99.5 |
| -0.06 |
-0.05 |
-0.03 |
-0.02 |
-0.01 |
0.00 |
0.01 |
0.03 |
0.04 |
0.05 |
3.09 |
Daily log-return distribution fitting results
| Distribution | Location, a | Scale, b |
| Laplace |
0.250 |
0.272 |
Linear regression results [Model: y=log(percentile of log-return), x=|log-return|]
| Variable | Coef(b) | s.e.(b) | t-value | P-value |
| Constant |
-0.847 |
0.089 |
-9.559 |
0.0000 |
|log-return| |
-77.553 |
5.289 |
-14.662 |
0.0000 |
I(right-tail) |
0.218 |
0.127 |
1.719 |
0.0862 |
|log-return|*I(right-tail) |
-15.350 |
8.009 |
-1.917 |
0.0559 |
Hurst exponent (of daily return price)
| 12-day | 24-day | 48-day | 96-day |
| 0.444 |
0.467 |
0.300 |
0.580 |
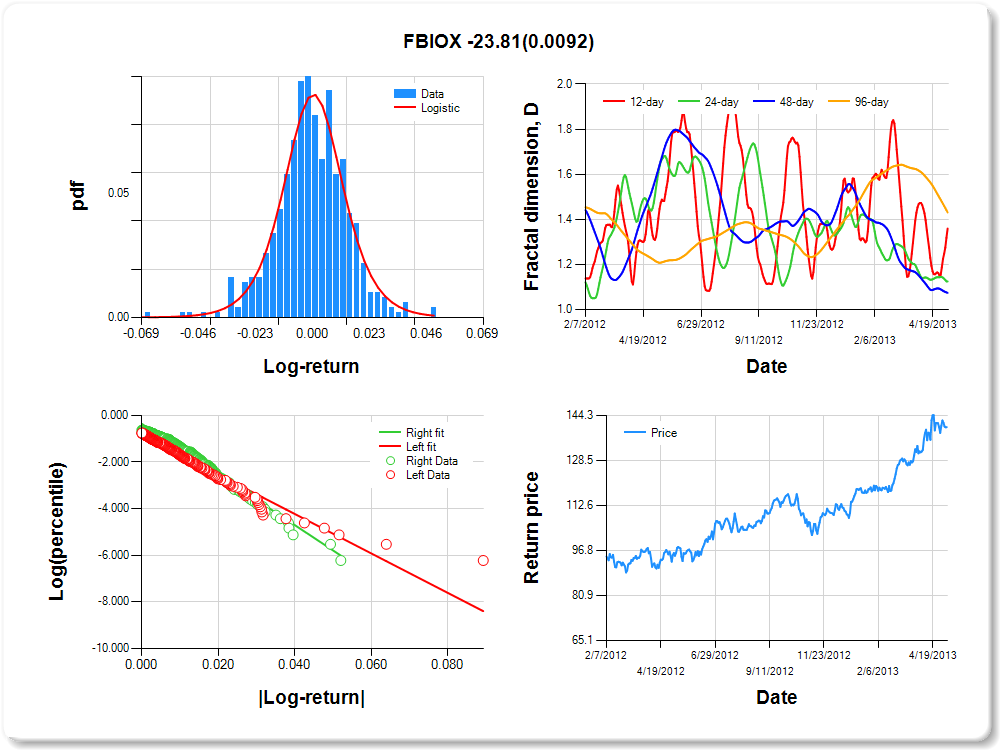
FBIOX
Percentile values of daily loss(gain) in per cent
| 0.5 | 1 | 5 | 10 | 25 | 50 | 75 | 90 | 95 | 99 | 99.5 |
| -0.05 |
-0.04 |
-0.02 |
-0.02 |
-0.01 |
0.00 |
0.01 |
0.02 |
0.04 |
0.04 |
2.07 |
Daily log-return distribution fitting results
| Distribution | Location, a | Scale, b |
| Logistic |
0.494 |
0.191 |
Linear regression results [Model: y=log(percentile of log-return), x=|log-return|]
| Variable | Coef(b) | s.e.(b) | t-value | P-value |
| Constant |
-0.846 |
0.090 |
-9.362 |
0.0000 |
|log-return| |
-84.575 |
5.871 |
-14.404 |
0.0000 |
I(right-tail) |
0.475 |
0.136 |
3.499 |
0.0005 |
|log-return|*I(right-tail) |
-23.814 |
9.112 |
-2.614 |
0.0092 |
Hurst exponent (of daily return price)
| 12-day | 24-day | 48-day | 96-day |
| 0.641 |
0.875 |
0.926 |
0.569 |
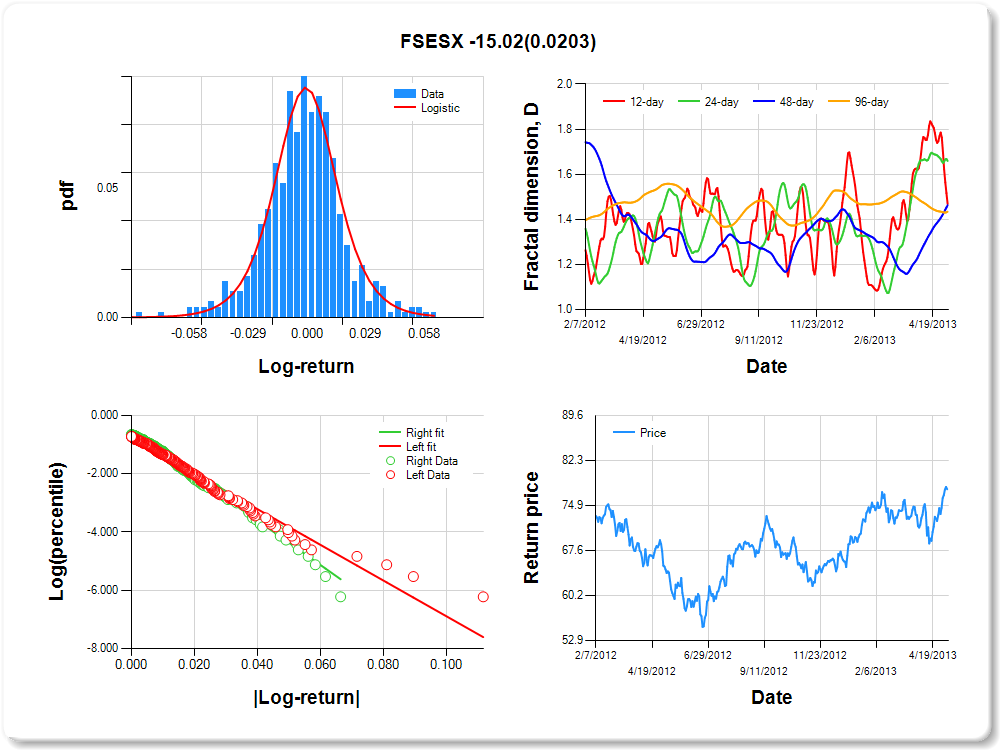
FSESX
Percentile values of daily loss(gain) in per cent
| 0.5 | 1 | 5 | 10 | 25 | 50 | 75 | 90 | 95 | 99 | 99.5 |
| -0.08 |
-0.06 |
-0.03 |
-0.02 |
-0.01 |
0.00 |
0.01 |
0.03 |
0.05 |
0.06 |
3.07 |
Daily log-return distribution fitting results
| Distribution | Location, a | Scale, b |
| Logistic |
0.455 |
0.194 |
Linear regression results [Model: y=log(percentile of log-return), x=|log-return|]
| Variable | Coef(b) | s.e.(b) | t-value | P-value |
| Constant |
-0.756 |
0.091 |
-8.295 |
0.0000 |
|log-return| |
-61.328 |
4.144 |
-14.799 |
0.0000 |
I(right-tail) |
0.213 |
0.132 |
1.621 |
0.1056 |
|log-return|*I(right-tail) |
-15.022 |
6.453 |
-2.328 |
0.0203 |
Hurst exponent (of daily return price)
| 12-day | 24-day | 48-day | 96-day |
| 0.532 |
0.341 |
0.537 |
0.566 |
FSNGX
Percentile values of daily loss(gain) in per cent
| 0.5 | 1 | 5 | 10 | 25 | 50 | 75 | 90 | 95 | 99 | 99.5 |
| -0.06 |
-0.05 |
-0.03 |
-0.02 |
-0.01 |
0.00 |
0.01 |
0.02 |
0.04 |
0.04 |
4.13 |
Daily log-return distribution fitting results
| Distribution | Location, a | Scale, b |
| Logistic |
0.440 |
0.169 |
Linear regression results [Model: y=log(percentile of log-return), x=|log-return|]
| Variable | Coef(b) | s.e.(b) | t-value | P-value |
| Constant |
-0.836 |
0.089 |
-9.448 |
0.0000 |
|log-return| |
-73.972 |
5.045 |
-14.662 |
0.0000 |
I(right-tail) |
0.256 |
0.128 |
1.997 |
0.0463 |
|log-return|*I(right-tail) |
-21.953 |
7.993 |
-2.746 |
0.0062 |
Hurst exponent (of daily return price)
| 12-day | 24-day | 48-day | 96-day |
| 0.585 |
0.348 |
0.306 |
0.551 |

FSTCX
Percentile values of daily loss(gain) in per cent
| 0.5 | 1 | 5 | 10 | 25 | 50 | 75 | 90 | 95 | 99 | 99.5 |
| -0.04 |
-0.03 |
-0.02 |
-0.01 |
-0.01 |
0.00 |
0.01 |
0.01 |
0.03 |
0.04 |
2.27 |
Daily log-return distribution fitting results
| Distribution | Location, a | Scale, b |
| Logistic |
0.365 |
0.145 |
Linear regression results [Model: y=log(percentile of log-return), x=|log-return|]
| Variable | Coef(b) | s.e.(b) | t-value | P-value |
| Constant |
-0.908 |
0.093 |
-9.773 |
0.0000 |
|log-return| |
-106.837 |
7.683 |
-13.905 |
0.0000 |
I(right-tail) |
0.375 |
0.129 |
2.919 |
0.0037 |
|log-return|*I(right-tail) |
-34.859 |
11.776 |
-2.960 |
0.0032 |
Hurst exponent (of daily return price)
| 12-day | 24-day | 48-day | 96-day |
| 0.845 |
0.924 |
0.628 |
0.528 |

FSENX
Percentile values of daily loss(gain) in per cent
| 0.5 | 1 | 5 | 10 | 25 | 50 | 75 | 90 | 95 | 99 | 99.5 |
| -0.06 |
-0.05 |
-0.03 |
-0.02 |
-0.01 |
0.00 |
0.01 |
0.03 |
0.05 |
0.05 |
3.77 |
Daily log-return distribution fitting results
| Distribution | Location, a | Scale, b |
| Logistic |
0.482 |
0.176 |
Linear regression results [Model: y=log(percentile of log-return), x=|log-return|]
| Variable | Coef(b) | s.e.(b) | t-value | P-value |
| Constant |
-0.801 |
0.088 |
-9.114 |
0.0000 |
|log-return| |
-69.485 |
4.681 |
-14.845 |
0.0000 |
I(right-tail) |
0.215 |
0.129 |
1.669 |
0.0958 |
|log-return|*I(right-tail) |
-16.395 |
7.296 |
-2.247 |
0.0251 |
Hurst exponent (of daily return price)
| 12-day | 24-day | 48-day | 96-day |
| 0.562 |
0.363 |
0.450 |
0.522 |

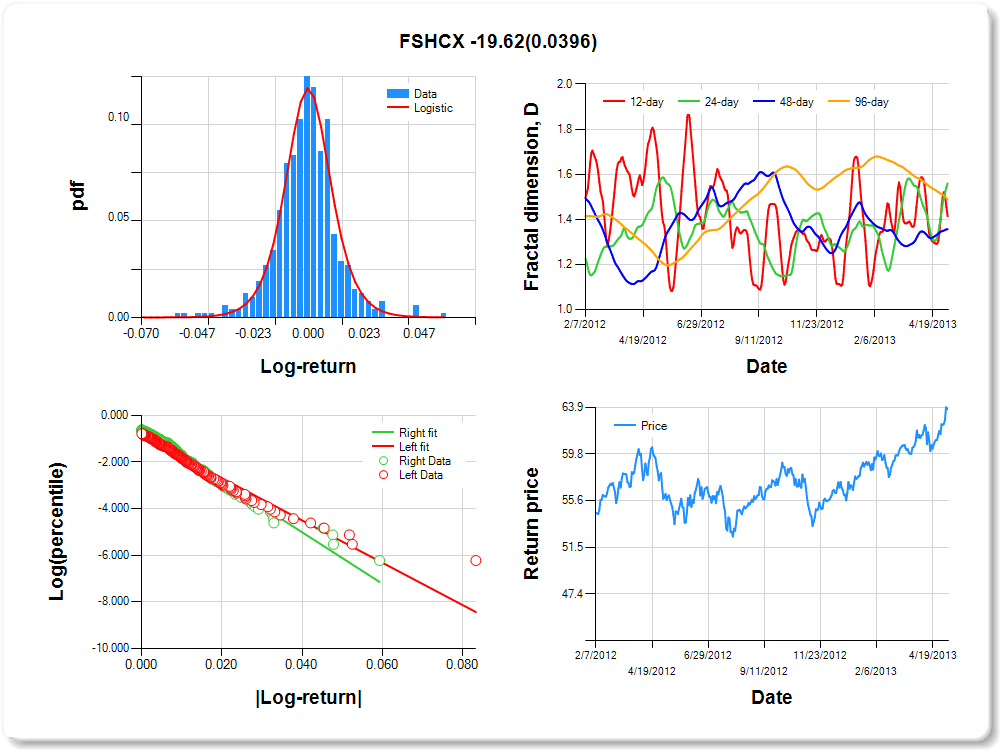
FSHCX
Percentile values of daily loss(gain) in per cent
| 0.5 | 1 | 5 | 10 | 25 | 50 | 75 | 90 | 95 | 99 | 99.5 |
| -0.05 |
-0.04 |
-0.02 |
-0.01 |
-0.01 |
0.00 |
0.01 |
0.02 |
0.03 |
0.05 |
3.51 |
Daily log-return distribution fitting results
| Distribution | Location, a | Scale, b |
| Logistic |
0.315 |
0.149 |
Linear regression results [Model: y=log(percentile of log-return), x=|log-return|]
| Variable | Coef(b) | s.e.(b) | t-value | P-value |
| Constant |
-0.872 |
0.092 |
-9.496 |
0.0000 |
|log-return| |
-90.609 |
6.396 |
-14.168 |
0.0000 |
I(right-tail) |
0.280 |
0.128 |
2.184 |
0.0294 |
|log-return|*I(right-tail) |
-19.618 |
9.510 |
-2.063 |
0.0396 |
Hurst exponent (of daily return price)
| 12-day | 24-day | 48-day | 96-day |
| 0.586 |
0.440 |
0.644 |
0.512 |
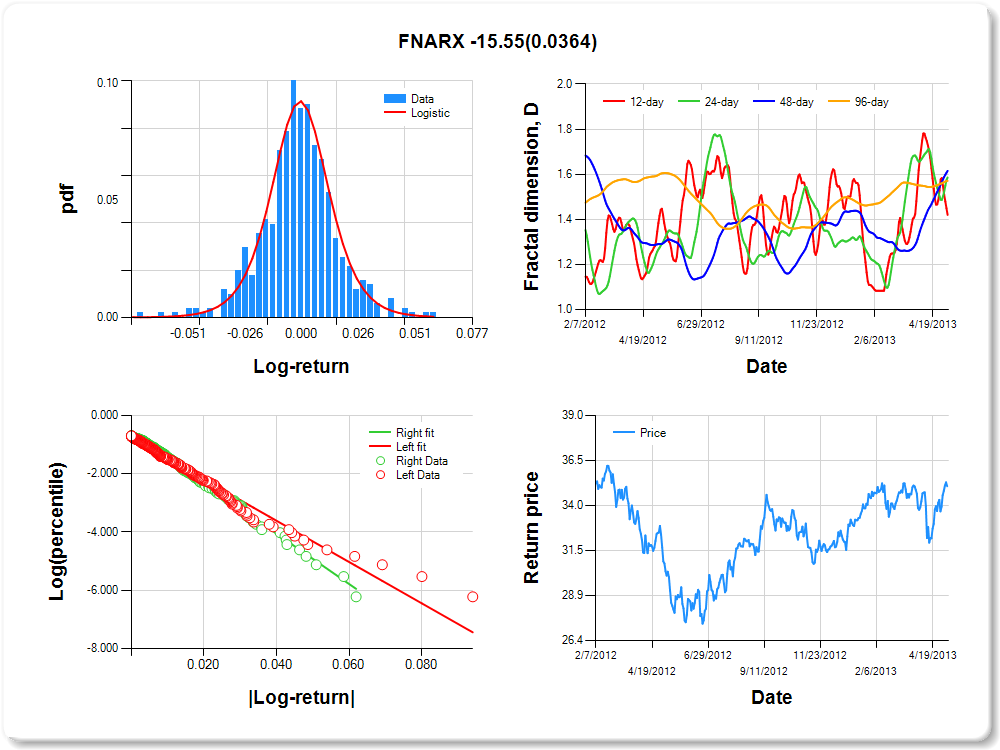
FNARX
Percentile values of daily loss(gain) in per cent
| 0.5 | 1 | 5 | 10 | 25 | 50 | 75 | 90 | 95 | 99 | 99.5 |
| -0.07 |
-0.05 |
-0.03 |
-0.02 |
-0.01 |
0.00 |
0.01 |
0.03 |
0.04 |
0.05 |
2.81 |
Daily log-return distribution fitting results
| Distribution | Location, a | Scale, b |
| Logistic |
0.368 |
0.186 |
Linear regression results [Model: y=log(percentile of log-return), x=|log-return|]
| Variable | Coef(b) | s.e.(b) | t-value | P-value |
| Constant |
-0.770 |
0.089 |
-8.705 |
0.0000 |
|log-return| |
-70.778 |
4.733 |
-14.954 |
0.0000 |
I(right-tail) |
0.183 |
0.131 |
1.397 |
0.1630 |
|log-return|*I(right-tail) |
-15.548 |
7.411 |
-2.098 |
0.0364 |
Hurst exponent (of daily return price)
| 12-day | 24-day | 48-day | 96-day |
| 0.580 |
0.414 |
0.384 |
0.429 |