FSAIX
Percentile values of daily loss(gain) in per cent
| 0.5 | 1 | 5 | 10 | 25 | 50 | 75 | 90 | 95 | 99 | 99.5 |
| -0.06 |
-0.05 |
-0.03 |
-0.02 |
-0.01 |
0.00 |
0.01 |
0.03 |
0.06 |
0.07 |
0.00 |
Daily log-return distribution fitting results
| Distribution | Location, a | Scale, b |
| Laplace |
-0.044 |
0.183 |
Linear regression results [Model: y=log(percentile of log-return), x=|log-return|]
| Variable | Coef(b) | s.e.(b) | t-value | P-value |
| Constant |
-0.884 |
0.040 |
-22.148 |
0.0000 |
|log-return| |
-71.945 |
2.165 |
-33.225 |
0.0000 |
I(right-tail) |
0.126 |
0.055 |
2.319 |
0.0205 |
|log-return|*I(right-tail) |
-2.530 |
3.025 |
-0.836 |
0.4030 |
Hurst exponent (of daily return price)
| 12-day | 24-day | 48-day | 96-day |
| 0.421 |
0.263 |
0.714 |
0.905 |

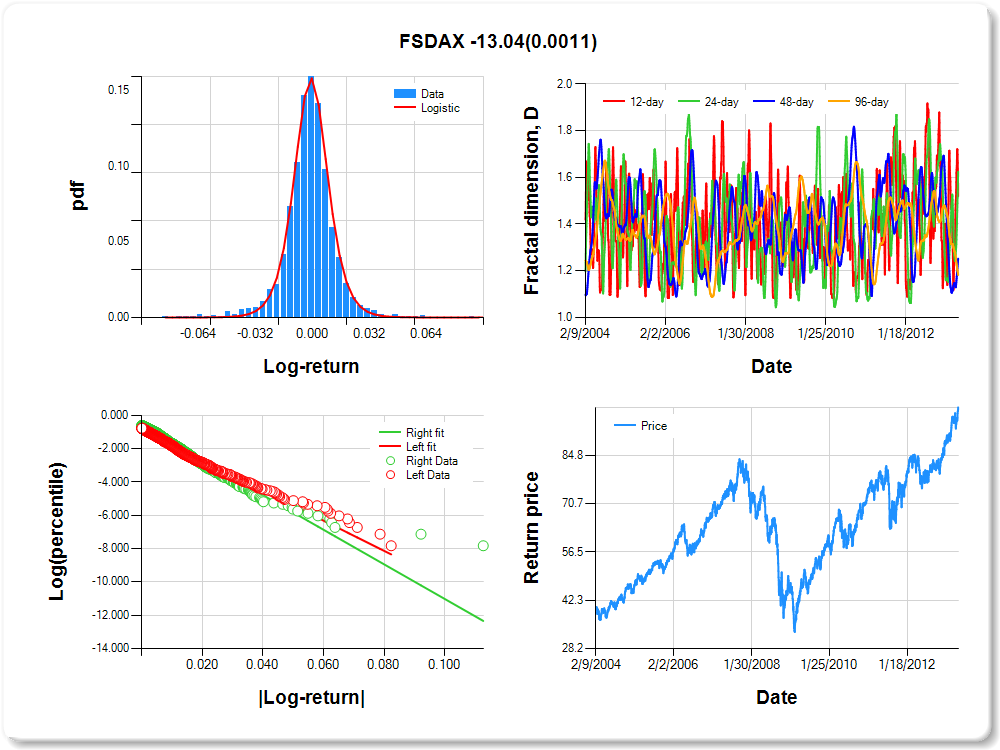
FSDAX
Percentile values of daily loss(gain) in per cent
| 0.5 | 1 | 5 | 10 | 25 | 50 | 75 | 90 | 95 | 99 | 99.5 |
| -0.05 |
-0.04 |
-0.02 |
-0.01 |
-0.01 |
0.00 |
0.01 |
0.02 |
0.04 |
0.04 |
0.20 |
Daily log-return distribution fitting results
| Distribution | Location, a | Scale, b |
| Logistic |
-0.247 |
0.109 |
Linear regression results [Model: y=log(percentile of log-return), x=|log-return|]
| Variable | Coef(b) | s.e.(b) | t-value | P-value |
| Constant |
-0.874 |
0.040 |
-21.816 |
0.0000 |
|log-return| |
-90.753 |
2.729 |
-33.251 |
0.0000 |
I(right-tail) |
0.234 |
0.056 |
4.205 |
0.0000 |
|log-return|*I(right-tail) |
-13.035 |
3.992 |
-3.265 |
0.0011 |
Hurst exponent (of daily return price)
| 12-day | 24-day | 48-day | 96-day |
| 0.480 |
0.375 |
0.748 |
0.818 |
FSAVX
Percentile values of daily loss(gain) in per cent
| 0.5 | 1 | 5 | 10 | 25 | 50 | 75 | 90 | 95 | 99 | 99.5 |
| -0.08 |
-0.06 |
-0.03 |
-0.02 |
-0.01 |
0.00 |
0.01 |
0.03 |
0.06 |
0.07 |
1.23 |
Daily log-return distribution fitting results
| Distribution | Location, a | Scale, b |
| Laplace |
0.084 |
0.174 |
Linear regression results [Model: y=log(percentile of log-return), x=|log-return|]
| Variable | Coef(b) | s.e.(b) | t-value | P-value |
| Constant |
-0.904 |
0.039 |
-23.026 |
0.0000 |
|log-return| |
-63.070 |
1.897 |
-33.252 |
0.0000 |
I(right-tail) |
0.155 |
0.054 |
2.869 |
0.0042 |
|log-return|*I(right-tail) |
-7.380 |
2.748 |
-2.686 |
0.0073 |
Hurst exponent (of daily return price)
| 12-day | 24-day | 48-day | 96-day |
| 0.467 |
0.306 |
0.557 |
0.815 |

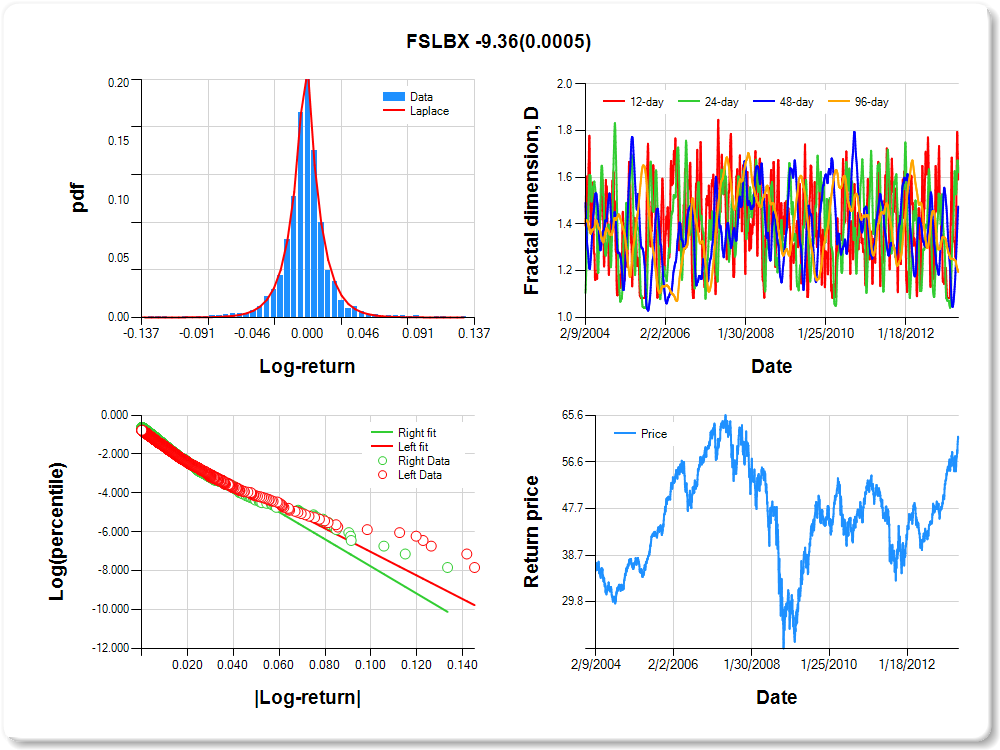
FSLBX
Percentile values of daily loss(gain) in per cent
| 0.5 | 1 | 5 | 10 | 25 | 50 | 75 | 90 | 95 | 99 | 99.5 |
| -0.07 |
-0.06 |
-0.03 |
-0.02 |
-0.01 |
0.00 |
0.01 |
0.03 |
0.06 |
0.08 |
0.87 |
Daily log-return distribution fitting results
| Distribution | Location, a | Scale, b |
| Laplace |
0.082 |
0.141 |
Linear regression results [Model: y=log(percentile of log-return), x=|log-return|]
| Variable | Coef(b) | s.e.(b) | t-value | P-value |
| Constant |
-0.977 |
0.038 |
-25.675 |
0.0000 |
|log-return| |
-60.479 |
1.846 |
-32.770 |
0.0000 |
I(right-tail) |
0.192 |
0.052 |
3.653 |
0.0003 |
|log-return|*I(right-tail) |
-9.359 |
2.698 |
-3.468 |
0.0005 |
Hurst exponent (of daily return price)
| 12-day | 24-day | 48-day | 96-day |
| 0.409 |
0.378 |
0.525 |
0.806 |
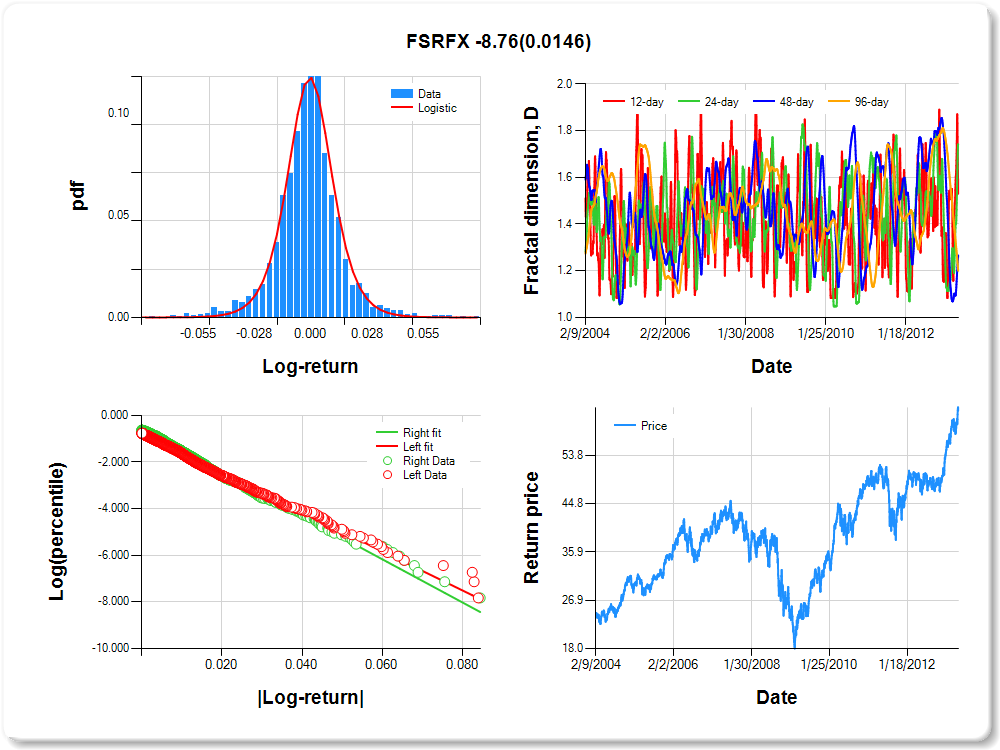
FSRFX
Percentile values of daily loss(gain) in per cent
| 0.5 | 1 | 5 | 10 | 25 | 50 | 75 | 90 | 95 | 99 | 99.5 |
| -0.05 |
-0.05 |
-0.03 |
-0.02 |
-0.01 |
0.00 |
0.01 |
0.03 |
0.05 |
0.05 |
0.27 |
Daily log-return distribution fitting results
| Distribution | Location, a | Scale, b |
| Logistic |
0.018 |
0.145 |
Linear regression results [Model: y=log(percentile of log-return), x=|log-return|]
| Variable | Coef(b) | s.e.(b) | t-value | P-value |
| Constant |
-0.795 |
0.041 |
-19.324 |
0.0000 |
|log-return| |
-83.748 |
2.492 |
-33.606 |
0.0000 |
I(right-tail) |
0.187 |
0.057 |
3.273 |
0.0011 |
|log-return|*I(right-tail) |
-8.758 |
3.583 |
-2.444 |
0.0146 |
Hurst exponent (of daily return price)
| 12-day | 24-day | 48-day | 96-day |
| 0.470 |
0.259 |
0.734 |
0.800 |
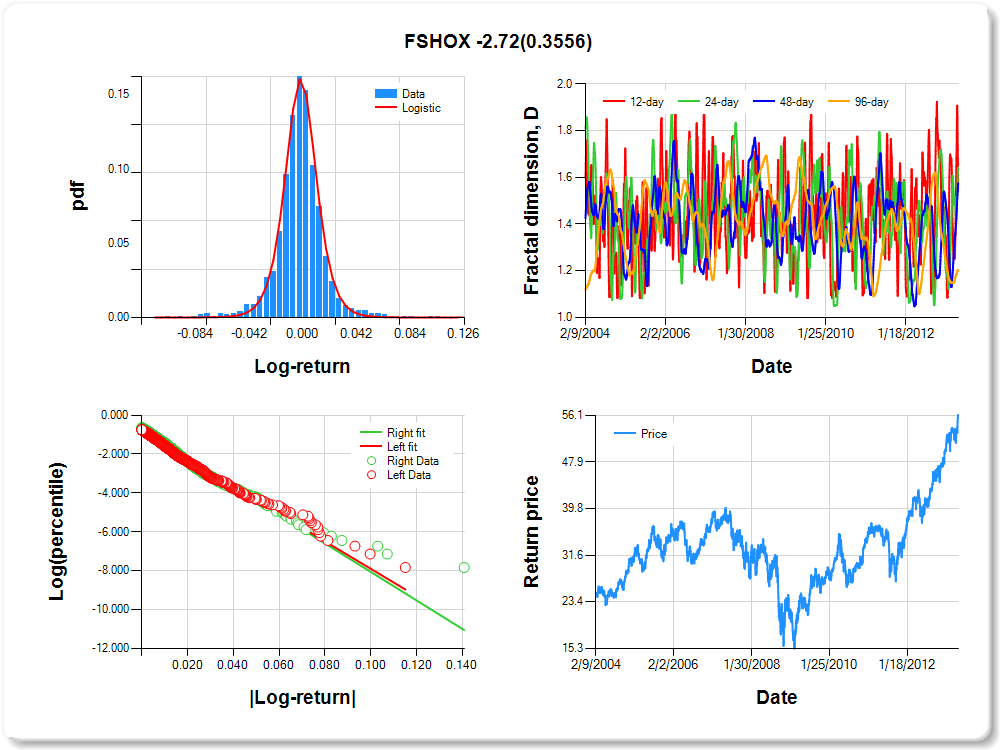
FSHOX
Percentile values of daily loss(gain) in per cent
| 0.5 | 1 | 5 | 10 | 25 | 50 | 75 | 90 | 95 | 99 | 99.5 |
| -0.07 |
-0.06 |
-0.03 |
-0.02 |
-0.01 |
0.00 |
0.01 |
0.03 |
0.06 |
0.07 |
0.95 |
Daily log-return distribution fitting results
| Distribution | Location, a | Scale, b |
| Logistic |
-0.161 |
0.107 |
Linear regression results [Model: y=log(percentile of log-return), x=|log-return|]
| Variable | Coef(b) | s.e.(b) | t-value | P-value |
| Constant |
-0.833 |
0.040 |
-21.034 |
0.0000 |
|log-return| |
-70.547 |
2.087 |
-33.809 |
0.0000 |
I(right-tail) |
0.112 |
0.055 |
2.040 |
0.0414 |
|log-return|*I(right-tail) |
-2.722 |
2.946 |
-0.924 |
0.3556 |
Hurst exponent (of daily return price)
| 12-day | 24-day | 48-day | 96-day |
| 0.459 |
0.361 |
0.425 |
0.796 |
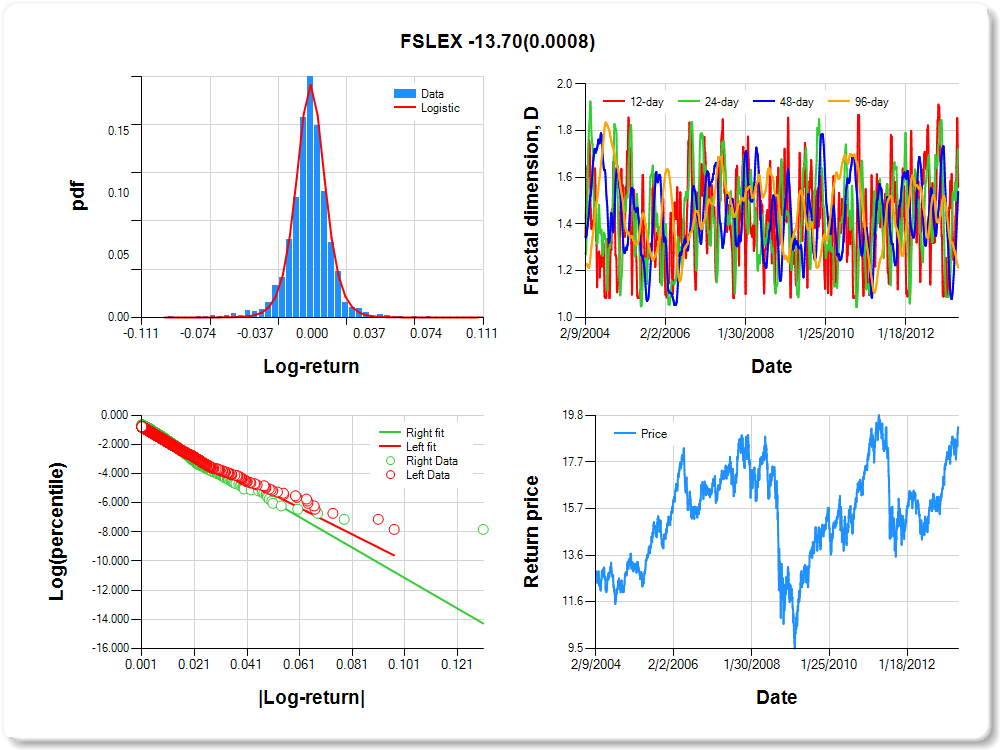
FSLEX
Percentile values of daily loss(gain) in per cent
| 0.5 | 1 | 5 | 10 | 25 | 50 | 75 | 90 | 95 | 99 | 99.5 |
| -0.05 |
-0.04 |
-0.02 |
-0.01 |
-0.01 |
0.00 |
0.01 |
0.02 |
0.04 |
0.05 |
1.06 |
Daily log-return distribution fitting results
| Distribution | Location, a | Scale, b |
| Logistic |
-0.241 |
0.091 |
Linear regression results [Model: y=log(percentile of log-return), x=|log-return|]
| Variable | Coef(b) | s.e.(b) | t-value | P-value |
| Constant |
-0.862 |
0.041 |
-21.263 |
0.0000 |
|log-return| |
-90.793 |
2.744 |
-33.089 |
0.0000 |
I(right-tail) |
0.191 |
0.057 |
3.354 |
0.0008 |
|log-return|*I(right-tail) |
-13.699 |
4.076 |
-3.361 |
0.0008 |
Hurst exponent (of daily return price)
| 12-day | 24-day | 48-day | 96-day |
| 0.442 |
0.280 |
0.461 |
0.787 |
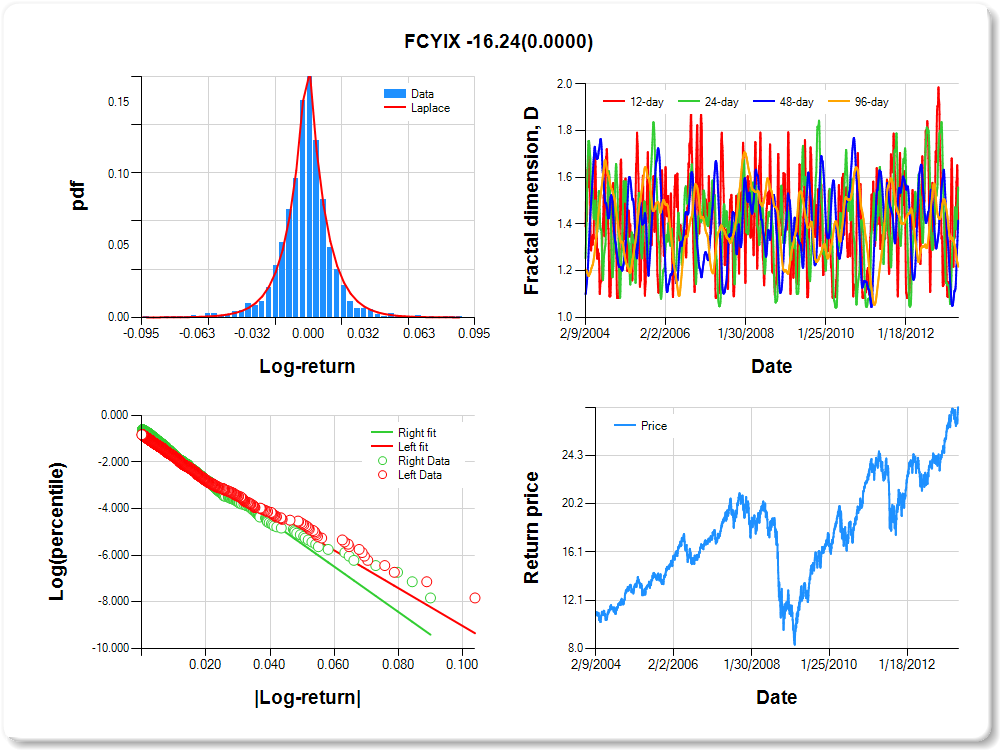
FCYIX
Percentile values of daily loss(gain) in per cent
| 0.5 | 1 | 5 | 10 | 25 | 50 | 75 | 90 | 95 | 99 | 99.5 |
| -0.05 |
-0.05 |
-0.02 |
-0.02 |
-0.01 |
0.00 |
0.01 |
0.02 |
0.04 |
0.05 |
1.10 |
Daily log-return distribution fitting results
| Distribution | Location, a | Scale, b |
| Laplace |
0.148 |
0.176 |
Linear regression results [Model: y=log(percentile of log-return), x=|log-return|]
| Variable | Coef(b) | s.e.(b) | t-value | P-value |
| Constant |
-0.925 |
0.041 |
-22.415 |
0.0000 |
|log-return| |
-80.874 |
2.504 |
-32.293 |
0.0000 |
I(right-tail) |
0.281 |
0.056 |
4.981 |
0.0000 |
|log-return|*I(right-tail) |
-16.237 |
3.685 |
-4.406 |
0.0000 |
Hurst exponent (of daily return price)
| 12-day | 24-day | 48-day | 96-day |
| 0.580 |
0.442 |
0.585 |
0.783 |
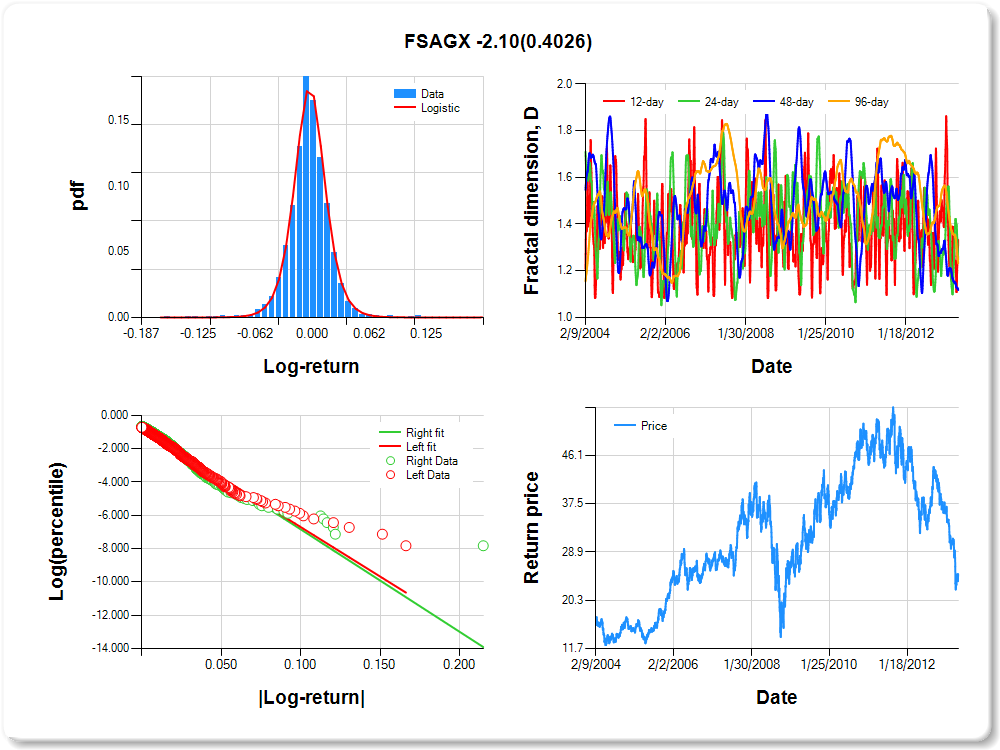
FSAGX
Percentile values of daily loss(gain) in per cent
| 0.5 | 1 | 5 | 10 | 25 | 50 | 75 | 90 | 95 | 99 | 99.5 |
| -0.08 |
-0.06 |
-0.03 |
-0.02 |
-0.01 |
0.00 |
0.01 |
0.03 |
0.06 |
0.08 |
1.06 |
Daily log-return distribution fitting results
| Distribution | Location, a | Scale, b |
| Logistic |
-0.212 |
0.097 |
Linear regression results [Model: y=log(percentile of log-return), x=|log-return|]
| Variable | Coef(b) | s.e.(b) | t-value | P-value |
| Constant |
-0.769 |
0.040 |
-19.182 |
0.0000 |
|log-return| |
-59.354 |
1.751 |
-33.895 |
0.0000 |
I(right-tail) |
0.075 |
0.057 |
1.315 |
0.1886 |
|log-return|*I(right-tail) |
-2.102 |
2.511 |
-0.837 |
0.4026 |
Hurst exponent (of daily return price)
| 12-day | 24-day | 48-day | 96-day |
| 0.668 |
0.753 |
0.882 |
0.768 |
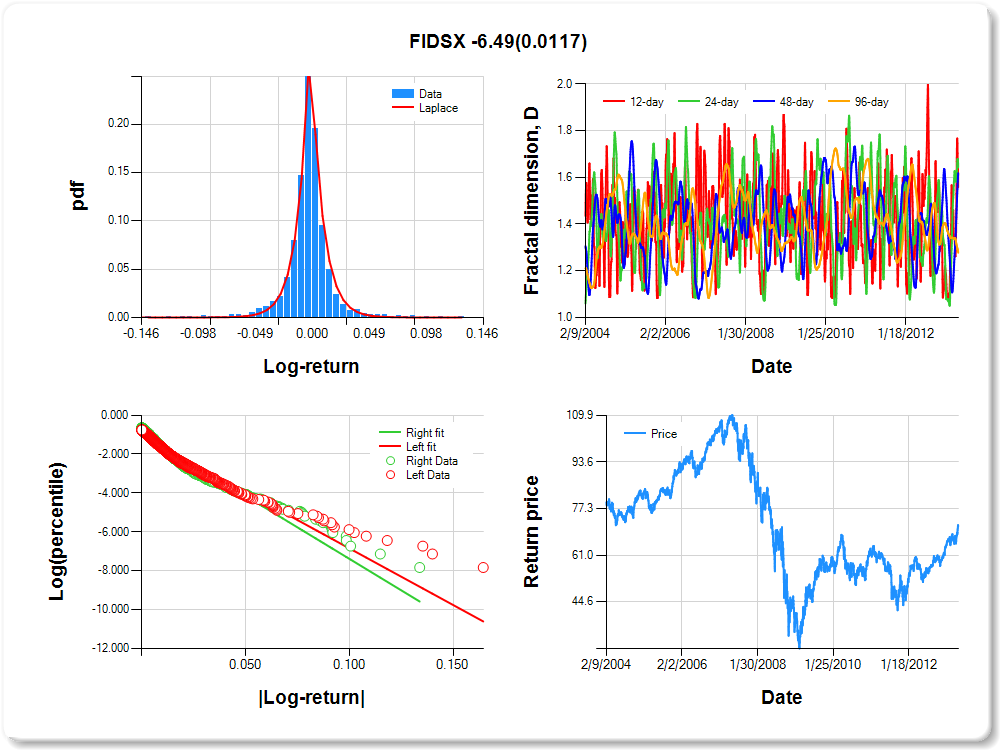
FIDSX
Percentile values of daily loss(gain) in per cent
| 0.5 | 1 | 5 | 10 | 25 | 50 | 75 | 90 | 95 | 99 | 99.5 |
| -0.08 |
-0.06 |
-0.03 |
-0.02 |
-0.01 |
0.00 |
0.01 |
0.03 |
0.06 |
0.08 |
0.28 |
Daily log-return distribution fitting results
| Distribution | Location, a | Scale, b |
| Laplace |
0.188 |
0.116 |
Linear regression results [Model: y=log(percentile of log-return), x=|log-return|]
| Variable | Coef(b) | s.e.(b) | t-value | P-value |
| Constant |
-1.018 |
0.037 |
-27.764 |
0.0000 |
|log-return| |
-58.262 |
1.771 |
-32.904 |
0.0000 |
I(right-tail) |
0.112 |
0.051 |
2.203 |
0.0277 |
|log-return|*I(right-tail) |
-6.491 |
2.573 |
-2.523 |
0.0117 |
Hurst exponent (of daily return price)
| 12-day | 24-day | 48-day | 96-day |
| 0.441 |
0.356 |
0.382 |
0.723 |
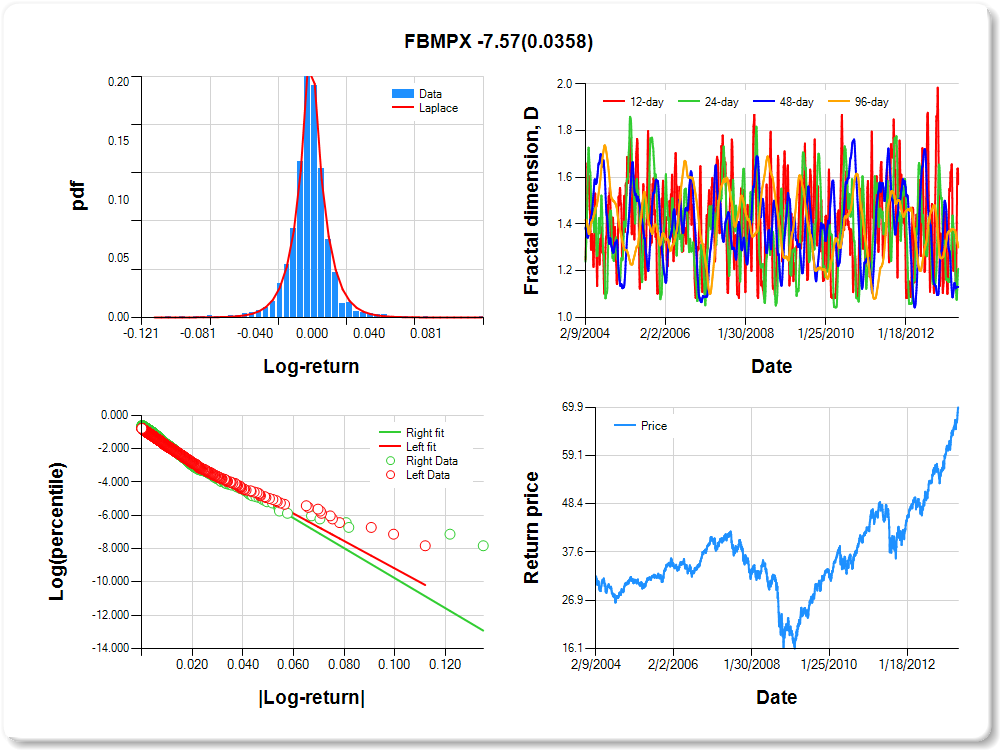
FBMPX
Percentile values of daily loss(gain) in per cent
| 0.5 | 1 | 5 | 10 | 25 | 50 | 75 | 90 | 95 | 99 | 99.5 |
| -0.05 |
-0.04 |
-0.02 |
-0.01 |
-0.01 |
0.00 |
0.01 |
0.02 |
0.04 |
0.05 |
0.30 |
Daily log-return distribution fitting results
| Distribution | Location, a | Scale, b |
| Laplace |
-0.141 |
0.130 |
Linear regression results [Model: y=log(percentile of log-return), x=|log-return|]
| Variable | Coef(b) | s.e.(b) | t-value | P-value |
| Constant |
-0.946 |
0.039 |
-24.112 |
0.0000 |
|log-return| |
-82.396 |
2.518 |
-32.719 |
0.0000 |
I(right-tail) |
0.177 |
0.054 |
3.293 |
0.0010 |
|log-return|*I(right-tail) |
-7.566 |
3.603 |
-2.100 |
0.0358 |
Hurst exponent (of daily return price)
| 12-day | 24-day | 48-day | 96-day |
| 0.429 |
0.791 |
0.869 |
0.700 |
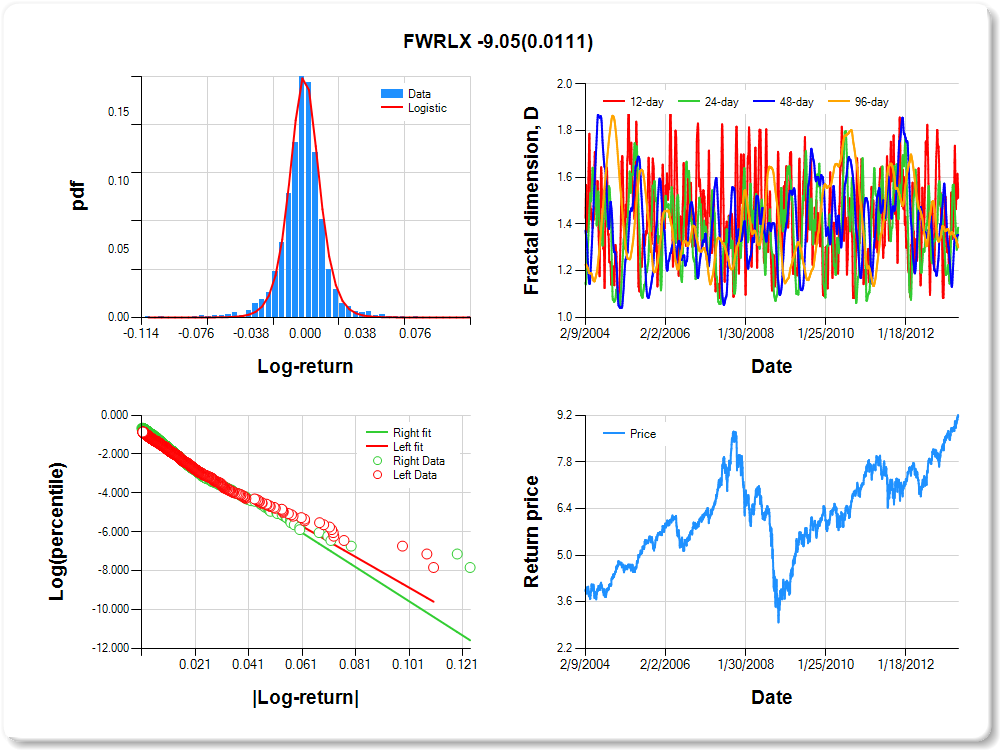
FWRLX
Percentile values of daily loss(gain) in per cent
| 0.5 | 1 | 5 | 10 | 25 | 50 | 75 | 90 | 95 | 99 | 99.5 |
| -0.06 |
-0.05 |
-0.02 |
-0.02 |
-0.01 |
0.00 |
0.01 |
0.02 |
0.05 |
0.06 |
0.05 |
Daily log-return distribution fitting results
| Distribution | Location, a | Scale, b |
| Logistic |
-0.083 |
0.097 |
Linear regression results [Model: y=log(percentile of log-return), x=|log-return|]
| Variable | Coef(b) | s.e.(b) | t-value | P-value |
| Constant |
-0.922 |
0.043 |
-21.590 |
0.0000 |
|log-return| |
-78.886 |
2.495 |
-31.616 |
0.0000 |
I(right-tail) |
0.211 |
0.058 |
3.636 |
0.0003 |
|log-return|*I(right-tail) |
-9.051 |
3.563 |
-2.540 |
0.0111 |
Hurst exponent (of daily return price)
| 12-day | 24-day | 48-day | 96-day |
| 0.488 |
0.615 |
0.646 |
0.700 |
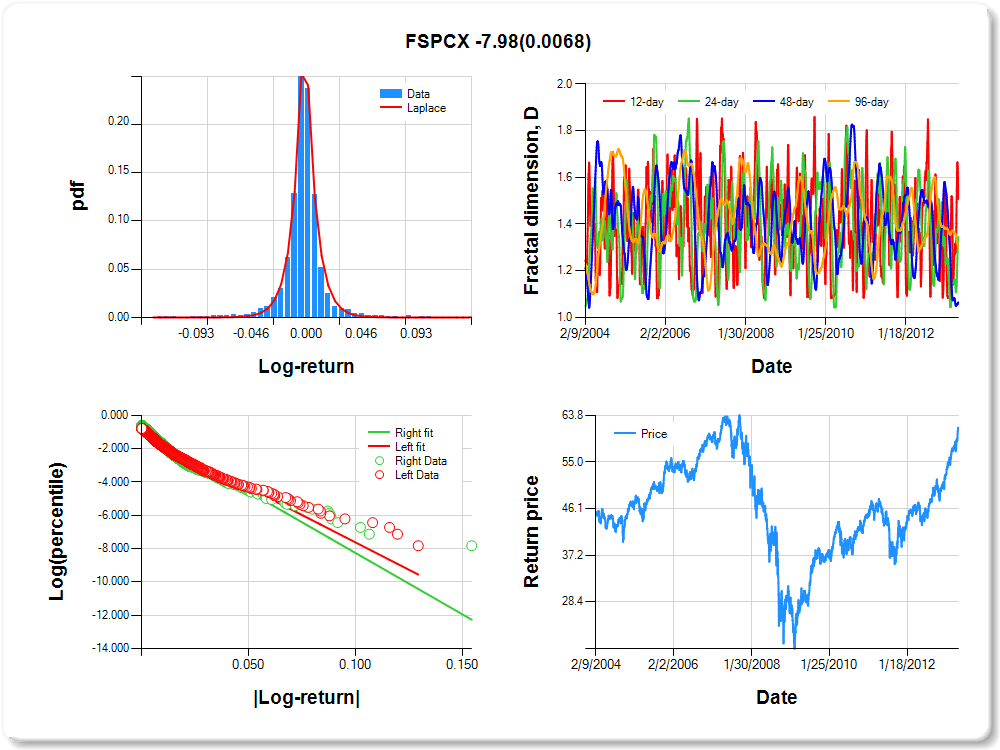
FSPCX
Percentile values of daily loss(gain) in per cent
| 0.5 | 1 | 5 | 10 | 25 | 50 | 75 | 90 | 95 | 99 | 99.5 |
| -0.07 |
-0.06 |
-0.02 |
-0.01 |
-0.01 |
0.00 |
0.01 |
0.02 |
0.05 |
0.07 |
1.61 |
Daily log-return distribution fitting results
| Distribution | Location, a | Scale, b |
| Laplace |
-0.140 |
0.103 |
Linear regression results [Model: y=log(percentile of log-return), x=|log-return|]
| Variable | Coef(b) | s.e.(b) | t-value | P-value |
| Constant |
-1.058 |
0.037 |
-28.232 |
0.0000 |
|log-return| |
-65.697 |
2.038 |
-32.232 |
0.0000 |
I(right-tail) |
0.164 |
0.051 |
3.234 |
0.0012 |
|log-return|*I(right-tail) |
-7.977 |
2.942 |
-2.711 |
0.0068 |
Hurst exponent (of daily return price)
| 12-day | 24-day | 48-day | 96-day |
| 0.493 |
0.655 |
0.935 |
0.699 |
FSCGX
Percentile values of daily loss(gain) in per cent
| 0.5 | 1 | 5 | 10 | 25 | 50 | 75 | 90 | 95 | 99 | 99.5 |
| -0.06 |
-0.05 |
-0.02 |
-0.02 |
-0.01 |
0.00 |
0.01 |
0.02 |
0.04 |
0.06 |
0.85 |
Daily log-return distribution fitting results
| Distribution | Location, a | Scale, b |
| Logistic |
0.154 |
0.111 |
Linear regression results [Model: y=log(percentile of log-return), x=|log-return|]
| Variable | Coef(b) | s.e.(b) | t-value | P-value |
| Constant |
-0.907 |
0.040 |
-22.669 |
0.0000 |
|log-return| |
-78.418 |
2.381 |
-32.935 |
0.0000 |
I(right-tail) |
0.245 |
0.055 |
4.440 |
0.0000 |
|log-return|*I(right-tail) |
-14.611 |
3.519 |
-4.152 |
0.0000 |
Hurst exponent (of daily return price)
| 12-day | 24-day | 48-day | 96-day |
| 0.587 |
0.536 |
0.512 |
0.693 |

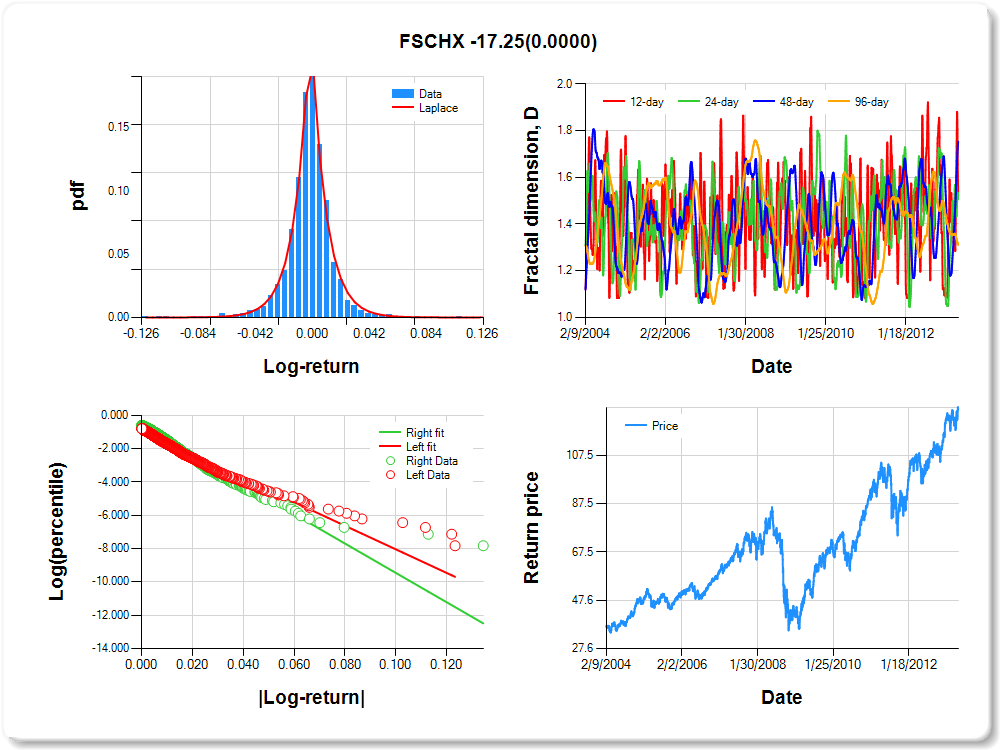
FSCHX
Percentile values of daily loss(gain) in per cent
| 0.5 | 1 | 5 | 10 | 25 | 50 | 75 | 90 | 95 | 99 | 99.5 |
| -0.06 |
-0.05 |
-0.02 |
-0.02 |
-0.01 |
0.00 |
0.01 |
0.02 |
0.04 |
0.05 |
1.07 |
Daily log-return distribution fitting results
| Distribution | Location, a | Scale, b |
| Laplace |
-0.059 |
0.147 |
Linear regression results [Model: y=log(percentile of log-return), x=|log-return|]
| Variable | Coef(b) | s.e.(b) | t-value | P-value |
| Constant |
-0.968 |
0.040 |
-24.477 |
0.0000 |
|log-return| |
-70.719 |
2.184 |
-32.378 |
0.0000 |
I(right-tail) |
0.315 |
0.055 |
5.753 |
0.0000 |
|log-return|*I(right-tail) |
-17.251 |
3.282 |
-5.256 |
0.0000 |
Hurst exponent (of daily return price)
| 12-day | 24-day | 48-day | 96-day |
| 0.477 |
0.493 |
0.246 |
0.689 |
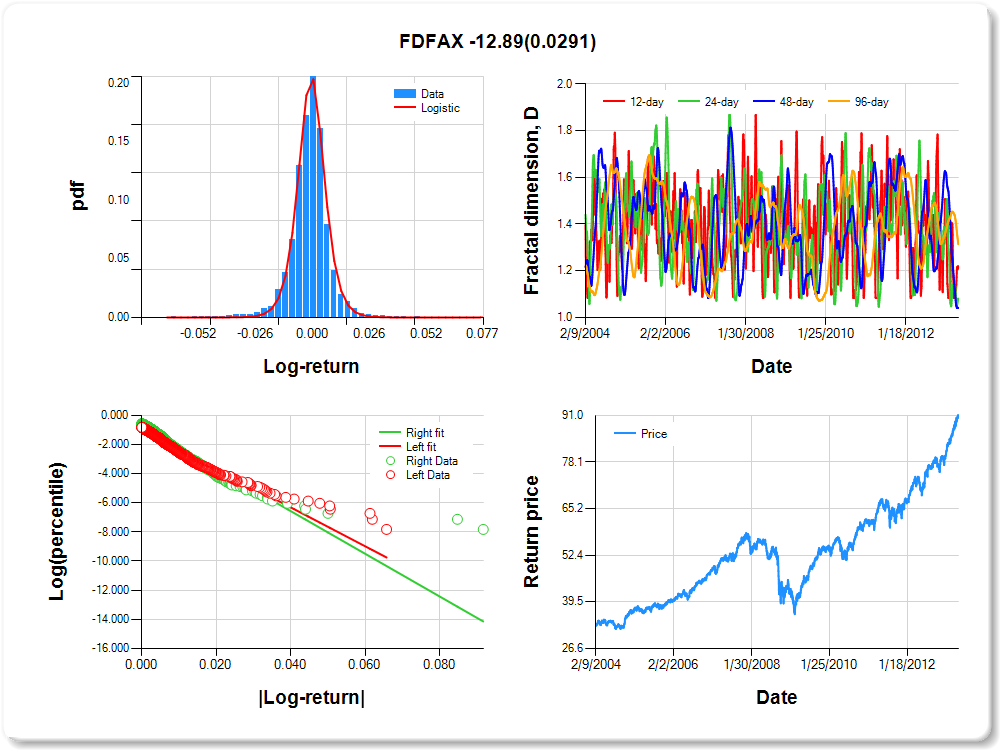
FDFAX
Percentile values of daily loss(gain) in per cent
| 0.5 | 1 | 5 | 10 | 25 | 50 | 75 | 90 | 95 | 99 | 99.5 |
| -0.03 |
-0.03 |
-0.01 |
-0.01 |
0.00 |
0.00 |
0.01 |
0.01 |
0.02 |
0.03 |
1.10 |
Daily log-return distribution fitting results
| Distribution | Location, a | Scale, b |
| Logistic |
-0.260 |
0.083 |
Linear regression results [Model: y=log(percentile of log-return), x=|log-return|]
| Variable | Coef(b) | s.e.(b) | t-value | P-value |
| Constant |
-0.967 |
0.041 |
-23.795 |
0.0000 |
|log-return| |
-133.403 |
4.189 |
-31.843 |
0.0000 |
I(right-tail) |
0.261 |
0.055 |
4.767 |
0.0000 |
|log-return|*I(right-tail) |
-12.893 |
5.907 |
-2.183 |
0.0291 |
Hurst exponent (of daily return price)
| 12-day | 24-day | 48-day | 96-day |
| 0.788 |
0.919 |
0.958 |
0.686 |
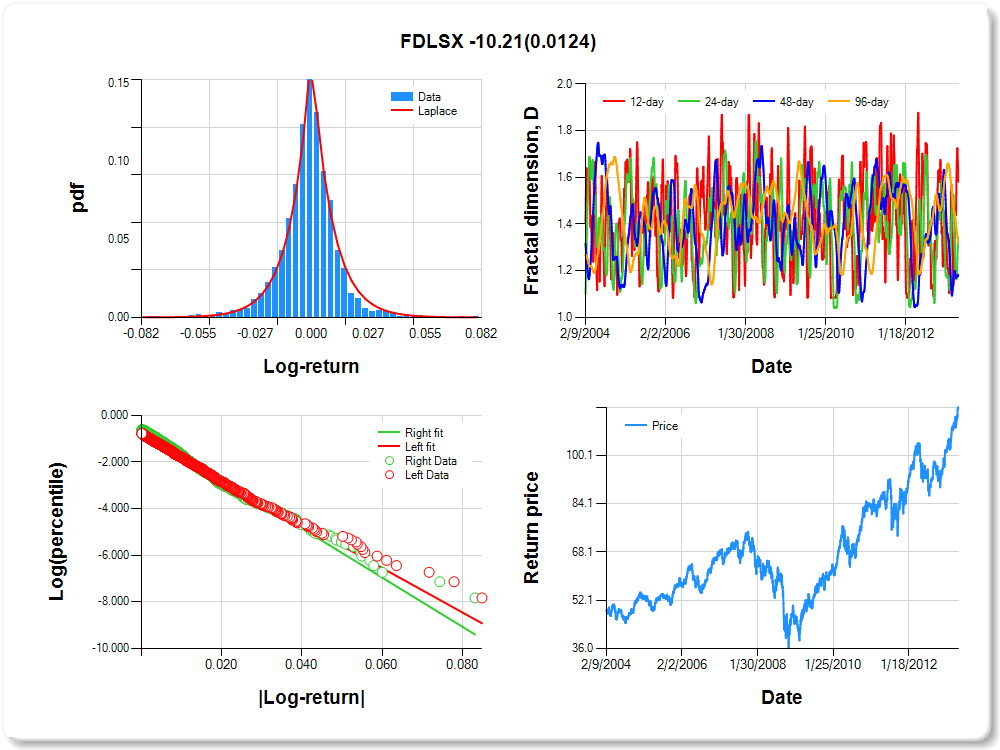
FDLSX
Percentile values of daily loss(gain) in per cent
| 0.5 | 1 | 5 | 10 | 25 | 50 | 75 | 90 | 95 | 99 | 99.5 |
| -0.05 |
-0.04 |
-0.02 |
-0.02 |
-0.01 |
0.00 |
0.01 |
0.02 |
0.04 |
0.05 |
0.40 |
Daily log-return distribution fitting results
| Distribution | Location, a | Scale, b |
| Laplace |
0.047 |
0.199 |
Linear regression results [Model: y=log(percentile of log-return), x=|log-return|]
| Variable | Coef(b) | s.e.(b) | t-value | P-value |
| Constant |
-0.841 |
0.041 |
-20.585 |
0.0000 |
|log-return| |
-95.043 |
2.853 |
-33.308 |
0.0000 |
I(right-tail) |
0.205 |
0.056 |
3.643 |
0.0003 |
|log-return|*I(right-tail) |
-10.209 |
4.081 |
-2.501 |
0.0124 |
Hurst exponent (of daily return price)
| 12-day | 24-day | 48-day | 96-day |
| 0.419 |
0.657 |
0.817 |
0.680 |
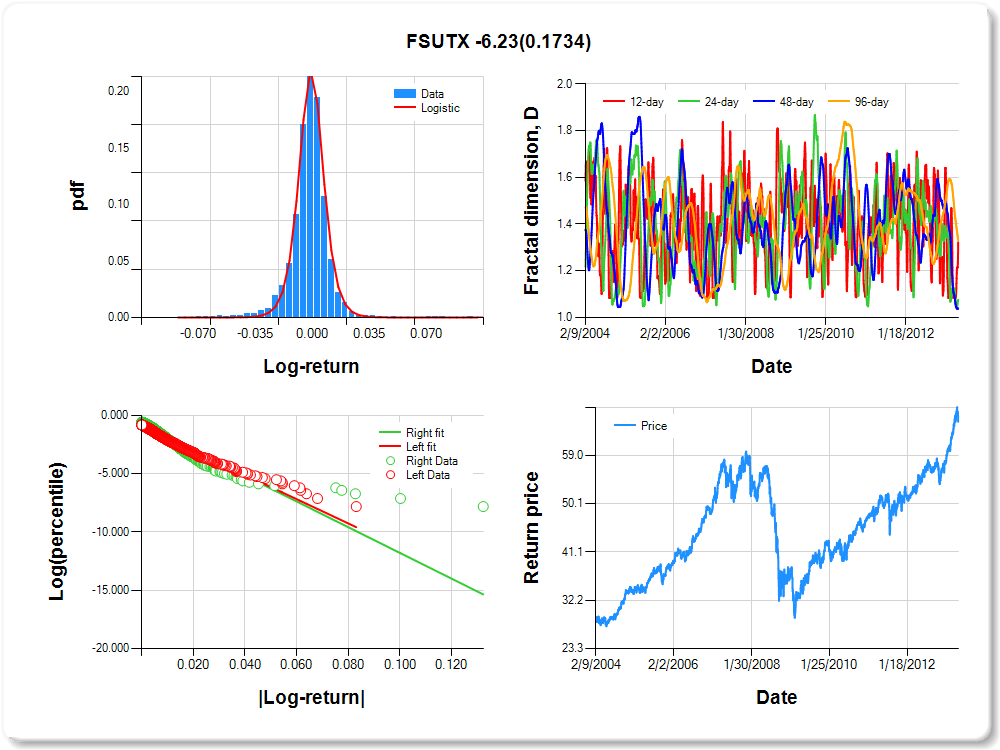
FSUTX
Percentile values of daily loss(gain) in per cent
| 0.5 | 1 | 5 | 10 | 25 | 50 | 75 | 90 | 95 | 99 | 99.5 |
| -0.04 |
-0.04 |
-0.02 |
-0.01 |
0.00 |
0.00 |
0.01 |
0.02 |
0.03 |
0.04 |
1.19 |
Daily log-return distribution fitting results
| Distribution | Location, a | Scale, b |
| Logistic |
-0.370 |
0.078 |
Linear regression results [Model: y=log(percentile of log-return), x=|log-return|]
| Variable | Coef(b) | s.e.(b) | t-value | P-value |
| Constant |
-0.942 |
0.041 |
-23.059 |
0.0000 |
|log-return| |
-104.008 |
3.226 |
-32.244 |
0.0000 |
I(right-tail) |
0.178 |
0.055 |
3.257 |
0.0011 |
|log-return|*I(right-tail) |
-6.230 |
4.574 |
-1.362 |
0.1734 |
Hurst exponent (of daily return price)
| 12-day | 24-day | 48-day | 96-day |
| 0.678 |
0.924 |
0.962 |
0.671 |
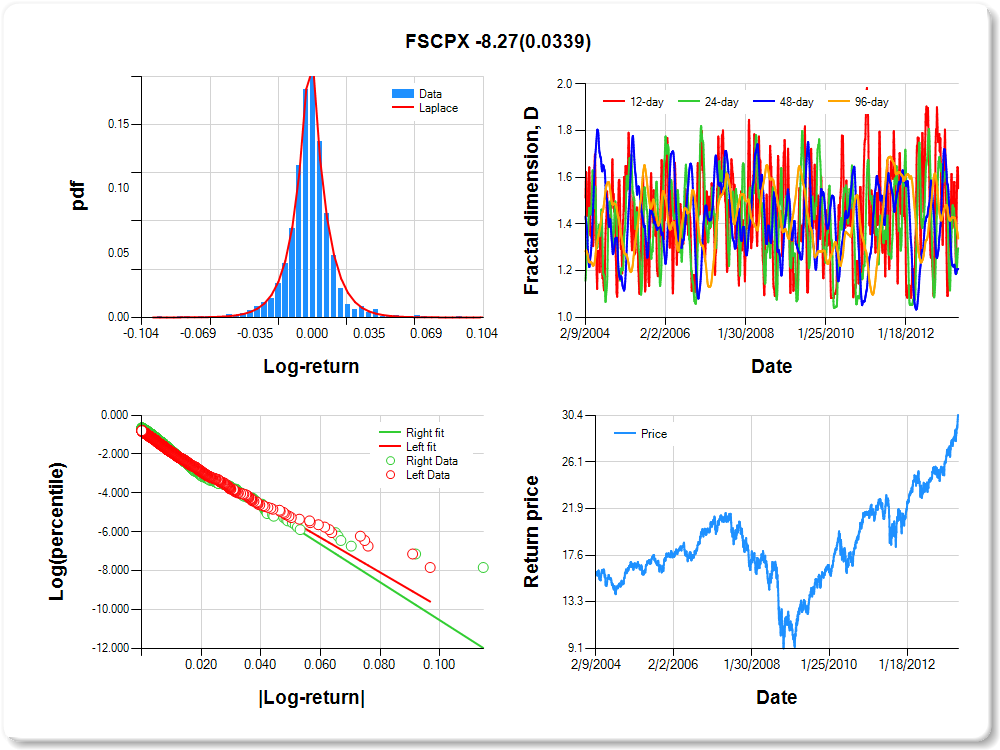
FSCPX
Percentile values of daily loss(gain) in per cent
| 0.5 | 1 | 5 | 10 | 25 | 50 | 75 | 90 | 95 | 99 | 99.5 |
| -0.05 |
-0.04 |
-0.02 |
-0.01 |
-0.01 |
0.00 |
0.01 |
0.02 |
0.04 |
0.05 |
0.50 |
Daily log-return distribution fitting results
| Distribution | Location, a | Scale, b |
| Laplace |
-0.130 |
0.147 |
Linear regression results [Model: y=log(percentile of log-return), x=|log-return|]
| Variable | Coef(b) | s.e.(b) | t-value | P-value |
| Constant |
-0.900 |
0.040 |
-22.409 |
0.0000 |
|log-return| |
-89.417 |
2.717 |
-32.906 |
0.0000 |
I(right-tail) |
0.160 |
0.055 |
2.887 |
0.0039 |
|log-return|*I(right-tail) |
-8.275 |
3.898 |
-2.123 |
0.0339 |
Hurst exponent (of daily return price)
| 12-day | 24-day | 48-day | 96-day |
| 0.447 |
0.704 |
0.792 |
0.662 |
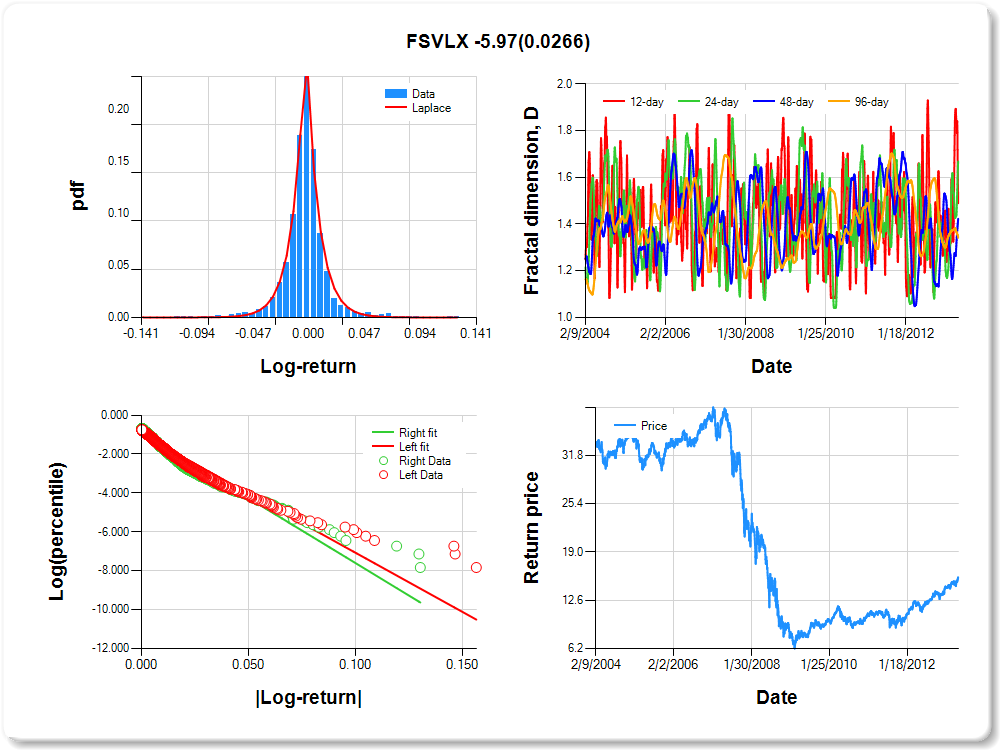
FSVLX
Percentile values of daily loss(gain) in per cent
| 0.5 | 1 | 5 | 10 | 25 | 50 | 75 | 90 | 95 | 99 | 99.5 |
| -0.07 |
-0.06 |
-0.03 |
-0.02 |
-0.01 |
0.00 |
0.01 |
0.03 |
0.06 |
0.07 |
0.73 |
Daily log-return distribution fitting results
| Distribution | Location, a | Scale, b |
| Laplace |
0.158 |
0.126 |
Linear regression results [Model: y=log(percentile of log-return), x=|log-return|]
| Variable | Coef(b) | s.e.(b) | t-value | P-value |
| Constant |
-0.978 |
0.037 |
-26.334 |
0.0000 |
|log-return| |
-60.849 |
1.844 |
-32.991 |
0.0000 |
I(right-tail) |
0.066 |
0.052 |
1.279 |
0.2009 |
|log-return|*I(right-tail) |
-5.965 |
2.689 |
-2.219 |
0.0266 |
Hurst exponent (of daily return price)
| 12-day | 24-day | 48-day | 96-day |
| 0.510 |
0.332 |
0.577 |
0.659 |
FBSOX
Percentile values of daily loss(gain) in per cent
| 0.5 | 1 | 5 | 10 | 25 | 50 | 75 | 90 | 95 | 99 | 99.5 |
| -0.05 |
-0.04 |
-0.02 |
-0.01 |
-0.01 |
0.00 |
0.01 |
0.02 |
0.04 |
0.05 |
0.13 |
Daily log-return distribution fitting results
| Distribution | Location, a | Scale, b |
| Laplace |
-0.086 |
0.153 |
Linear regression results [Model: y=log(percentile of log-return), x=|log-return|]
| Variable | Coef(b) | s.e.(b) | t-value | P-value |
| Constant |
-0.895 |
0.041 |
-21.652 |
0.0000 |
|log-return| |
-91.790 |
2.831 |
-32.422 |
0.0000 |
I(right-tail) |
0.197 |
0.056 |
3.498 |
0.0005 |
|log-return|*I(right-tail) |
-7.069 |
3.987 |
-1.773 |
0.0763 |
Hurst exponent (of daily return price)
| 12-day | 24-day | 48-day | 96-day |
| 0.629 |
0.492 |
0.637 |
0.655 |

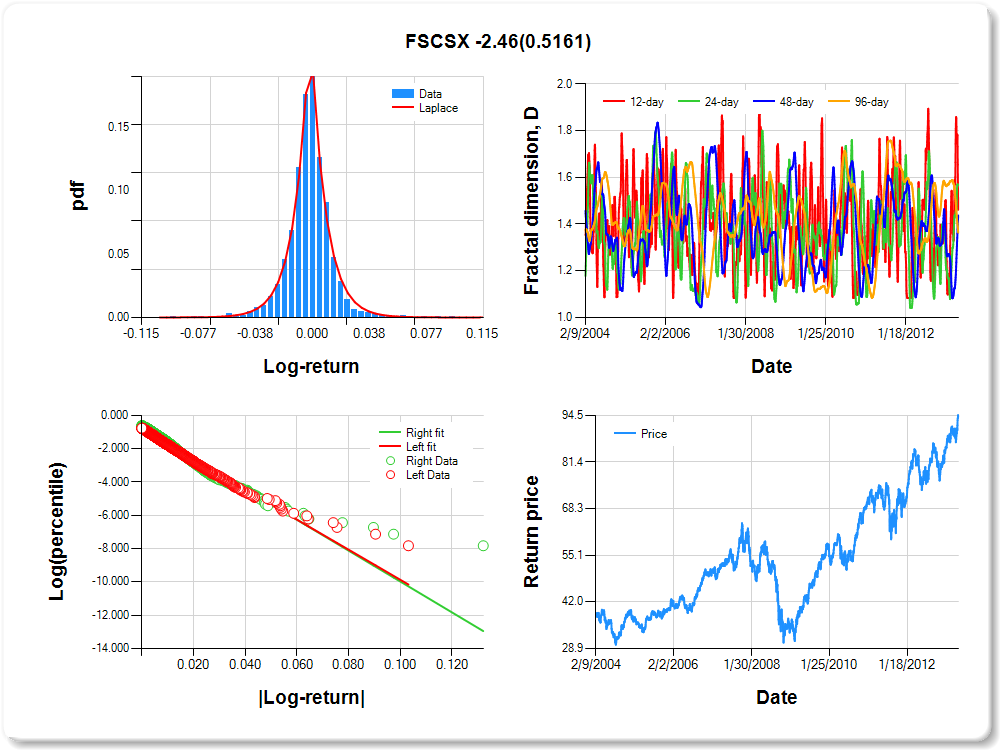
FSCSX
Percentile values of daily loss(gain) in per cent
| 0.5 | 1 | 5 | 10 | 25 | 50 | 75 | 90 | 95 | 99 | 99.5 |
| -0.05 |
-0.04 |
-0.02 |
-0.02 |
-0.01 |
0.00 |
0.01 |
0.02 |
0.04 |
0.05 |
0.50 |
Daily log-return distribution fitting results
| Distribution | Location, a | Scale, b |
| Laplace |
-0.199 |
0.148 |
Linear regression results [Model: y=log(percentile of log-return), x=|log-return|]
| Variable | Coef(b) | s.e.(b) | t-value | P-value |
| Constant |
-0.844 |
0.041 |
-20.801 |
0.0000 |
|log-return| |
-90.237 |
2.712 |
-33.270 |
0.0000 |
I(right-tail) |
0.142 |
0.056 |
2.548 |
0.0109 |
|log-return|*I(right-tail) |
-2.456 |
3.781 |
-0.650 |
0.5161 |
Hurst exponent (of daily return price)
| 12-day | 24-day | 48-day | 96-day |
| 0.539 |
0.432 |
0.563 |
0.637 |
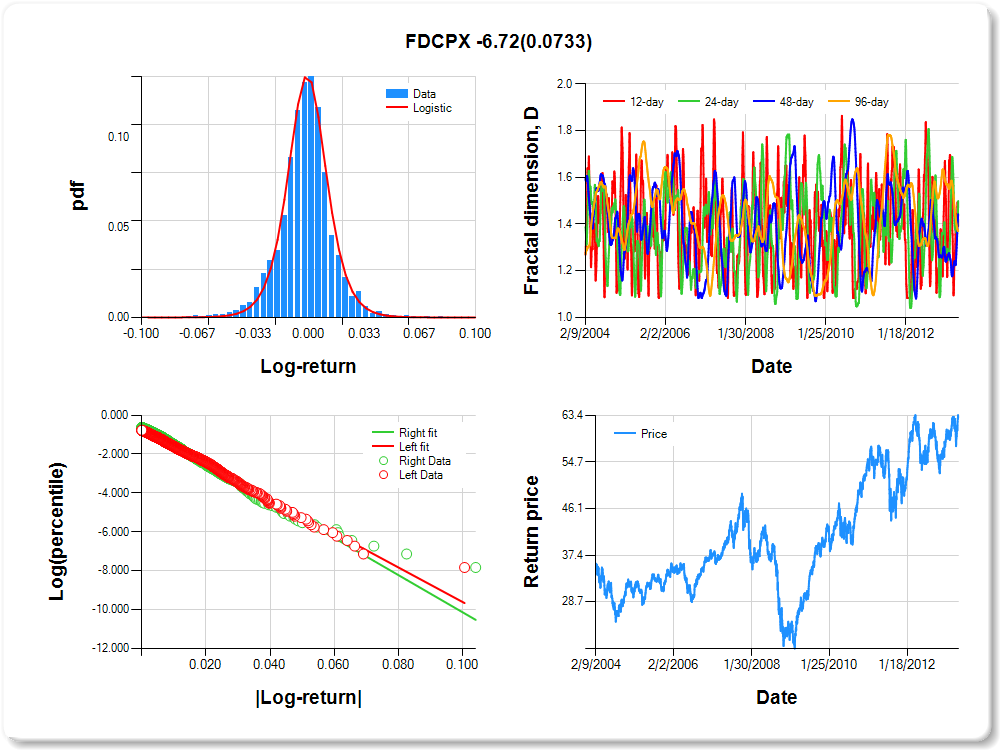
FDCPX
Percentile values of daily loss(gain) in per cent
| 0.5 | 1 | 5 | 10 | 25 | 50 | 75 | 90 | 95 | 99 | 99.5 |
| -0.05 |
-0.04 |
-0.03 |
-0.02 |
-0.01 |
0.00 |
0.01 |
0.02 |
0.04 |
0.05 |
1.85 |
Daily log-return distribution fitting results
| Distribution | Location, a | Scale, b |
| Logistic |
-0.010 |
0.128 |
Linear regression results [Model: y=log(percentile of log-return), x=|log-return|]
| Variable | Coef(b) | s.e.(b) | t-value | P-value |
| Constant |
-0.714 |
0.043 |
-16.577 |
0.0000 |
|log-return| |
-88.795 |
2.649 |
-33.524 |
0.0000 |
I(right-tail) |
0.146 |
0.059 |
2.476 |
0.0134 |
|log-return|*I(right-tail) |
-6.721 |
3.752 |
-1.791 |
0.0733 |
Hurst exponent (of daily return price)
| 12-day | 24-day | 48-day | 96-day |
| 0.608 |
0.501 |
0.557 |
0.629 |
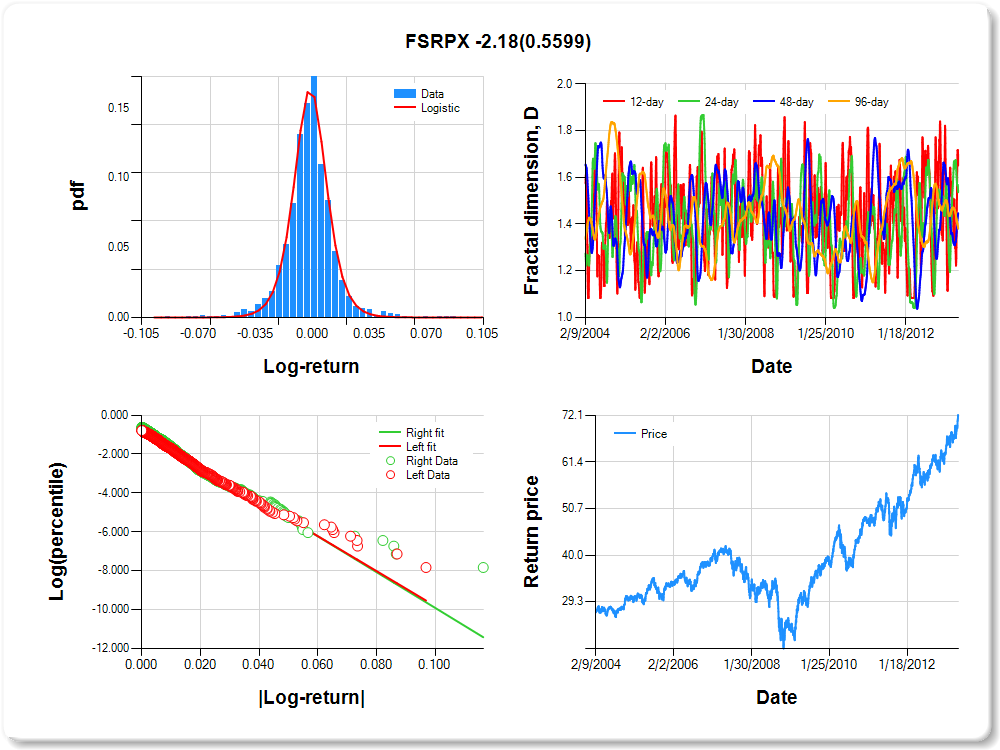
FSRPX
Percentile values of daily loss(gain) in per cent
| 0.5 | 1 | 5 | 10 | 25 | 50 | 75 | 90 | 95 | 99 | 99.5 |
| -0.05 |
-0.04 |
-0.02 |
-0.02 |
-0.01 |
0.00 |
0.01 |
0.02 |
0.05 |
0.05 |
-0.22 |
Daily log-return distribution fitting results
| Distribution | Location, a | Scale, b |
| Logistic |
-0.144 |
0.104 |
Linear regression results [Model: y=log(percentile of log-return), x=|log-return|]
| Variable | Coef(b) | s.e.(b) | t-value | P-value |
| Constant |
-0.819 |
0.042 |
-19.694 |
0.0000 |
|log-return| |
-89.815 |
2.713 |
-33.111 |
0.0000 |
I(right-tail) |
0.121 |
0.056 |
2.165 |
0.0305 |
|log-return|*I(right-tail) |
-2.182 |
3.743 |
-0.583 |
0.5599 |
Hurst exponent (of daily return price)
| 12-day | 24-day | 48-day | 96-day |
| 0.349 |
0.463 |
0.553 |
0.620 |
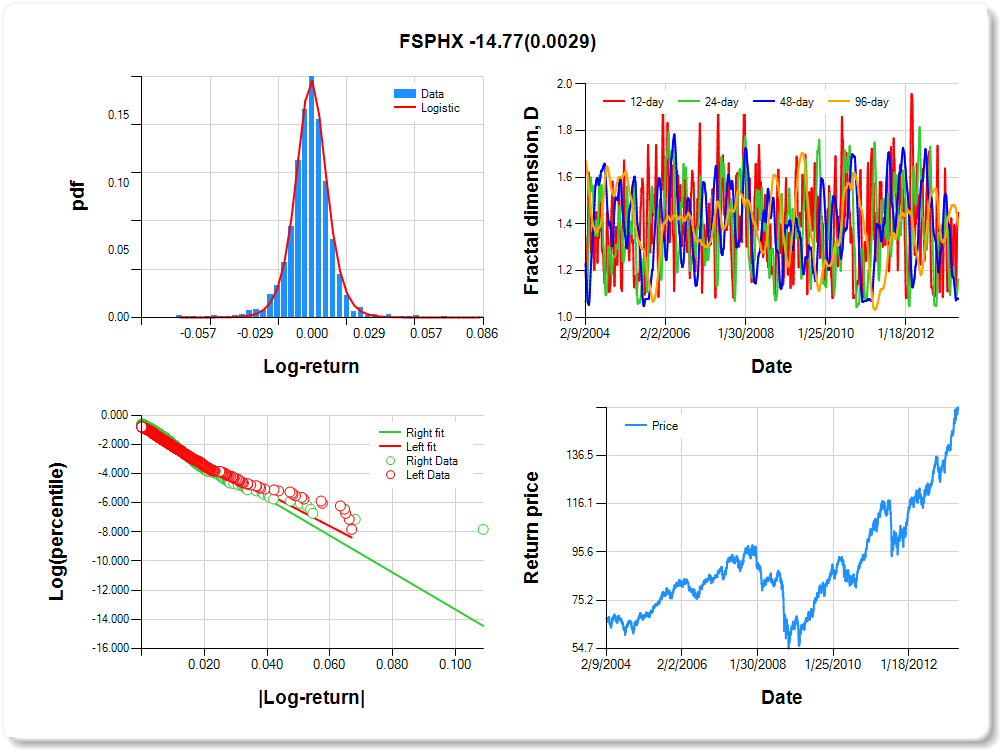
FSPHX
Percentile values of daily loss(gain) in per cent
| 0.5 | 1 | 5 | 10 | 25 | 50 | 75 | 90 | 95 | 99 | 99.5 |
| -0.05 |
-0.03 |
-0.02 |
-0.01 |
0.00 |
0.00 |
0.01 |
0.02 |
0.03 |
0.04 |
0.35 |
Daily log-return distribution fitting results
| Distribution | Location, a | Scale, b |
| Logistic |
-0.387 |
0.097 |
Linear regression results [Model: y=log(percentile of log-return), x=|log-return|]
| Variable | Coef(b) | s.e.(b) | t-value | P-value |
| Constant |
-0.899 |
0.041 |
-22.209 |
0.0000 |
|log-return| |
-111.801 |
3.429 |
-32.601 |
0.0000 |
I(right-tail) |
0.240 |
0.056 |
4.312 |
0.0000 |
|log-return|*I(right-tail) |
-14.770 |
4.958 |
-2.979 |
0.0029 |
Hurst exponent (of daily return price)
| 12-day | 24-day | 48-day | 96-day |
| 0.552 |
0.837 |
0.919 |
0.606 |
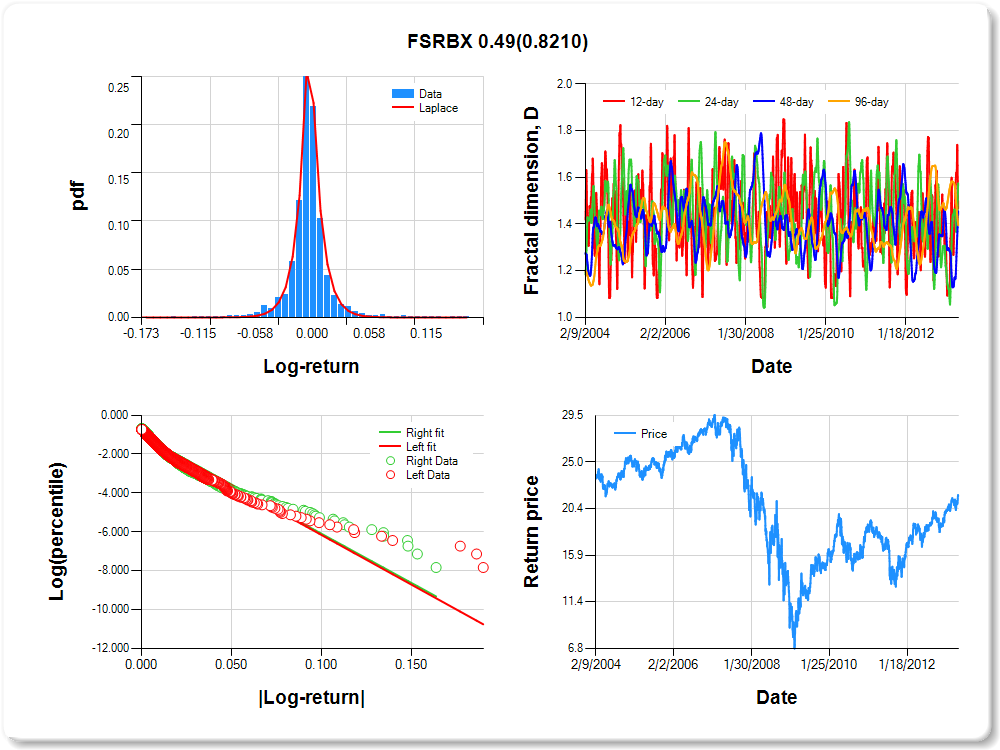
FSRBX
Percentile values of daily loss(gain) in per cent
| 0.5 | 1 | 5 | 10 | 25 | 50 | 75 | 90 | 95 | 99 | 99.5 |
| -0.08 |
-0.06 |
-0.03 |
-0.02 |
-0.01 |
0.00 |
0.01 |
0.03 |
0.08 |
0.10 |
1.45 |
Daily log-return distribution fitting results
| Distribution | Location, a | Scale, b |
| Laplace |
0.131 |
0.098 |
Linear regression results [Model: y=log(percentile of log-return), x=|log-return|]
| Variable | Coef(b) | s.e.(b) | t-value | P-value |
| Constant |
-1.040 |
0.036 |
-29.292 |
0.0000 |
|log-return| |
-51.179 |
1.558 |
-32.843 |
0.0000 |
I(right-tail) |
0.014 |
0.050 |
0.285 |
0.7755 |
|log-return|*I(right-tail) |
0.493 |
2.178 |
0.226 |
0.8210 |
Hurst exponent (of daily return price)
| 12-day | 24-day | 48-day | 96-day |
| 0.533 |
0.425 |
0.545 |
0.605 |
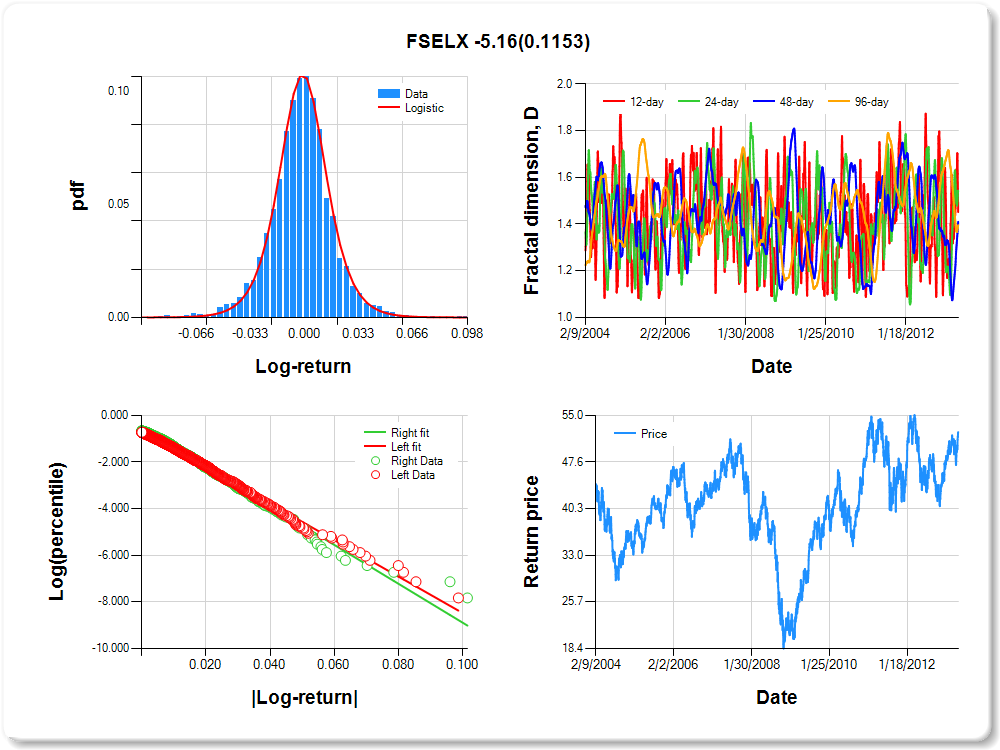
FSELX
Percentile values of daily loss(gain) in per cent
| 0.5 | 1 | 5 | 10 | 25 | 50 | 75 | 90 | 95 | 99 | 99.5 |
| -0.06 |
-0.05 |
-0.03 |
-0.02 |
-0.01 |
0.00 |
0.01 |
0.03 |
0.05 |
0.05 |
0.39 |
Daily log-return distribution fitting results
| Distribution | Location, a | Scale, b |
| Logistic |
-0.009 |
0.159 |
Linear regression results [Model: y=log(percentile of log-return), x=|log-return|]
| Variable | Coef(b) | s.e.(b) | t-value | P-value |
| Constant |
-0.649 |
0.042 |
-15.274 |
0.0000 |
|log-return| |
-78.122 |
2.274 |
-34.355 |
0.0000 |
I(right-tail) |
0.105 |
0.060 |
1.742 |
0.0816 |
|log-return|*I(right-tail) |
-5.163 |
3.278 |
-1.575 |
0.1153 |
Hurst exponent (of daily return price)
| 12-day | 24-day | 48-day | 96-day |
| 0.549 |
0.460 |
0.590 |
0.604 |
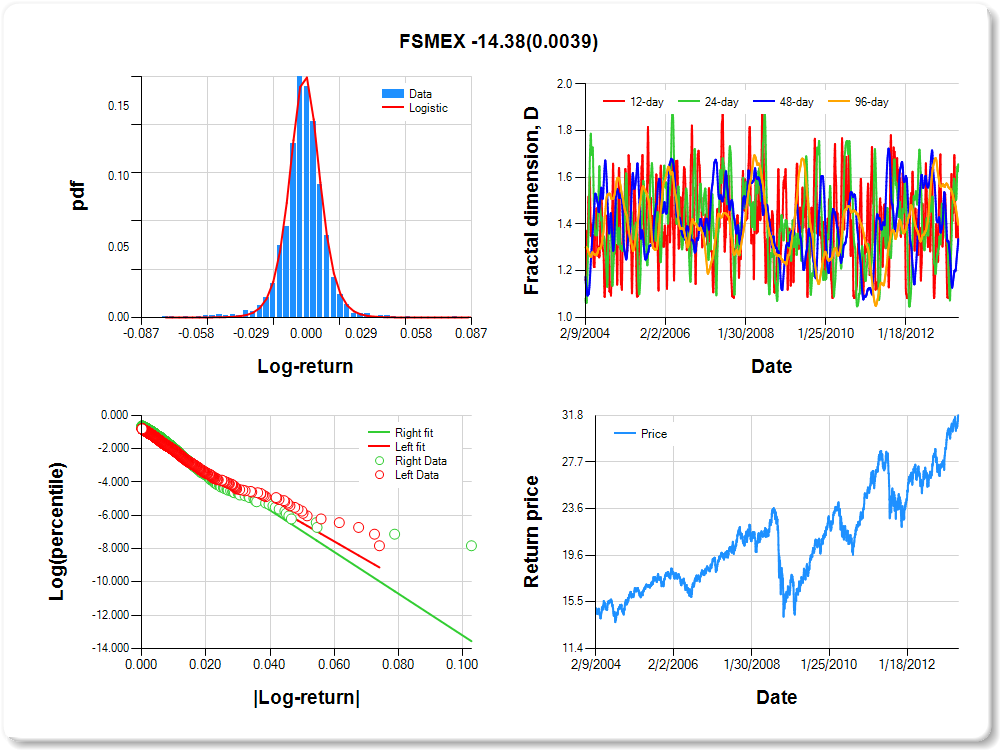
FSMEX
Percentile values of daily loss(gain) in per cent
| 0.5 | 1 | 5 | 10 | 25 | 50 | 75 | 90 | 95 | 99 | 99.5 |
| -0.04 |
-0.03 |
-0.02 |
-0.01 |
0.00 |
0.00 |
0.01 |
0.02 |
0.03 |
0.04 |
0.17 |
Daily log-return distribution fitting results
| Distribution | Location, a | Scale, b |
| Logistic |
-0.263 |
0.099 |
Linear regression results [Model: y=log(percentile of log-return), x=|log-return|]
| Variable | Coef(b) | s.e.(b) | t-value | P-value |
| Constant |
-0.896 |
0.041 |
-21.763 |
0.0000 |
|log-return| |
-110.840 |
3.421 |
-32.400 |
0.0000 |
I(right-tail) |
0.233 |
0.057 |
4.091 |
0.0000 |
|log-return|*I(right-tail) |
-14.377 |
4.970 |
-2.893 |
0.0039 |
Hurst exponent (of daily return price)
| 12-day | 24-day | 48-day | 96-day |
| 0.688 |
0.343 |
0.664 |
0.603 |
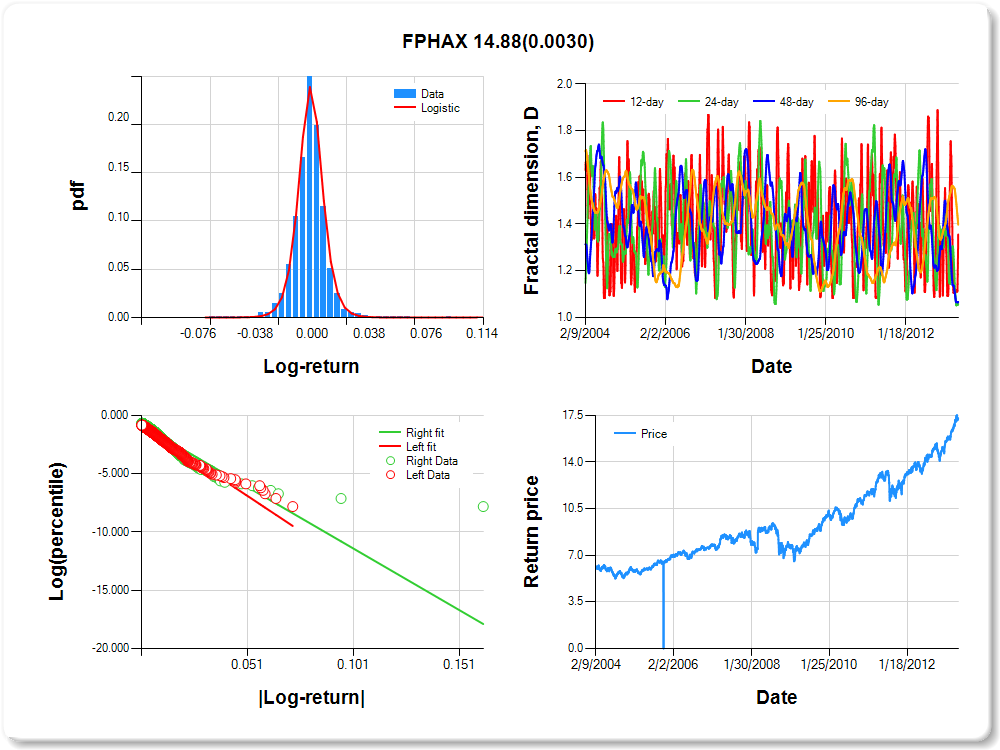
FPHAX
Percentile values of daily loss(gain) in per cent
| 0.5 | 1 | 5 | 10 | 25 | 50 | 75 | 90 | 95 | 99 | 99.5 |
| -0.04 |
-0.03 |
-0.02 |
-0.01 |
-0.01 |
0.00 |
0.01 |
0.02 |
0.03 |
0.04 |
0.74 |
Daily log-return distribution fitting results
| Distribution | Location, a | Scale, b |
| Logistic |
-0.645 |
0.074 |
Linear regression results [Model: y=log(percentile of log-return), x=|log-return|]
| Variable | Coef(b) | s.e.(b) | t-value | P-value |
| Constant |
-0.842 |
0.044 |
-19.268 |
0.0000 |
|log-return| |
-120.440 |
3.765 |
-31.986 |
0.0000 |
I(right-tail) |
0.017 |
0.059 |
0.295 |
0.7684 |
|log-return|*I(right-tail) |
14.883 |
5.007 |
2.973 |
0.0030 |
Hurst exponent (of daily return price)
| 12-day | 24-day | 48-day | 96-day |
| 0.645 |
0.943 |
0.934 |
0.603 |
FSDCX
Percentile values of daily loss(gain) in per cent
| 0.5 | 1 | 5 | 10 | 25 | 50 | 75 | 90 | 95 | 99 | 99.5 |
| -0.05 |
-0.05 |
-0.03 |
-0.02 |
-0.01 |
0.00 |
0.01 |
0.03 |
0.05 |
0.05 |
0.84 |
Daily log-return distribution fitting results
| Distribution | Location, a | Scale, b |
| Laplace |
0.013 |
0.226 |
Linear regression results [Model: y=log(percentile of log-return), x=|log-return|]
| Variable | Coef(b) | s.e.(b) | t-value | P-value |
| Constant |
-0.721 |
0.044 |
-16.468 |
0.0000 |
|log-return| |
-80.860 |
2.438 |
-33.164 |
0.0000 |
I(right-tail) |
0.154 |
0.060 |
2.590 |
0.0097 |
|log-return|*I(right-tail) |
-9.022 |
3.492 |
-2.584 |
0.0098 |
Hurst exponent (of daily return price)
| 12-day | 24-day | 48-day | 96-day |
| 0.640 |
0.574 |
0.552 |
0.595 |

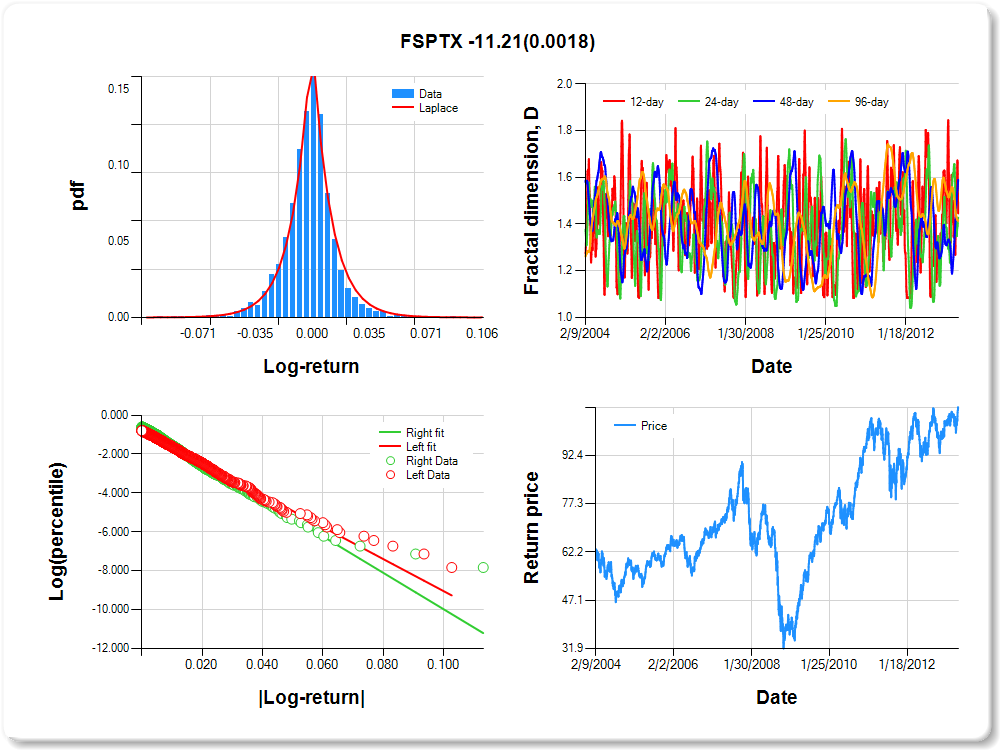
FSPTX
Percentile values of daily loss(gain) in per cent
| 0.5 | 1 | 5 | 10 | 25 | 50 | 75 | 90 | 95 | 99 | 99.5 |
| -0.05 |
-0.04 |
-0.03 |
-0.02 |
-0.01 |
0.00 |
0.01 |
0.02 |
0.04 |
0.05 |
0.62 |
Daily log-return distribution fitting results
| Distribution | Location, a | Scale, b |
| Laplace |
-0.056 |
0.185 |
Linear regression results [Model: y=log(percentile of log-return), x=|log-return|]
| Variable | Coef(b) | s.e.(b) | t-value | P-value |
| Constant |
-0.797 |
0.042 |
-18.859 |
0.0000 |
|log-return| |
-82.414 |
2.490 |
-33.097 |
0.0000 |
I(right-tail) |
0.191 |
0.057 |
3.336 |
0.0009 |
|log-return|*I(right-tail) |
-11.206 |
3.586 |
-3.125 |
0.0018 |
Hurst exponent (of daily return price)
| 12-day | 24-day | 48-day | 96-day |
| 0.554 |
0.573 |
0.410 |
0.586 |
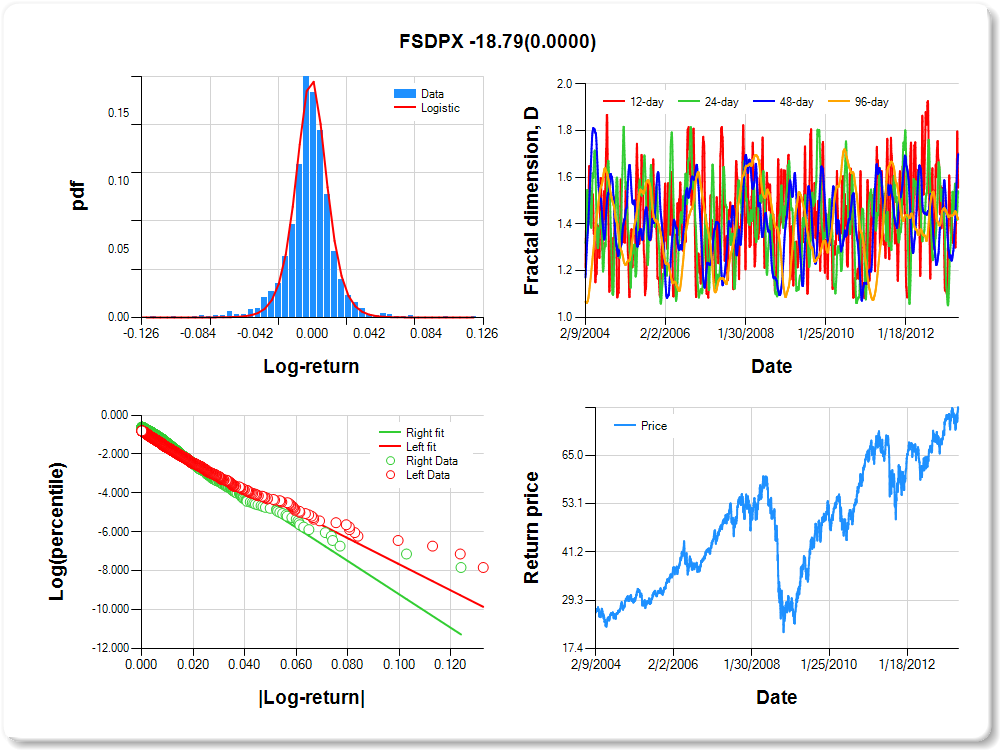
FSDPX
Percentile values of daily loss(gain) in per cent
| 0.5 | 1 | 5 | 10 | 25 | 50 | 75 | 90 | 95 | 99 | 99.5 |
| -0.06 |
-0.06 |
-0.03 |
-0.02 |
-0.01 |
0.00 |
0.01 |
0.03 |
0.05 |
0.06 |
1.62 |
Daily log-return distribution fitting results
| Distribution | Location, a | Scale, b |
| Logistic |
0.080 |
0.098 |
Linear regression results [Model: y=log(percentile of log-return), x=|log-return|]
| Variable | Coef(b) | s.e.(b) | t-value | P-value |
| Constant |
-0.951 |
0.040 |
-23.967 |
0.0000 |
|log-return| |
-67.106 |
2.059 |
-32.598 |
0.0000 |
I(right-tail) |
0.333 |
0.055 |
6.016 |
0.0000 |
|log-return|*I(right-tail) |
-18.792 |
3.148 |
-5.970 |
0.0000 |
Hurst exponent (of daily return price)
| 12-day | 24-day | 48-day | 96-day |
| 0.444 |
0.467 |
0.300 |
0.580 |
FBIOX
Percentile values of daily loss(gain) in per cent
| 0.5 | 1 | 5 | 10 | 25 | 50 | 75 | 90 | 95 | 99 | 99.5 |
| -0.05 |
-0.04 |
-0.02 |
-0.02 |
-0.01 |
0.00 |
0.01 |
0.02 |
0.03 |
0.04 |
0.78 |
Daily log-return distribution fitting results
| Distribution | Location, a | Scale, b |
| Logistic |
0.022 |
0.114 |
Linear regression results [Model: y=log(percentile of log-return), x=|log-return|]
| Variable | Coef(b) | s.e.(b) | t-value | P-value |
| Constant |
-0.752 |
0.041 |
-18.221 |
0.0000 |
|log-return| |
-93.139 |
2.762 |
-33.724 |
0.0000 |
I(right-tail) |
0.234 |
0.059 |
3.961 |
0.0001 |
|log-return|*I(right-tail) |
-13.311 |
4.091 |
-3.254 |
0.0012 |
Hurst exponent (of daily return price)
| 12-day | 24-day | 48-day | 96-day |
| 0.641 |
0.875 |
0.926 |
0.569 |

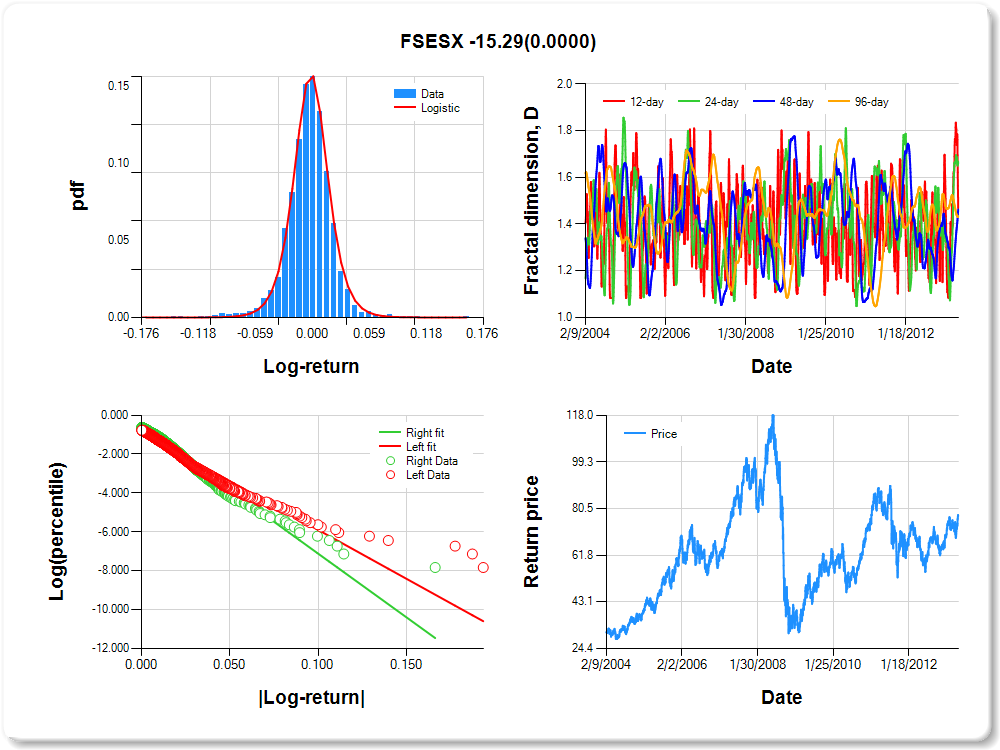
FSESX
Percentile values of daily loss(gain) in per cent
| 0.5 | 1 | 5 | 10 | 25 | 50 | 75 | 90 | 95 | 99 | 99.5 |
| -0.09 |
-0.07 |
-0.04 |
-0.02 |
-0.01 |
0.00 |
0.01 |
0.03 |
0.06 |
0.08 |
0.61 |
Daily log-return distribution fitting results
| Distribution | Location, a | Scale, b |
| Logistic |
0.148 |
0.108 |
Linear regression results [Model: y=log(percentile of log-return), x=|log-return|]
| Variable | Coef(b) | s.e.(b) | t-value | P-value |
| Constant |
-0.882 |
0.040 |
-22.090 |
0.0000 |
|log-return| |
-50.145 |
1.531 |
-32.755 |
0.0000 |
I(right-tail) |
0.312 |
0.057 |
5.505 |
0.0000 |
|log-return|*I(right-tail) |
-15.289 |
2.386 |
-6.407 |
0.0000 |
Hurst exponent (of daily return price)
| 12-day | 24-day | 48-day | 96-day |
| 0.532 |
0.341 |
0.537 |
0.566 |
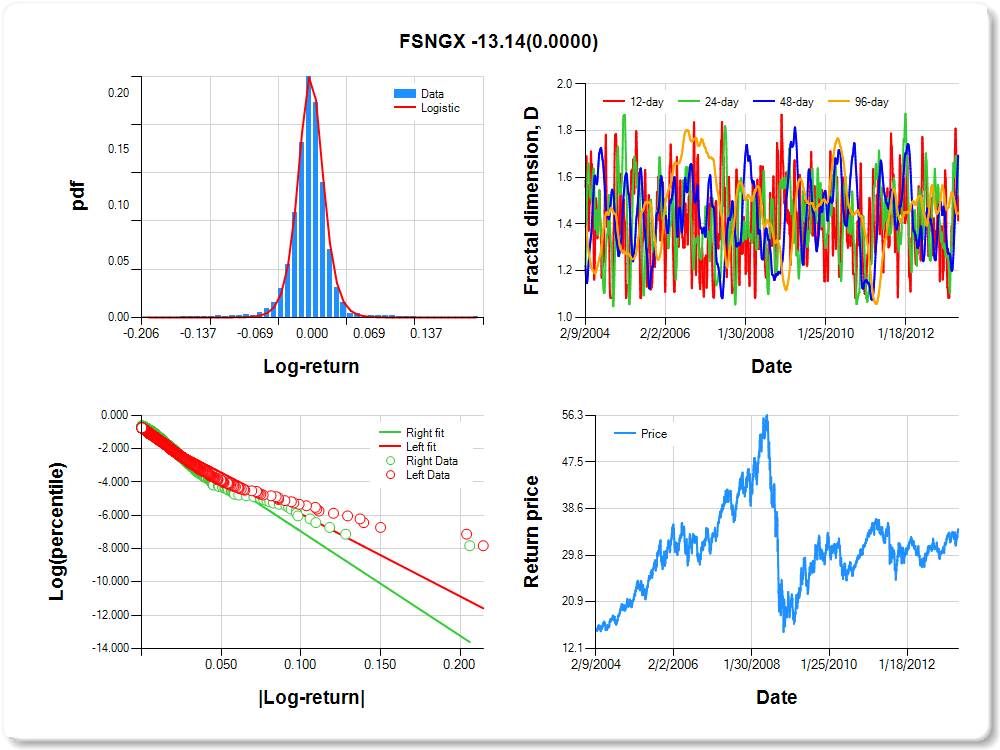
FSNGX
Percentile values of daily loss(gain) in per cent
| 0.5 | 1 | 5 | 10 | 25 | 50 | 75 | 90 | 95 | 99 | 99.5 |
| -0.09 |
-0.07 |
-0.03 |
-0.02 |
-0.01 |
0.00 |
0.01 |
0.03 |
0.06 |
0.08 |
0.58 |
Daily log-return distribution fitting results
| Distribution | Location, a | Scale, b |
| Logistic |
0.050 |
0.079 |
Linear regression results [Model: y=log(percentile of log-return), x=|log-return|]
| Variable | Coef(b) | s.e.(b) | t-value | P-value |
| Constant |
-0.971 |
0.038 |
-25.782 |
0.0000 |
|log-return| |
-49.448 |
1.519 |
-32.551 |
0.0000 |
I(right-tail) |
0.264 |
0.054 |
4.886 |
0.0000 |
|log-return|*I(right-tail) |
-13.140 |
2.364 |
-5.557 |
0.0000 |
Hurst exponent (of daily return price)
| 12-day | 24-day | 48-day | 96-day |
| 0.585 |
0.348 |
0.306 |
0.551 |
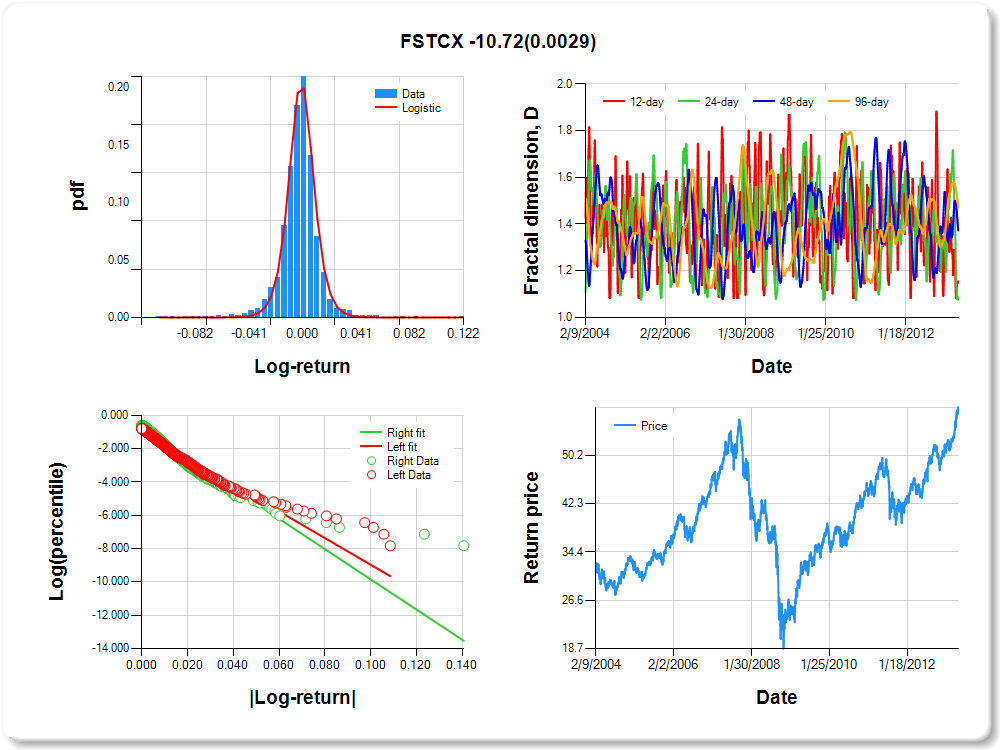
FSTCX
Percentile values of daily loss(gain) in per cent
| 0.5 | 1 | 5 | 10 | 25 | 50 | 75 | 90 | 95 | 99 | 99.5 |
| -0.06 |
-0.04 |
-0.02 |
-0.01 |
-0.01 |
0.00 |
0.01 |
0.02 |
0.04 |
0.05 |
1.21 |
Daily log-return distribution fitting results
| Distribution | Location, a | Scale, b |
| Logistic |
-0.202 |
0.083 |
Linear regression results [Model: y=log(percentile of log-return), x=|log-return|]
| Variable | Coef(b) | s.e.(b) | t-value | P-value |
| Constant |
-0.960 |
0.040 |
-24.240 |
0.0000 |
|log-return| |
-80.010 |
2.480 |
-32.258 |
0.0000 |
I(right-tail) |
0.198 |
0.054 |
3.691 |
0.0002 |
|log-return|*I(right-tail) |
-10.719 |
3.591 |
-2.985 |
0.0029 |
Hurst exponent (of daily return price)
| 12-day | 24-day | 48-day | 96-day |
| 0.845 |
0.924 |
0.628 |
0.528 |
FSENX
Percentile values of daily loss(gain) in per cent
| 0.5 | 1 | 5 | 10 | 25 | 50 | 75 | 90 | 95 | 99 | 99.5 |
| -0.09 |
-0.07 |
-0.03 |
-0.02 |
-0.01 |
0.00 |
0.01 |
0.03 |
0.06 |
0.08 |
1.31 |
Daily log-return distribution fitting results
| Distribution | Location, a | Scale, b |
| Logistic |
0.036 |
0.083 |
Linear regression results [Model: y=log(percentile of log-return), x=|log-return|]
| Variable | Coef(b) | s.e.(b) | t-value | P-value |
| Constant |
-0.977 |
0.038 |
-25.563 |
0.0000 |
|log-return| |
-52.121 |
1.607 |
-32.442 |
0.0000 |
I(right-tail) |
0.300 |
0.054 |
5.528 |
0.0000 |
|log-return|*I(right-tail) |
-15.041 |
2.502 |
-6.011 |
0.0000 |
Hurst exponent (of daily return price)
| 12-day | 24-day | 48-day | 96-day |
| 0.562 |
0.363 |
0.450 |
0.522 |

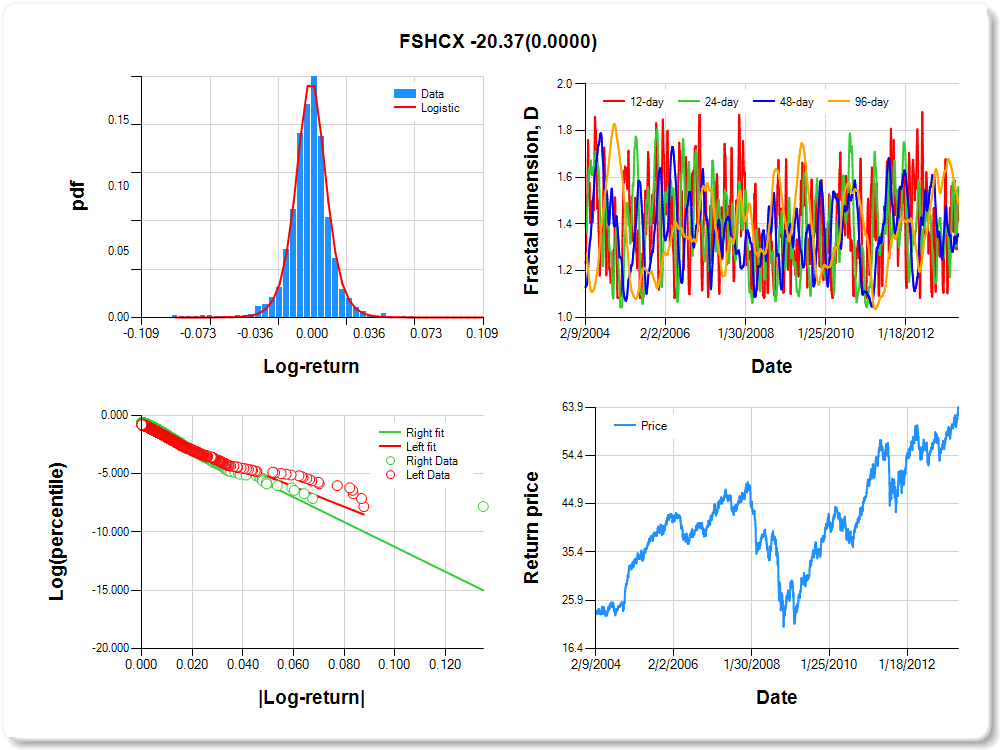
FSHCX
Percentile values of daily loss(gain) in per cent
| 0.5 | 1 | 5 | 10 | 25 | 50 | 75 | 90 | 95 | 99 | 99.5 |
| -0.06 |
-0.04 |
-0.02 |
-0.01 |
-0.01 |
0.00 |
0.01 |
0.02 |
0.03 |
0.05 |
0.82 |
Daily log-return distribution fitting results
| Distribution | Location, a | Scale, b |
| Logistic |
-0.344 |
0.094 |
Linear regression results [Model: y=log(percentile of log-return), x=|log-return|]
| Variable | Coef(b) | s.e.(b) | t-value | P-value |
| Constant |
-0.945 |
0.040 |
-23.568 |
0.0000 |
|log-return| |
-86.099 |
2.679 |
-32.140 |
0.0000 |
I(right-tail) |
0.321 |
0.056 |
5.730 |
0.0000 |
|log-return|*I(right-tail) |
-20.374 |
4.030 |
-5.055 |
0.0000 |
Hurst exponent (of daily return price)
| 12-day | 24-day | 48-day | 96-day |
| 0.586 |
0.440 |
0.644 |
0.512 |
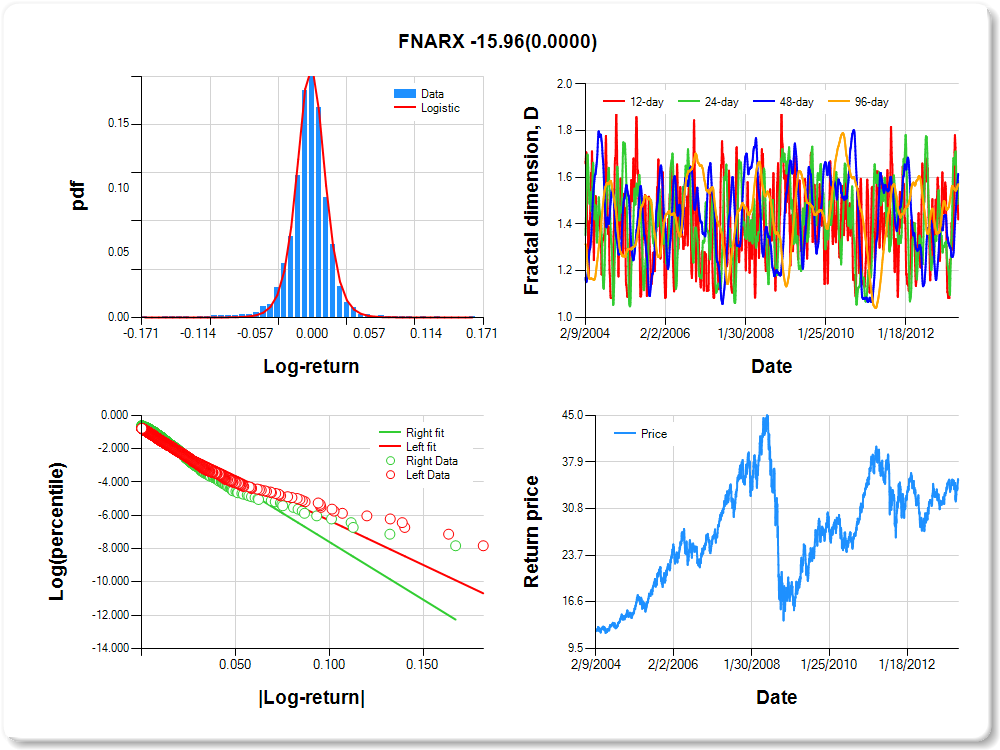
FNARX
Percentile values of daily loss(gain) in per cent
| 0.5 | 1 | 5 | 10 | 25 | 50 | 75 | 90 | 95 | 99 | 99.5 |
| -0.09 |
-0.07 |
-0.03 |
-0.02 |
-0.01 |
0.00 |
0.01 |
0.03 |
0.05 |
0.07 |
0.60 |
Daily log-return distribution fitting results
| Distribution | Location, a | Scale, b |
| Logistic |
0.091 |
0.088 |
Linear regression results [Model: y=log(percentile of log-return), x=|log-return|]
| Variable | Coef(b) | s.e.(b) | t-value | P-value |
| Constant |
-0.979 |
0.039 |
-25.258 |
0.0000 |
|log-return| |
-53.270 |
1.650 |
-32.290 |
0.0000 |
I(right-tail) |
0.314 |
0.055 |
5.724 |
0.0000 |
|log-return|*I(right-tail) |
-15.958 |
2.574 |
-6.201 |
0.0000 |
Hurst exponent (of daily return price)
| 12-day | 24-day | 48-day | 96-day |
| 0.580 |
0.414 |
0.384 |
0.429 |