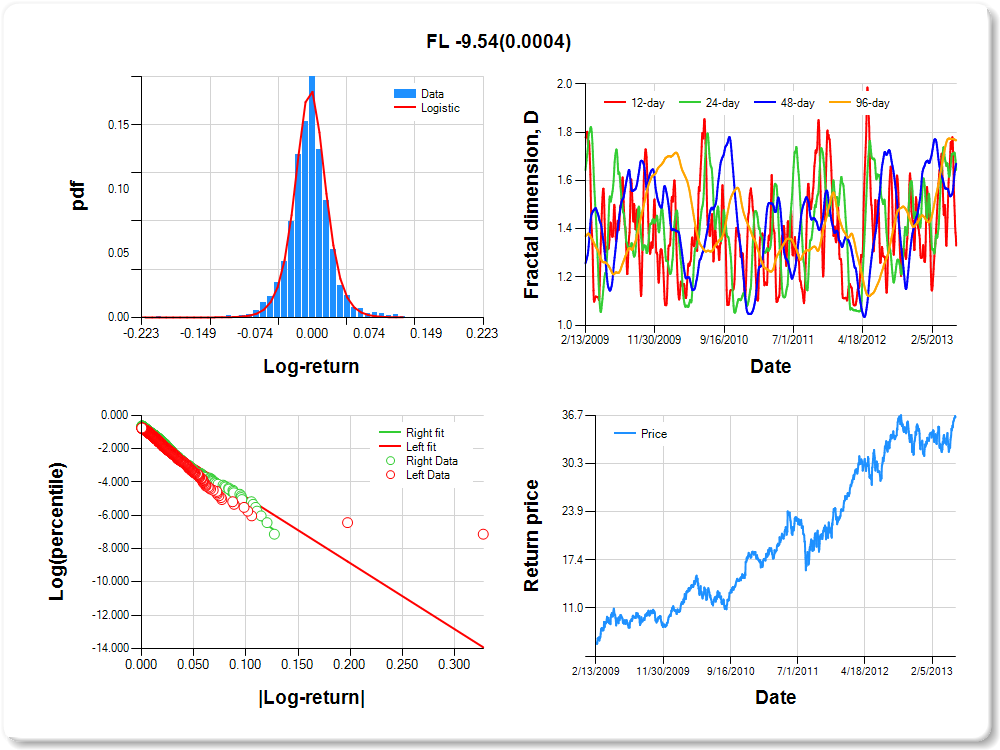
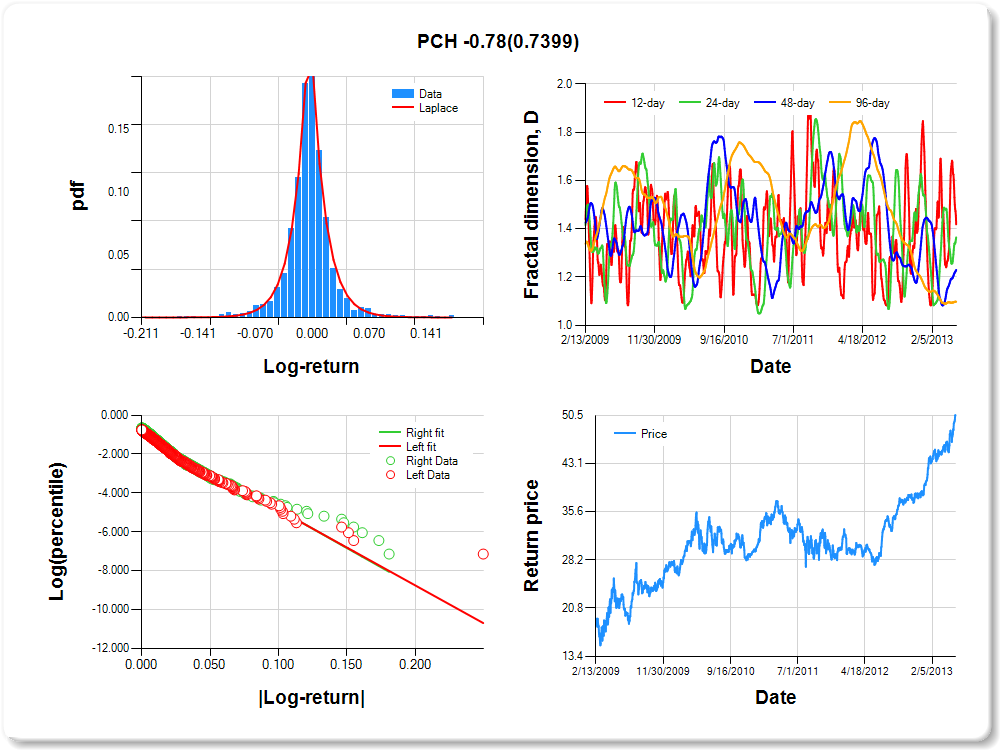
PCH
Percentile values of daily loss(gain) in per cent
| 0.5 | 1 | 5 | 10 | 25 | 50 | 75 | 90 | 95 | 99 | 99.5 |
| -0.11 |
-0.09 |
-0.04 |
-0.03 |
-0.01 |
0.00 |
0.01 |
0.05 |
0.10 |
0.14 |
0.49 |
Daily log-return distribution fitting results
| Distribution | Location, a | Scale, b |
| Laplace |
0.279 |
0.140 |
Linear regression results [Model: y=log(percentile of log-return), x=|log-return|]
| Variable | Coef(b) | s.e.(b) | t-value | P-value |
| Constant |
-0.959 |
0.053 |
-17.988 |
0.0000 |
|log-return| |
-38.945 |
1.679 |
-23.199 |
0.0000 |
I(right-tail) |
0.093 |
0.074 |
1.268 |
0.2050 |
|log-return|*I(right-tail) |
-0.777 |
2.340 |
-0.332 |
0.7399 |
Hurst exponent (of daily return price)
| 12-day | 24-day | 48-day | 96-day |
| 0.581 |
0.635 |
0.770 |
0.902 |
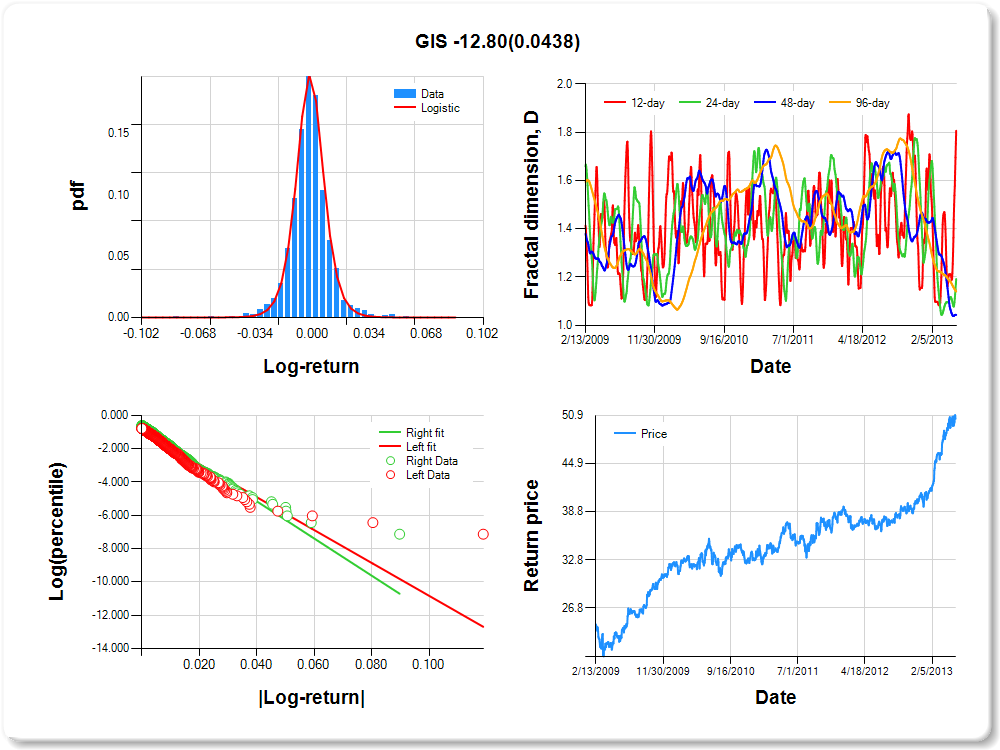
GIS
Percentile values of daily loss(gain) in per cent
| 0.5 | 1 | 5 | 10 | 25 | 50 | 75 | 90 | 95 | 99 | 99.5 |
| -0.04 |
-0.03 |
-0.02 |
-0.01 |
-0.01 |
0.00 |
0.01 |
0.02 |
0.03 |
0.05 |
1.31 |
Daily log-return distribution fitting results
| Distribution | Location, a | Scale, b |
| Logistic |
0.248 |
0.086 |
Linear regression results [Model: y=log(percentile of log-return), x=|log-return|]
| Variable | Coef(b) | s.e.(b) | t-value | P-value |
| Constant |
-0.954 |
0.057 |
-16.825 |
0.0000 |
|log-return| |
-98.678 |
4.508 |
-21.890 |
0.0000 |
I(right-tail) |
0.266 |
0.078 |
3.407 |
0.0007 |
|log-return|*I(right-tail) |
-12.804 |
6.344 |
-2.018 |
0.0438 |
Hurst exponent (of daily return price)
| 12-day | 24-day | 48-day | 96-day |
| 0.193 |
0.808 |
0.957 |
0.860 |
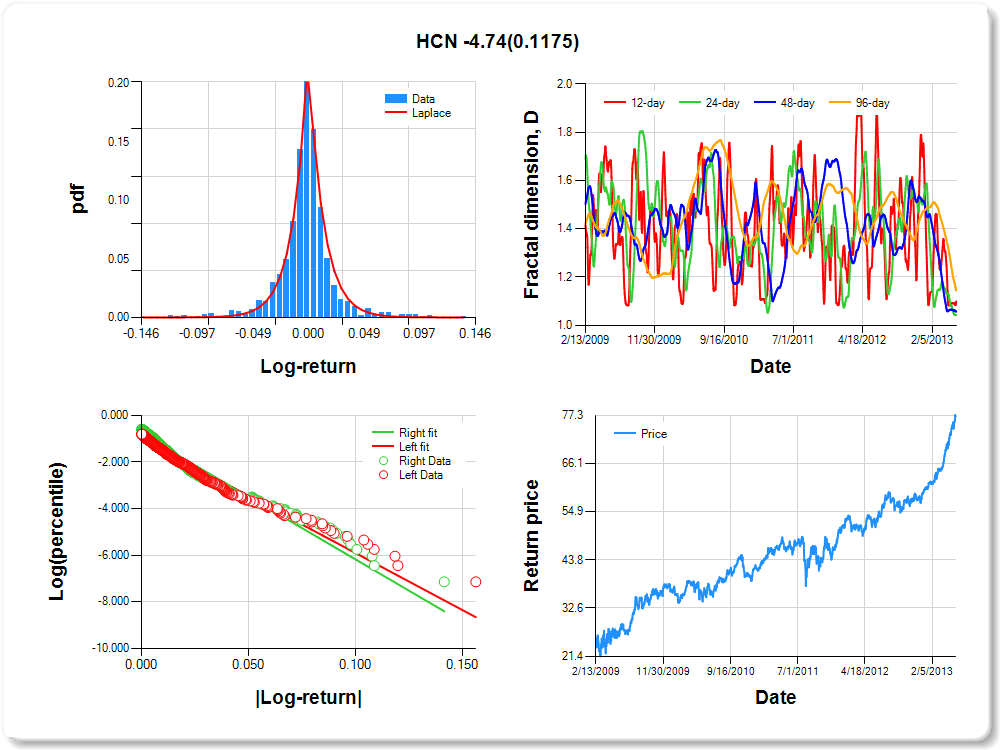
HCN
Percentile values of daily loss(gain) in per cent
| 0.5 | 1 | 5 | 10 | 25 | 50 | 75 | 90 | 95 | 99 | 99.5 |
| -0.10 |
-0.08 |
-0.04 |
-0.02 |
-0.01 |
0.00 |
0.01 |
0.04 |
0.08 |
0.10 |
1.48 |
Daily log-return distribution fitting results
| Distribution | Location, a | Scale, b |
| Laplace |
0.113 |
0.151 |
Linear regression results [Model: y=log(percentile of log-return), x=|log-return|]
| Variable | Coef(b) | s.e.(b) | t-value | P-value |
| Constant |
-1.013 |
0.055 |
-18.544 |
0.0000 |
|log-return| |
-48.885 |
2.146 |
-22.777 |
0.0000 |
I(right-tail) |
0.202 |
0.074 |
2.736 |
0.0063 |
|log-return|*I(right-tail) |
-4.745 |
3.029 |
-1.566 |
0.1175 |
Hurst exponent (of daily return price)
| 12-day | 24-day | 48-day | 96-day |
| 0.901 |
0.957 |
0.944 |
0.856 |
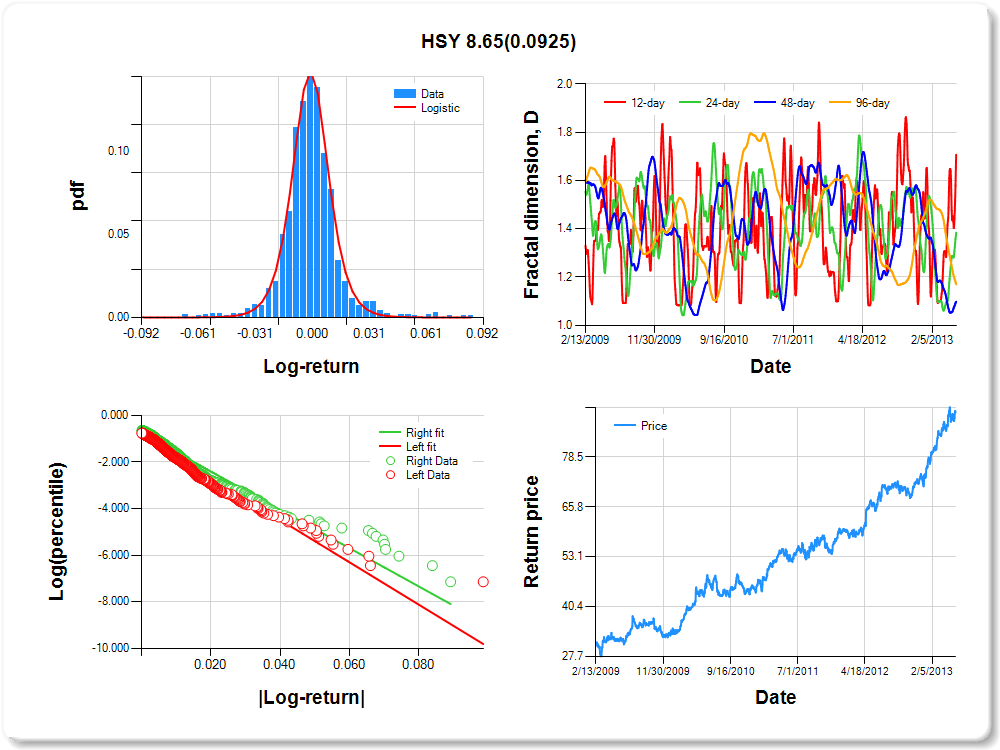
HSY
Percentile values of daily loss(gain) in per cent
| 0.5 | 1 | 5 | 10 | 25 | 50 | 75 | 90 | 95 | 99 | 99.5 |
| -0.05 |
-0.04 |
-0.02 |
-0.01 |
-0.01 |
0.00 |
0.01 |
0.02 |
0.05 |
0.07 |
0.87 |
Daily log-return distribution fitting results
| Distribution | Location, a | Scale, b |
| Logistic |
0.100 |
0.116 |
Linear regression results [Model: y=log(percentile of log-return), x=|log-return|]
| Variable | Coef(b) | s.e.(b) | t-value | P-value |
| Constant |
-0.862 |
0.057 |
-15.250 |
0.0000 |
|log-return| |
-90.609 |
3.899 |
-23.238 |
0.0000 |
I(right-tail) |
0.087 |
0.077 |
1.124 |
0.2612 |
|log-return|*I(right-tail) |
8.648 |
5.136 |
1.684 |
0.0925 |
Hurst exponent (of daily return price)
| 12-day | 24-day | 48-day | 96-day |
| 0.293 |
0.616 |
0.902 |
0.830 |
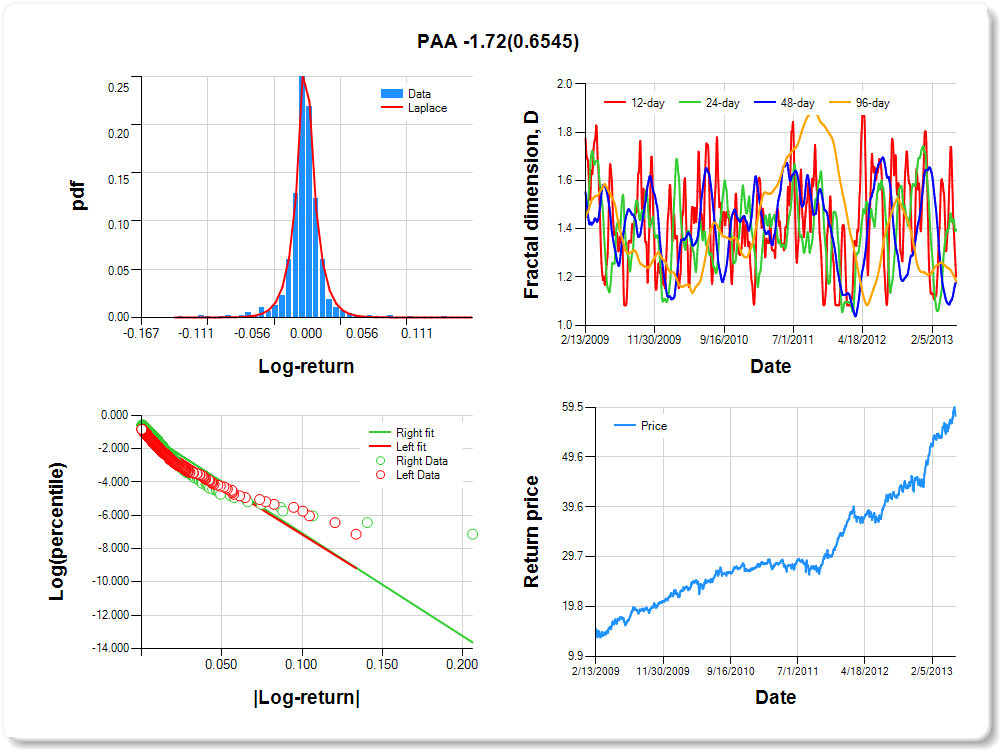
PAA
Percentile values of daily loss(gain) in per cent
| 0.5 | 1 | 5 | 10 | 25 | 50 | 75 | 90 | 95 | 99 | 99.5 |
| -0.08 |
-0.06 |
-0.02 |
-0.01 |
-0.01 |
0.00 |
0.01 |
0.02 |
0.05 |
0.07 |
0.86 |
Daily log-return distribution fitting results
| Distribution | Location, a | Scale, b |
| Laplace |
-0.349 |
0.099 |
Linear regression results [Model: y=log(percentile of log-return), x=|log-return|]
| Variable | Coef(b) | s.e.(b) | t-value | P-value |
| Constant |
-1.157 |
0.053 |
-21.700 |
0.0000 |
|log-return| |
-59.975 |
2.767 |
-21.672 |
0.0000 |
I(right-tail) |
0.257 |
0.072 |
3.581 |
0.0004 |
|log-return|*I(right-tail) |
-1.715 |
3.832 |
-0.448 |
0.6545 |
Hurst exponent (of daily return price)
| 12-day | 24-day | 48-day | 96-day |
| 0.799 |
0.605 |
0.818 |
0.819 |
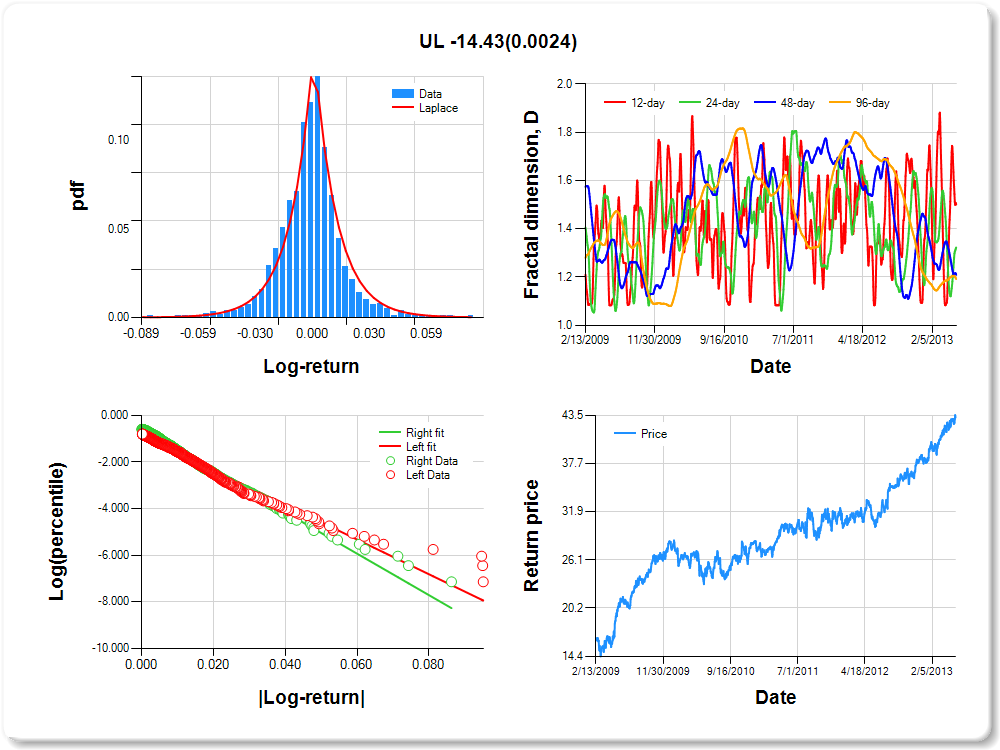
UL
Percentile values of daily loss(gain) in per cent
| 0.5 | 1 | 5 | 10 | 25 | 50 | 75 | 90 | 95 | 99 | 99.5 |
| -0.06 |
-0.05 |
-0.02 |
-0.02 |
-0.01 |
0.00 |
0.01 |
0.03 |
0.04 |
0.05 |
-0.02 |
Daily log-return distribution fitting results
| Distribution | Location, a | Scale, b |
| Laplace |
0.130 |
0.225 |
Linear regression results [Model: y=log(percentile of log-return), x=|log-return|]
| Variable | Coef(b) | s.e.(b) | t-value | P-value |
| Constant |
-0.861 |
0.059 |
-14.639 |
0.0000 |
|log-return| |
-74.293 |
3.249 |
-22.866 |
0.0000 |
I(right-tail) |
0.263 |
0.080 |
3.277 |
0.0011 |
|log-return|*I(right-tail) |
-14.426 |
4.747 |
-3.039 |
0.0024 |
Hurst exponent (of daily return price)
| 12-day | 24-day | 48-day | 96-day |
| 0.499 |
0.678 |
0.791 |
0.809 |
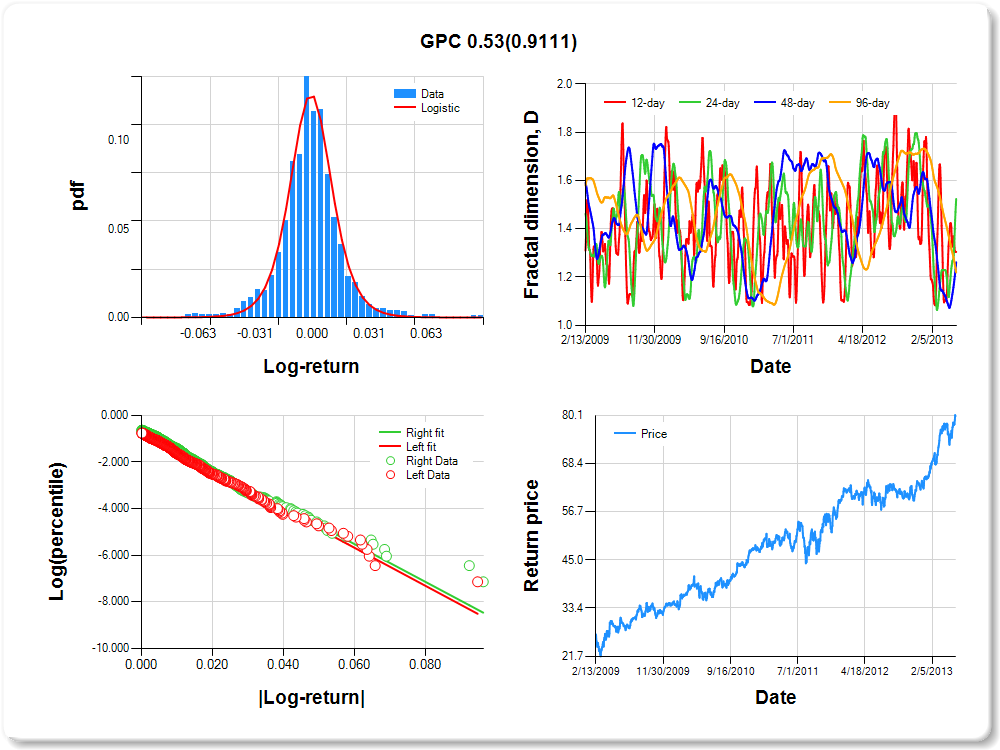
GPC
Percentile values of daily loss(gain) in per cent
| 0.5 | 1 | 5 | 10 | 25 | 50 | 75 | 90 | 95 | 99 | 99.5 |
| -0.06 |
-0.05 |
-0.03 |
-0.02 |
-0.01 |
0.00 |
0.01 |
0.03 |
0.05 |
0.06 |
1.04 |
Daily log-return distribution fitting results
| Distribution | Location, a | Scale, b |
| Logistic |
0.005 |
0.136 |
Linear regression results [Model: y=log(percentile of log-return), x=|log-return|]
| Variable | Coef(b) | s.e.(b) | t-value | P-value |
| Constant |
-0.787 |
0.058 |
-13.480 |
0.0000 |
|log-return| |
-81.388 |
3.453 |
-23.571 |
0.0000 |
I(right-tail) |
0.126 |
0.080 |
1.570 |
0.1166 |
|log-return|*I(right-tail) |
0.528 |
4.729 |
0.112 |
0.9111 |
Hurst exponent (of daily return price)
| 12-day | 24-day | 48-day | 96-day |
| 0.696 |
0.476 |
0.739 |
0.781 |
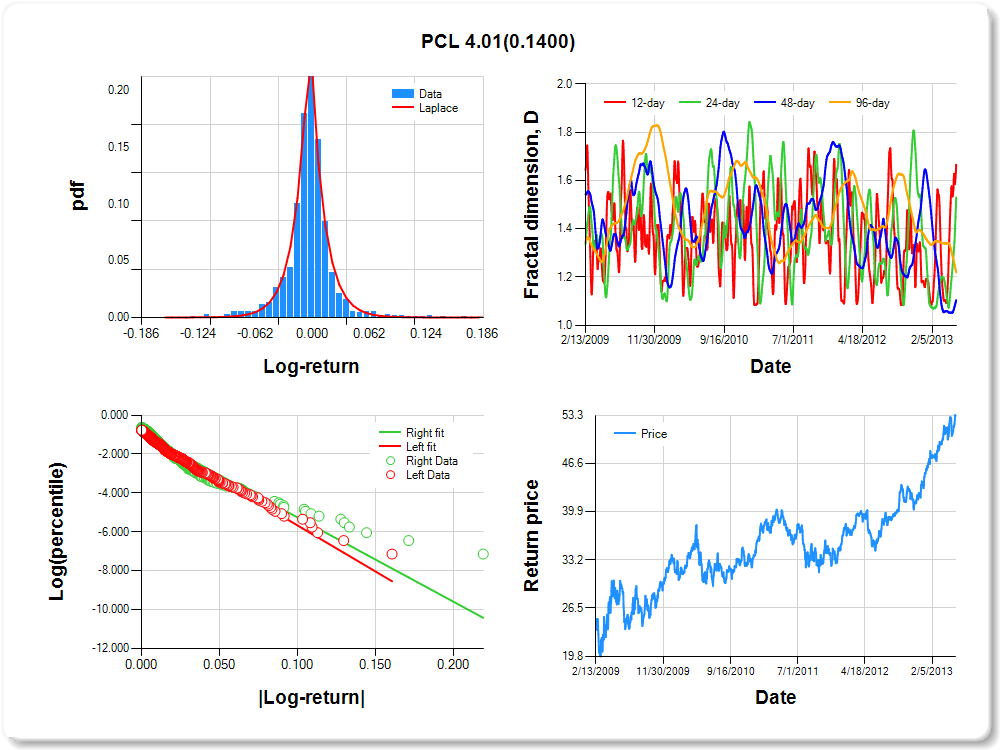
PCL
Percentile values of daily loss(gain) in per cent
| 0.5 | 1 | 5 | 10 | 25 | 50 | 75 | 90 | 95 | 99 | 99.5 |
| -0.10 |
-0.08 |
-0.04 |
-0.03 |
-0.01 |
0.00 |
0.01 |
0.04 |
0.09 |
0.12 |
1.50 |
Daily log-return distribution fitting results
| Distribution | Location, a | Scale, b |
| Laplace |
-0.257 |
0.133 |
Linear regression results [Model: y=log(percentile of log-return), x=|log-return|]
| Variable | Coef(b) | s.e.(b) | t-value | P-value |
| Constant |
-0.929 |
0.055 |
-17.010 |
0.0000 |
|log-return| |
-47.399 |
2.024 |
-23.418 |
0.0000 |
I(right-tail) |
0.011 |
0.073 |
0.154 |
0.8773 |
|log-return|*I(right-tail) |
4.008 |
2.714 |
1.477 |
0.1400 |
Hurst exponent (of daily return price)
| 12-day | 24-day | 48-day | 96-day |
| 0.334 |
0.470 |
0.896 |
0.780 |
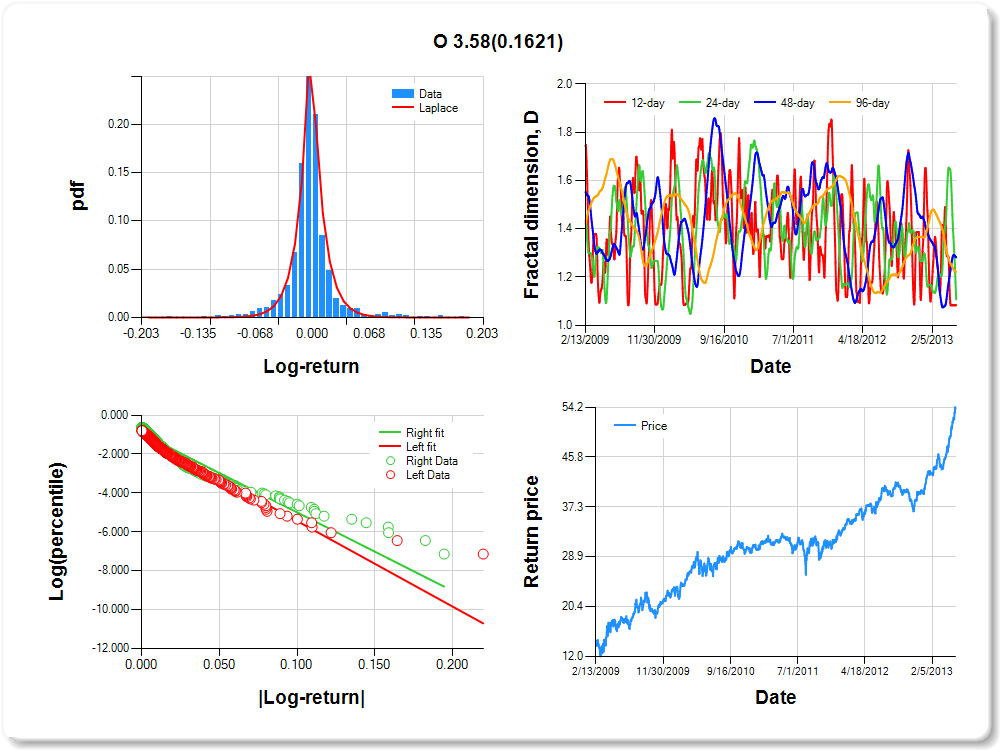
O
Percentile values of daily loss(gain) in per cent
| 0.5 | 1 | 5 | 10 | 25 | 50 | 75 | 90 | 95 | 99 | 99.5 |
| -0.10 |
-0.08 |
-0.04 |
-0.02 |
-0.01 |
0.00 |
0.01 |
0.04 |
0.10 |
0.12 |
0.66 |
Daily log-return distribution fitting results
| Distribution | Location, a | Scale, b |
| Laplace |
0.122 |
0.111 |
Linear regression results [Model: y=log(percentile of log-return), x=|log-return|]
| Variable | Coef(b) | s.e.(b) | t-value | P-value |
| Constant |
-1.042 |
0.053 |
-19.564 |
0.0000 |
|log-return| |
-43.947 |
1.941 |
-22.637 |
0.0000 |
I(right-tail) |
0.087 |
0.071 |
1.220 |
0.2225 |
|log-return|*I(right-tail) |
3.579 |
2.559 |
1.399 |
0.1621 |
Hurst exponent (of daily return price)
| 12-day | 24-day | 48-day | 96-day |
| 0.917 |
0.893 |
0.719 |
0.779 |
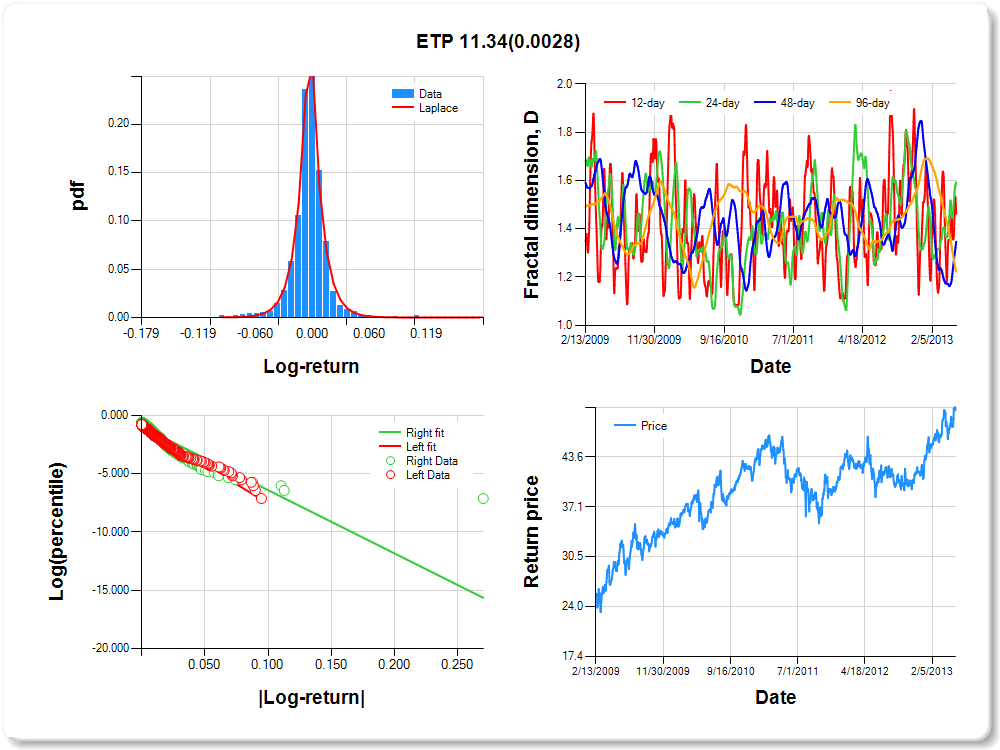
ETP
Percentile values of daily loss(gain) in per cent
| 0.5 | 1 | 5 | 10 | 25 | 50 | 75 | 90 | 95 | 99 | 99.5 |
| -0.07 |
-0.06 |
-0.03 |
-0.02 |
-0.01 |
0.00 |
0.01 |
0.02 |
0.05 |
0.06 |
1.02 |
Daily log-return distribution fitting results
| Distribution | Location, a | Scale, b |
| Laplace |
-0.817 |
0.103 |
Linear regression results [Model: y=log(percentile of log-return), x=|log-return|]
| Variable | Coef(b) | s.e.(b) | t-value | P-value |
| Constant |
-0.989 |
0.055 |
-18.002 |
0.0000 |
|log-return| |
-65.602 |
2.874 |
-22.829 |
0.0000 |
I(right-tail) |
-0.001 |
0.073 |
-0.015 |
0.9877 |
|log-return|*I(right-tail) |
11.338 |
3.791 |
2.990 |
0.0028 |
Hurst exponent (of daily return price)
| 12-day | 24-day | 48-day | 96-day |
| 0.538 |
0.408 |
0.653 |
0.778 |
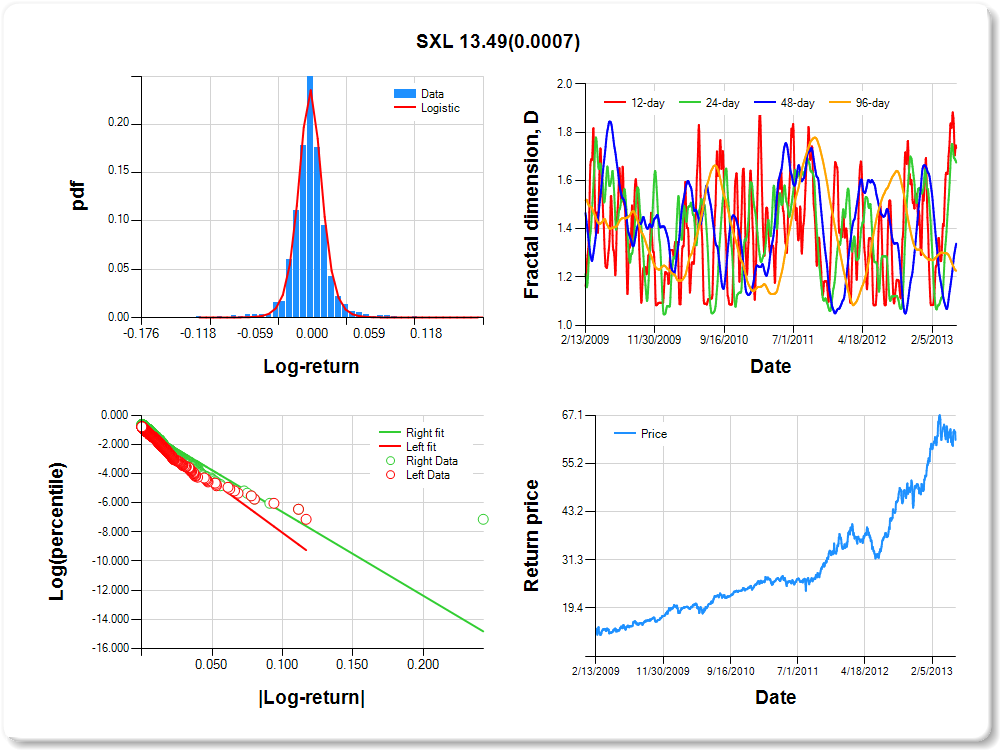
SXL
Percentile values of daily loss(gain) in per cent
| 0.5 | 1 | 5 | 10 | 25 | 50 | 75 | 90 | 95 | 99 | 99.5 |
| -0.07 |
-0.05 |
-0.02 |
-0.02 |
-0.01 |
0.00 |
0.01 |
0.03 |
0.05 |
0.08 |
1.57 |
Daily log-return distribution fitting results
| Distribution | Location, a | Scale, b |
| Logistic |
-0.588 |
0.074 |
Linear regression results [Model: y=log(percentile of log-return), x=|log-return|]
| Variable | Coef(b) | s.e.(b) | t-value | P-value |
| Constant |
-0.961 |
0.056 |
-17.302 |
0.0000 |
|log-return| |
-70.886 |
3.131 |
-22.639 |
0.0000 |
I(right-tail) |
0.068 |
0.074 |
0.917 |
0.3592 |
|log-return|*I(right-tail) |
13.494 |
3.987 |
3.384 |
0.0007 |
Hurst exponent (of daily return price)
| 12-day | 24-day | 48-day | 96-day |
| 0.265 |
0.325 |
0.661 |
0.774 |
DUK
Percentile values of daily loss(gain) in per cent
| 0.5 | 1 | 5 | 10 | 25 | 50 | 75 | 90 | 95 | 99 | 99.5 |
| -0.05 |
-0.04 |
-0.02 |
-0.01 |
-0.01 |
0.00 |
0.01 |
0.02 |
0.03 |
0.05 |
0.36 |
Daily log-return distribution fitting results
| Distribution | Location, a | Scale, b |
| Logistic |
-0.093 |
0.079 |
Linear regression results [Model: y=log(percentile of log-return), x=|log-return|]
| Variable | Coef(b) | s.e.(b) | t-value | P-value |
| Constant |
-0.991 |
0.055 |
-18.159 |
0.0000 |
|log-return| |
-90.083 |
4.013 |
-22.449 |
0.0000 |
I(right-tail) |
0.156 |
0.076 |
2.055 |
0.0401 |
|log-return|*I(right-tail) |
-0.651 |
5.568 |
-0.117 |
0.9069 |
Hurst exponent (of daily return price)
| 12-day | 24-day | 48-day | 96-day |
| 0.678 |
0.762 |
0.939 |
0.771 |

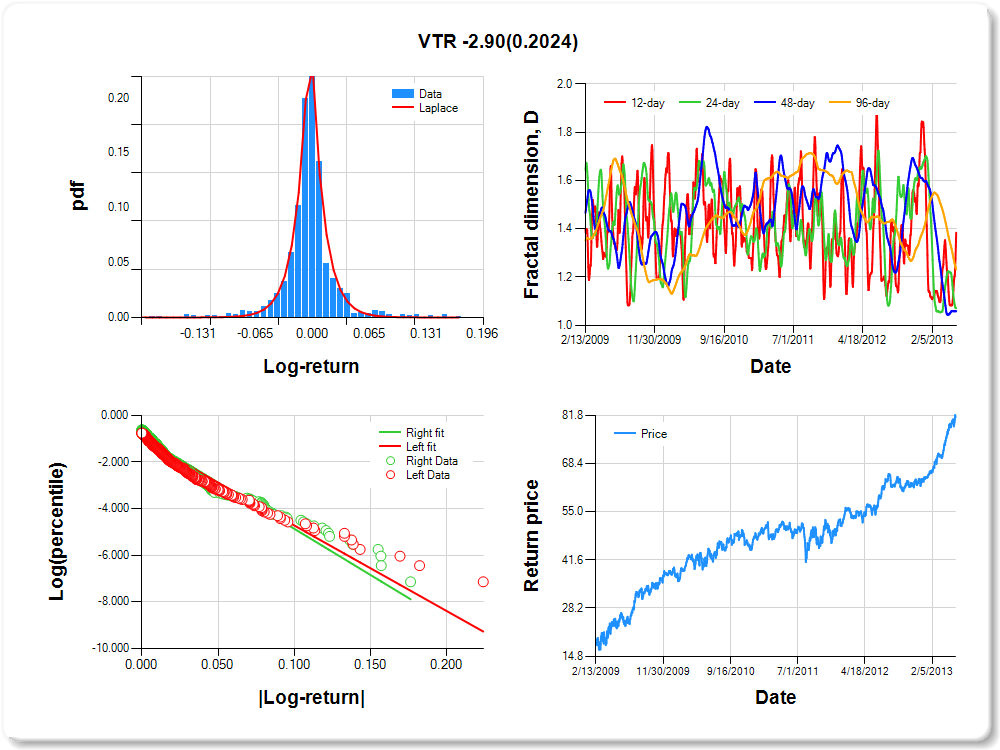
VTR
Percentile values of daily loss(gain) in per cent
| 0.5 | 1 | 5 | 10 | 25 | 50 | 75 | 90 | 95 | 99 | 99.5 |
| -0.13 |
-0.09 |
-0.04 |
-0.03 |
-0.01 |
0.00 |
0.01 |
0.04 |
0.11 |
0.13 |
1.16 |
Daily log-return distribution fitting results
| Distribution | Location, a | Scale, b |
| Laplace |
0.214 |
0.124 |
Linear regression results [Model: y=log(percentile of log-return), x=|log-return|]
| Variable | Coef(b) | s.e.(b) | t-value | P-value |
| Constant |
-1.051 |
0.052 |
-20.370 |
0.0000 |
|log-return| |
-36.711 |
1.599 |
-22.954 |
0.0000 |
I(right-tail) |
0.147 |
0.071 |
2.068 |
0.0389 |
|log-return|*I(right-tail) |
-2.897 |
2.272 |
-1.275 |
0.2024 |
Hurst exponent (of daily return price)
| 12-day | 24-day | 48-day | 96-day |
| 0.616 |
0.929 |
0.942 |
0.768 |
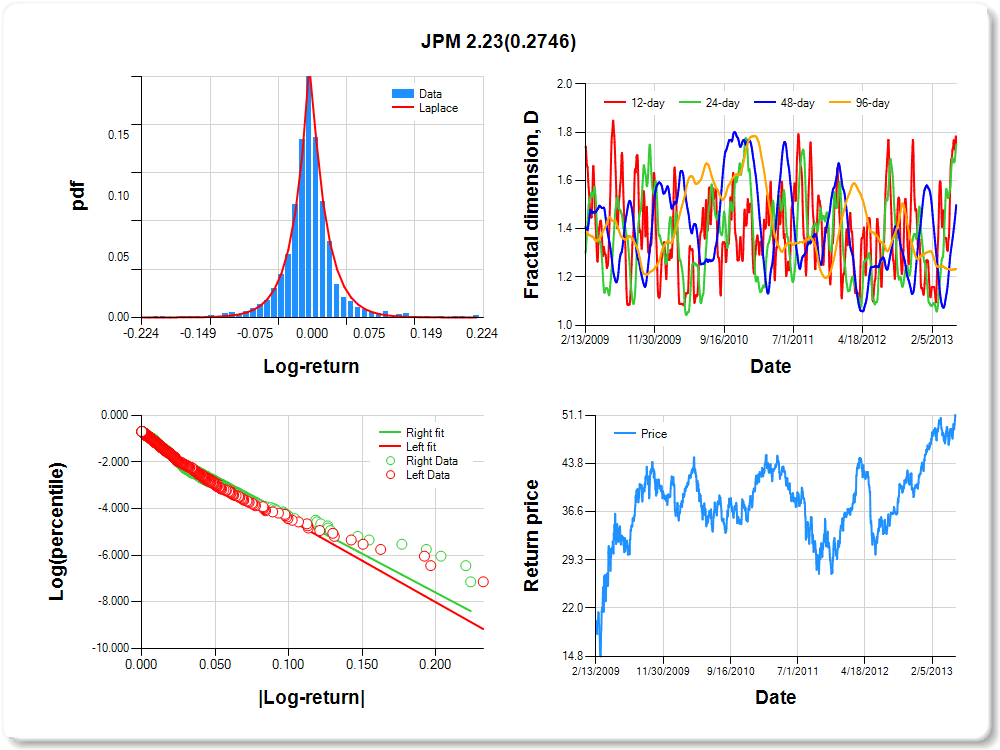
JPM
Percentile values of daily loss(gain) in per cent
| 0.5 | 1 | 5 | 10 | 25 | 50 | 75 | 90 | 95 | 99 | 99.5 |
| -0.13 |
-0.10 |
-0.05 |
-0.03 |
-0.01 |
0.00 |
0.01 |
0.05 |
0.13 |
0.16 |
1.27 |
Daily log-return distribution fitting results
| Distribution | Location, a | Scale, b |
| Laplace |
0.041 |
0.157 |
Linear regression results [Model: y=log(percentile of log-return), x=|log-return|]
| Variable | Coef(b) | s.e.(b) | t-value | P-value |
| Constant |
-0.898 |
0.052 |
-17.307 |
0.0000 |
|log-return| |
-35.557 |
1.484 |
-23.962 |
0.0000 |
I(right-tail) |
-0.036 |
0.073 |
-0.489 |
0.6249 |
|log-return|*I(right-tail) |
2.235 |
2.045 |
1.093 |
0.2746 |
Hurst exponent (of daily return price)
| 12-day | 24-day | 48-day | 96-day |
| 0.254 |
0.249 |
0.501 |
0.766 |
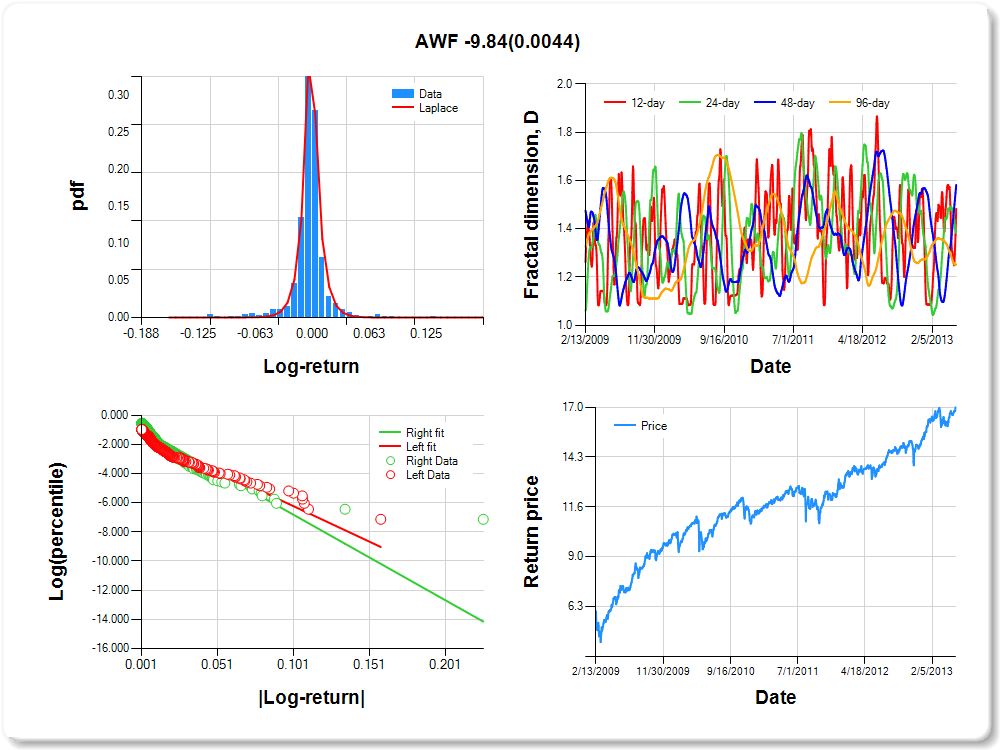
AWF
Percentile values of daily loss(gain) in per cent
| 0.5 | 1 | 5 | 10 | 25 | 50 | 75 | 90 | 95 | 99 | 99.5 |
| -0.10 |
-0.07 |
-0.03 |
-0.01 |
0.00 |
0.00 |
0.01 |
0.03 |
0.05 |
0.08 |
-0.05 |
Daily log-return distribution fitting results
| Distribution | Location, a | Scale, b |
| Laplace |
-0.282 |
0.072 |
Linear regression results [Model: y=log(percentile of log-return), x=|log-return|]
| Variable | Coef(b) | s.e.(b) | t-value | P-value |
| Constant |
-1.338 |
0.056 |
-24.034 |
0.0000 |
|log-return| |
-48.721 |
2.410 |
-20.217 |
0.0000 |
I(right-tail) |
0.399 |
0.072 |
5.576 |
0.0000 |
|log-return|*I(right-tail) |
-9.843 |
3.447 |
-2.855 |
0.0044 |
Hurst exponent (of daily return price)
| 12-day | 24-day | 48-day | 96-day |
| 0.517 |
0.617 |
0.418 |
0.747 |
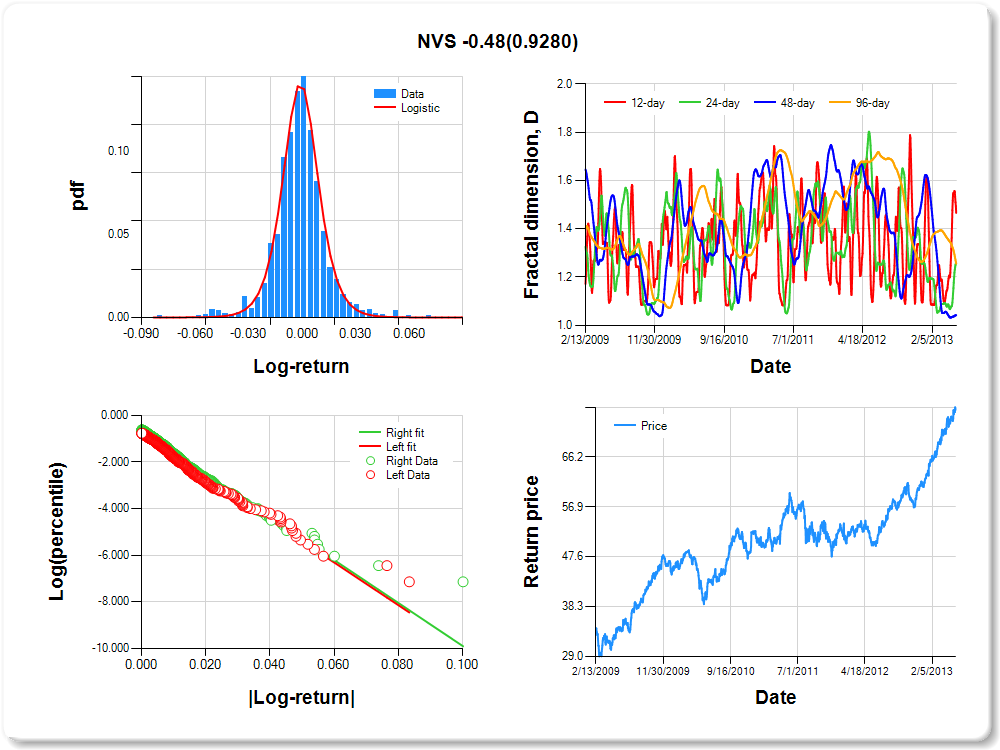
NVS
Percentile values of daily loss(gain) in per cent
| 0.5 | 1 | 5 | 10 | 25 | 50 | 75 | 90 | 95 | 99 | 99.5 |
| -0.05 |
-0.04 |
-0.02 |
-0.01 |
-0.01 |
0.00 |
0.01 |
0.02 |
0.04 |
0.06 |
0.62 |
Daily log-return distribution fitting results
| Distribution | Location, a | Scale, b |
| Logistic |
-0.143 |
0.122 |
Linear regression results [Model: y=log(percentile of log-return), x=|log-return|]
| Variable | Coef(b) | s.e.(b) | t-value | P-value |
| Constant |
-0.820 |
0.058 |
-14.142 |
0.0000 |
|log-return| |
-91.325 |
3.910 |
-23.358 |
0.0000 |
I(right-tail) |
0.132 |
0.079 |
1.671 |
0.0951 |
|log-return|*I(right-tail) |
-0.484 |
5.356 |
-0.090 |
0.9280 |
Hurst exponent (of daily return price)
| 12-day | 24-day | 48-day | 96-day |
| 0.534 |
0.742 |
0.958 |
0.745 |
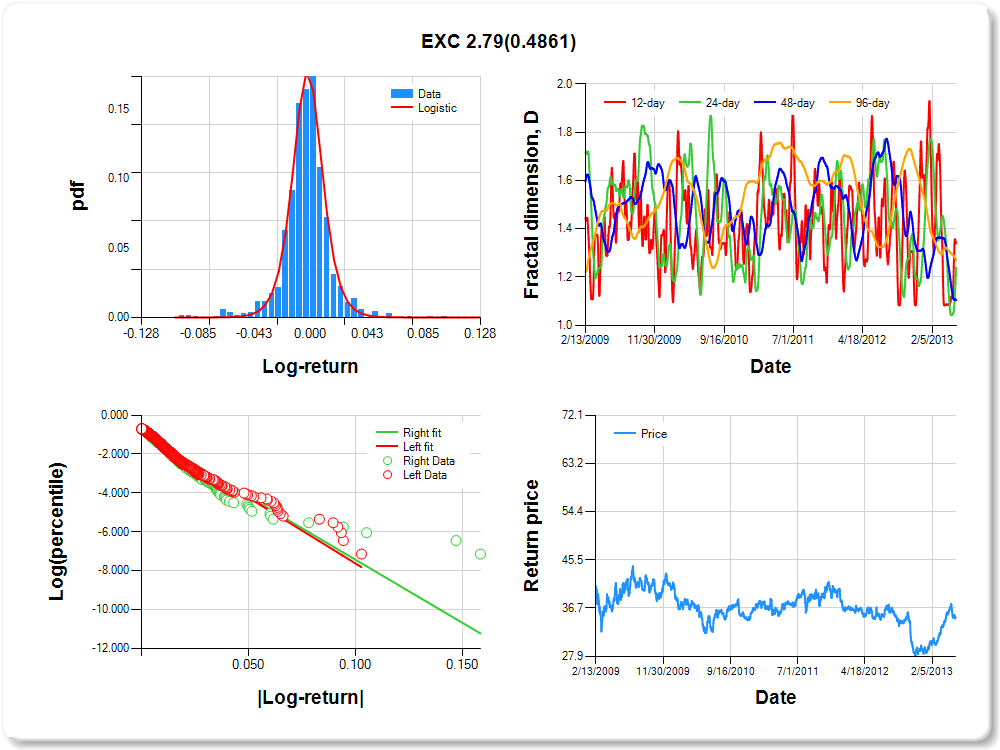
EXC
Percentile values of daily loss(gain) in per cent
| 0.5 | 1 | 5 | 10 | 25 | 50 | 75 | 90 | 95 | 99 | 99.5 |
| -0.08 |
-0.06 |
-0.03 |
-0.02 |
-0.01 |
0.00 |
0.01 |
0.03 |
0.04 |
0.06 |
0.00 |
Daily log-return distribution fitting results
| Distribution | Location, a | Scale, b |
| Logistic |
-0.365 |
0.097 |
Linear regression results [Model: y=log(percentile of log-return), x=|log-return|]
| Variable | Coef(b) | s.e.(b) | t-value | P-value |
| Constant |
-0.849 |
0.053 |
-16.005 |
0.0000 |
|log-return| |
-67.621 |
2.818 |
-23.993 |
0.0000 |
I(right-tail) |
-0.089 |
0.075 |
-1.193 |
0.2331 |
|log-return|*I(right-tail) |
2.793 |
4.008 |
0.697 |
0.4861 |
Hurst exponent (of daily return price)
| 12-day | 24-day | 48-day | 96-day |
| 0.658 |
0.760 |
0.896 |
0.730 |
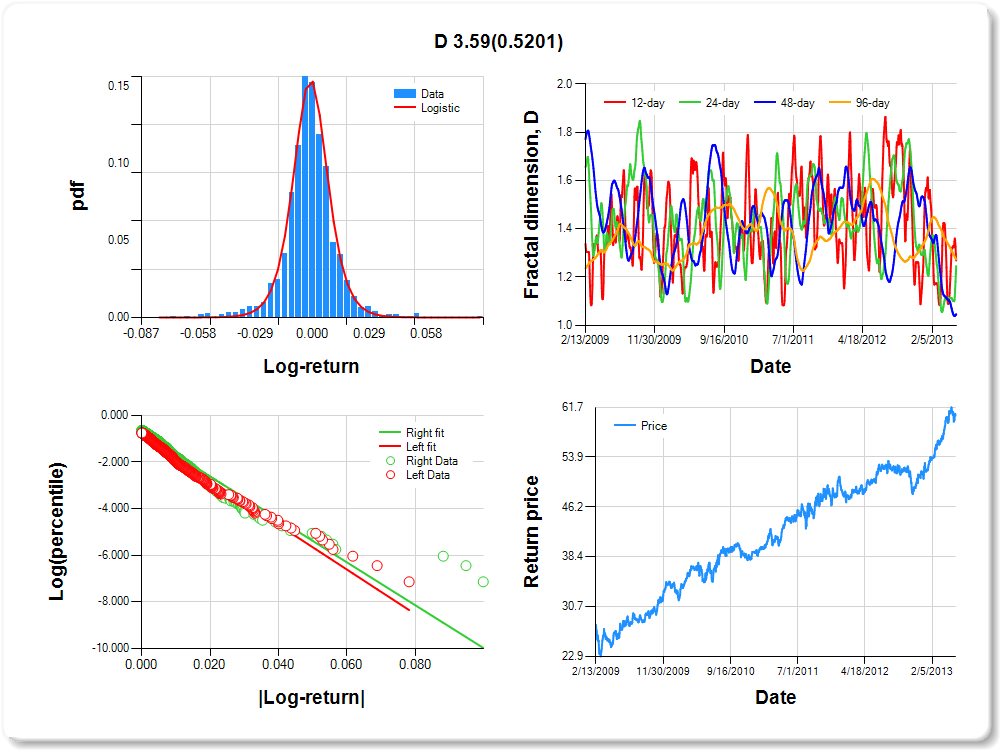
D
Percentile values of daily loss(gain) in per cent
| 0.5 | 1 | 5 | 10 | 25 | 50 | 75 | 90 | 95 | 99 | 99.5 |
| -0.05 |
-0.04 |
-0.02 |
-0.01 |
-0.01 |
0.00 |
0.01 |
0.02 |
0.04 |
0.05 |
2.18 |
Daily log-return distribution fitting results
| Distribution | Location, a | Scale, b |
| Logistic |
-0.194 |
0.111 |
Linear regression results [Model: y=log(percentile of log-return), x=|log-return|]
| Variable | Coef(b) | s.e.(b) | t-value | P-value |
| Constant |
-0.869 |
0.056 |
-15.549 |
0.0000 |
|log-return| |
-95.505 |
4.072 |
-23.457 |
0.0000 |
I(right-tail) |
0.093 |
0.077 |
1.201 |
0.2299 |
|log-return|*I(right-tail) |
3.587 |
5.575 |
0.643 |
0.5201 |
Hurst exponent (of daily return price)
| 12-day | 24-day | 48-day | 96-day |
| 0.731 |
0.754 |
0.954 |
0.727 |
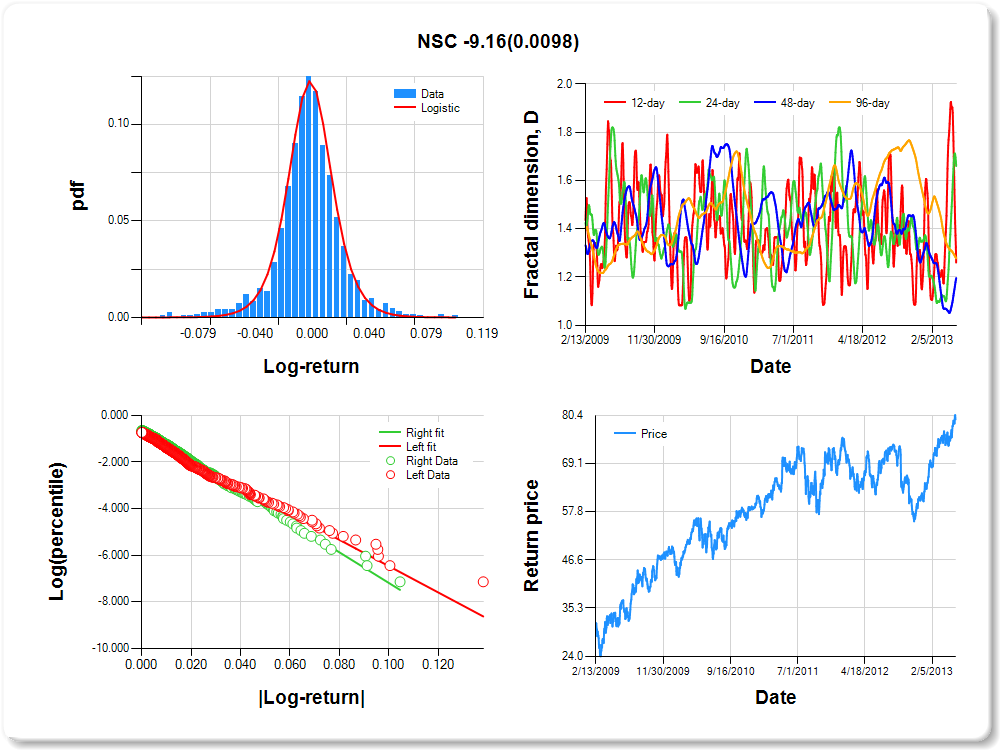
NSC
Percentile values of daily loss(gain) in per cent
| 0.5 | 1 | 5 | 10 | 25 | 50 | 75 | 90 | 95 | 99 | 99.5 |
| -0.08 |
-0.07 |
-0.04 |
-0.02 |
-0.01 |
0.00 |
0.01 |
0.04 |
0.06 |
0.07 |
-0.06 |
Daily log-return distribution fitting results
| Distribution | Location, a | Scale, b |
| Logistic |
0.249 |
0.141 |
Linear regression results [Model: y=log(percentile of log-return), x=|log-return|]
| Variable | Coef(b) | s.e.(b) | t-value | P-value |
| Constant |
-0.823 |
0.056 |
-14.739 |
0.0000 |
|log-return| |
-56.419 |
2.368 |
-23.828 |
0.0000 |
I(right-tail) |
0.197 |
0.080 |
2.475 |
0.0134 |
|log-return|*I(right-tail) |
-9.155 |
3.537 |
-2.589 |
0.0098 |
Hurst exponent (of daily return price)
| 12-day | 24-day | 48-day | 96-day |
| 0.740 |
0.340 |
0.804 |
0.723 |
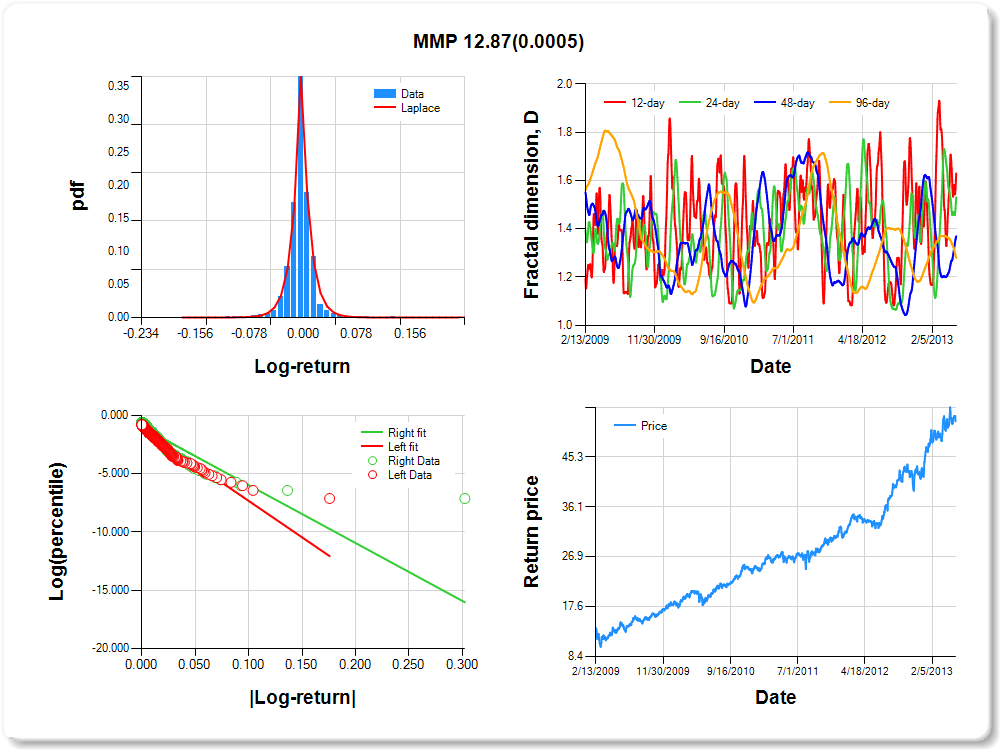
MMP
Percentile values of daily loss(gain) in per cent
| 0.5 | 1 | 5 | 10 | 25 | 50 | 75 | 90 | 95 | 99 | 99.5 |
| -0.07 |
-0.05 |
-0.02 |
-0.02 |
-0.01 |
0.00 |
0.01 |
0.02 |
0.05 |
0.07 |
1.04 |
Daily log-return distribution fitting results
| Distribution | Location, a | Scale, b |
| Laplace |
-0.441 |
0.086 |
Linear regression results [Model: y=log(percentile of log-return), x=|log-return|]
| Variable | Coef(b) | s.e.(b) | t-value | P-value |
| Constant |
-1.083 |
0.054 |
-20.059 |
0.0000 |
|log-return| |
-62.517 |
2.862 |
-21.845 |
0.0000 |
I(right-tail) |
0.065 |
0.071 |
0.908 |
0.3640 |
|log-return|*I(right-tail) |
12.867 |
3.665 |
3.511 |
0.0005 |
Hurst exponent (of daily return price)
| 12-day | 24-day | 48-day | 96-day |
| 0.370 |
0.469 |
0.631 |
0.721 |
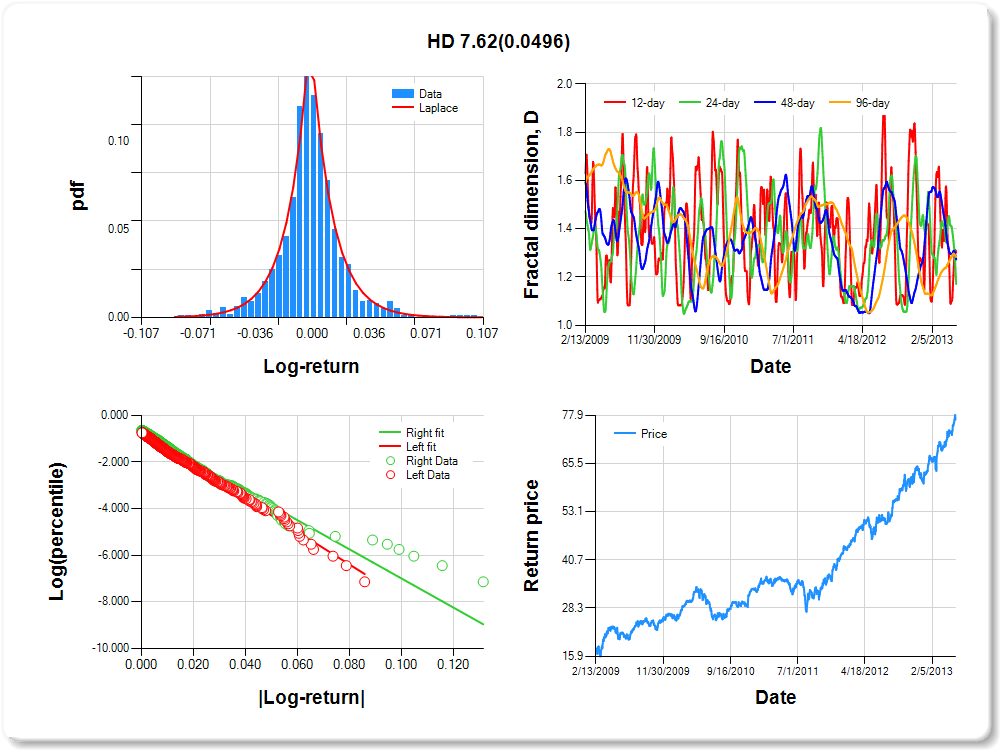
HD
Percentile values of daily loss(gain) in per cent
| 0.5 | 1 | 5 | 10 | 25 | 50 | 75 | 90 | 95 | 99 | 99.5 |
| -0.06 |
-0.05 |
-0.03 |
-0.02 |
-0.01 |
0.00 |
0.01 |
0.03 |
0.06 |
0.08 |
0.75 |
Daily log-return distribution fitting results
| Distribution | Location, a | Scale, b |
| Laplace |
-0.348 |
0.212 |
Linear regression results [Model: y=log(percentile of log-return), x=|log-return|]
| Variable | Coef(b) | s.e.(b) | t-value | P-value |
| Constant |
-0.793 |
0.057 |
-13.815 |
0.0000 |
|log-return| |
-70.050 |
2.944 |
-23.795 |
0.0000 |
I(right-tail) |
0.040 |
0.078 |
0.514 |
0.6071 |
|log-return|*I(right-tail) |
7.616 |
3.876 |
1.965 |
0.0496 |
Hurst exponent (of daily return price)
| 12-day | 24-day | 48-day | 96-day |
| 0.699 |
0.829 |
0.727 |
0.717 |
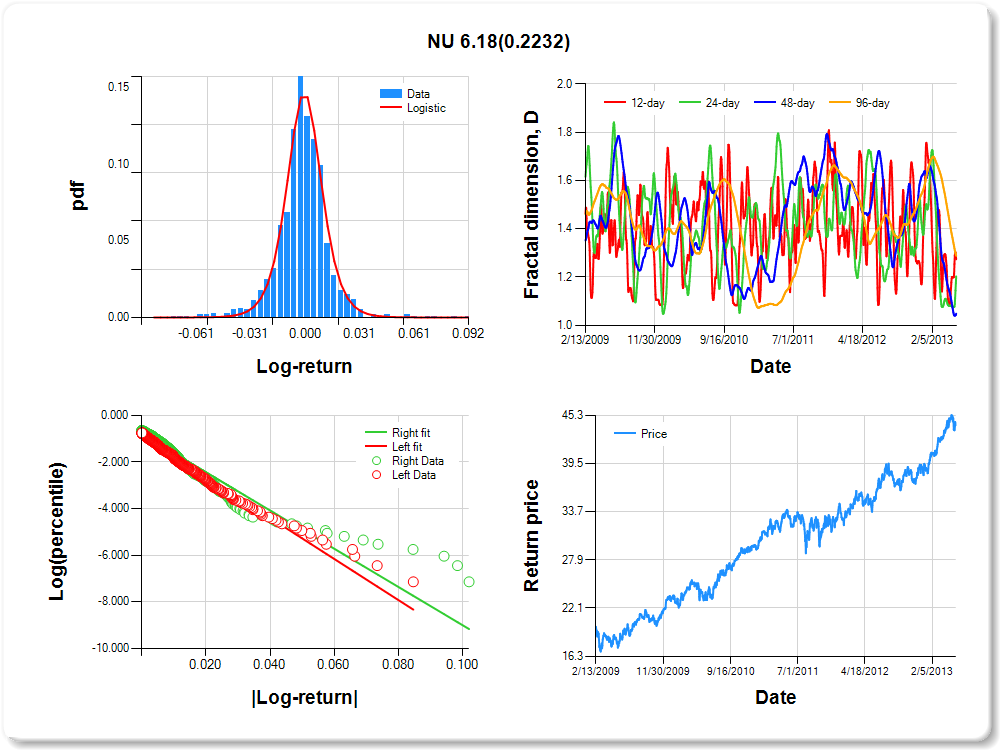
NU
Percentile values of daily loss(gain) in per cent
| 0.5 | 1 | 5 | 10 | 25 | 50 | 75 | 90 | 95 | 99 | 99.5 |
| -0.06 |
-0.04 |
-0.02 |
-0.01 |
-0.01 |
0.00 |
0.01 |
0.02 |
0.04 |
0.07 |
1.68 |
Daily log-return distribution fitting results
| Distribution | Location, a | Scale, b |
| Logistic |
-0.137 |
0.117 |
Linear regression results [Model: y=log(percentile of log-return), x=|log-return|]
| Variable | Coef(b) | s.e.(b) | t-value | P-value |
| Constant |
-0.854 |
0.056 |
-15.246 |
0.0000 |
|log-return| |
-88.095 |
3.737 |
-23.576 |
0.0000 |
I(right-tail) |
0.066 |
0.077 |
0.855 |
0.3928 |
|log-return|*I(right-tail) |
6.180 |
5.071 |
1.219 |
0.2232 |
Hurst exponent (of daily return price)
| 12-day | 24-day | 48-day | 96-day |
| 0.726 |
0.797 |
0.952 |
0.712 |
PFE
Percentile values of daily loss(gain) in per cent
| 0.5 | 1 | 5 | 10 | 25 | 50 | 75 | 90 | 95 | 99 | 99.5 |
| -0.06 |
-0.04 |
-0.03 |
-0.02 |
-0.01 |
0.00 |
0.01 |
0.03 |
0.05 |
0.06 |
1.34 |
Daily log-return distribution fitting results
| Distribution | Location, a | Scale, b |
| Logistic |
0.099 |
0.125 |
Linear regression results [Model: y=log(percentile of log-return), x=|log-return|]
| Variable | Coef(b) | s.e.(b) | t-value | P-value |
| Constant |
-0.813 |
0.055 |
-14.755 |
0.0000 |
|log-return| |
-78.961 |
3.300 |
-23.930 |
0.0000 |
I(right-tail) |
0.134 |
0.080 |
1.676 |
0.0940 |
|log-return|*I(right-tail) |
-1.787 |
4.691 |
-0.381 |
0.7034 |
Hurst exponent (of daily return price)
| 12-day | 24-day | 48-day | 96-day |
| 0.676 |
0.608 |
0.848 |
0.711 |

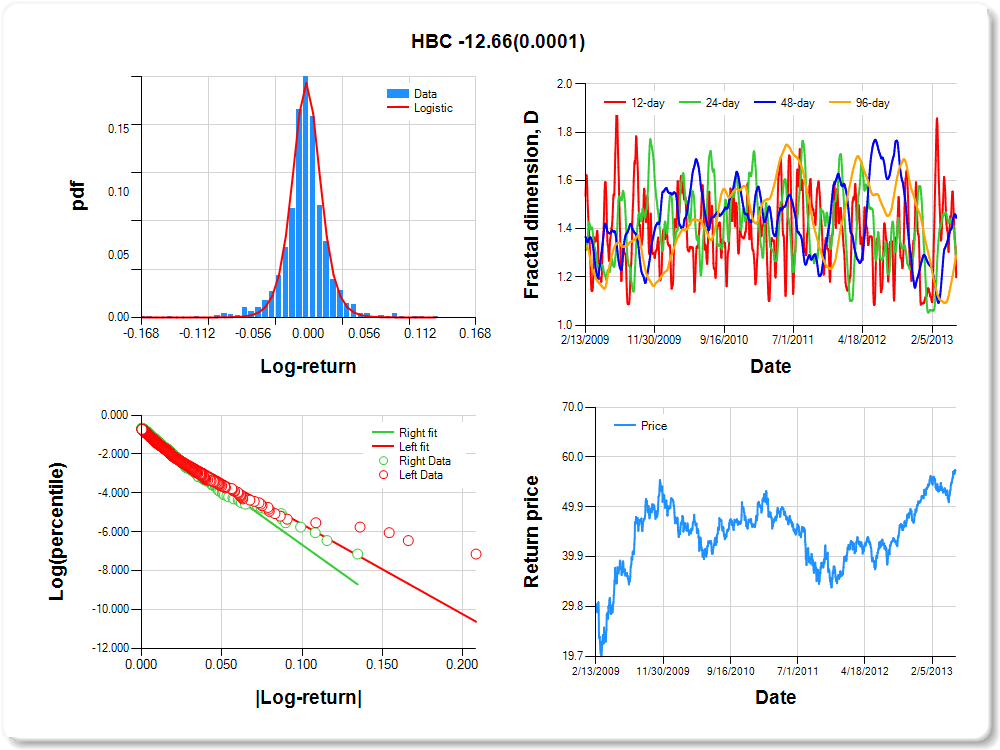
HBC
Percentile values of daily loss(gain) in per cent
| 0.5 | 1 | 5 | 10 | 25 | 50 | 75 | 90 | 95 | 99 | 99.5 |
| -0.09 |
-0.07 |
-0.03 |
-0.02 |
-0.01 |
0.00 |
0.01 |
0.03 |
0.06 |
0.09 |
0.79 |
Daily log-return distribution fitting results
| Distribution | Location, a | Scale, b |
| Logistic |
0.377 |
0.092 |
Linear regression results [Model: y=log(percentile of log-return), x=|log-return|]
| Variable | Coef(b) | s.e.(b) | t-value | P-value |
| Constant |
-0.984 |
0.052 |
-19.045 |
0.0000 |
|log-return| |
-46.203 |
2.001 |
-23.093 |
0.0000 |
I(right-tail) |
0.212 |
0.074 |
2.849 |
0.0045 |
|log-return|*I(right-tail) |
-12.659 |
3.123 |
-4.054 |
0.0001 |
Hurst exponent (of daily return price)
| 12-day | 24-day | 48-day | 96-day |
| 0.801 |
0.711 |
0.555 |
0.711 |
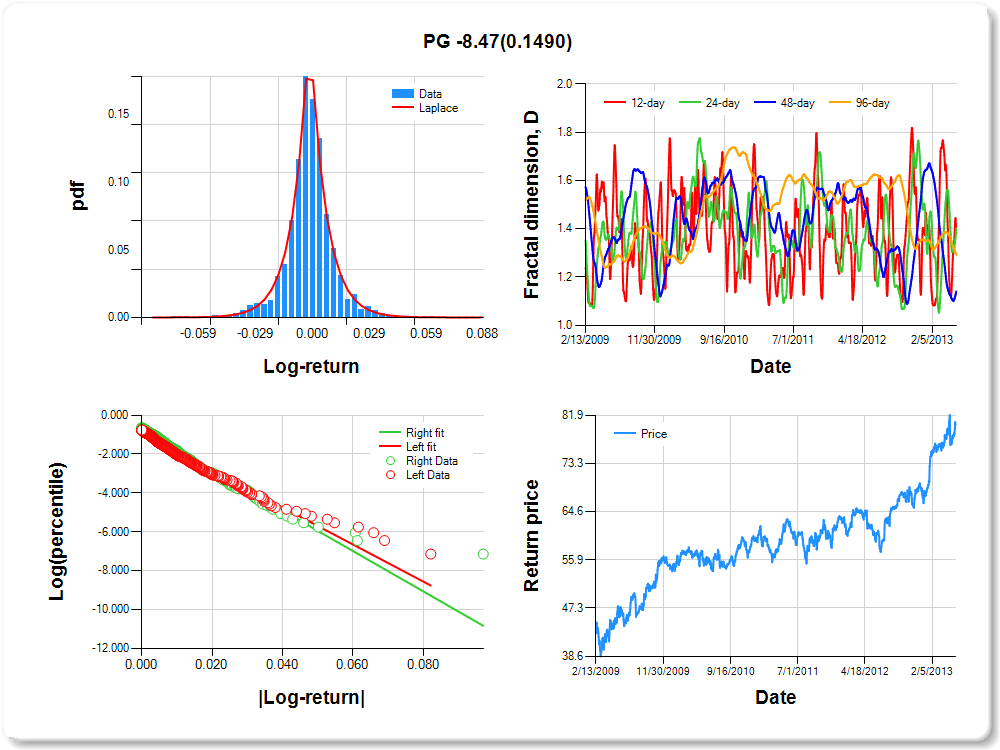
PG
Percentile values of daily loss(gain) in per cent
| 0.5 | 1 | 5 | 10 | 25 | 50 | 75 | 90 | 95 | 99 | 99.5 |
| -0.05 |
-0.04 |
-0.02 |
-0.01 |
0.00 |
0.00 |
0.01 |
0.02 |
0.04 |
0.04 |
1.17 |
Daily log-return distribution fitting results
| Distribution | Location, a | Scale, b |
| Laplace |
-0.138 |
0.158 |
Linear regression results [Model: y=log(percentile of log-return), x=|log-return|]
| Variable | Coef(b) | s.e.(b) | t-value | P-value |
| Constant |
-0.915 |
0.055 |
-16.687 |
0.0000 |
|log-return| |
-95.360 |
4.082 |
-23.364 |
0.0000 |
I(right-tail) |
0.173 |
0.077 |
2.257 |
0.0242 |
|log-return|*I(right-tail) |
-8.469 |
5.865 |
-1.444 |
0.1490 |
Hurst exponent (of daily return price)
| 12-day | 24-day | 48-day | 96-day |
| 0.617 |
0.598 |
0.860 |
0.708 |
DTE
Percentile values of daily loss(gain) in per cent
| 0.5 | 1 | 5 | 10 | 25 | 50 | 75 | 90 | 95 | 99 | 99.5 |
| -0.06 |
-0.05 |
-0.02 |
-0.01 |
-0.01 |
0.00 |
0.01 |
0.02 |
0.04 |
0.07 |
0.81 |
Daily log-return distribution fitting results
| Distribution | Location, a | Scale, b |
| Logistic |
-0.220 |
0.099 |
Linear regression results [Model: y=log(percentile of log-return), x=|log-return|]
| Variable | Coef(b) | s.e.(b) | t-value | P-value |
| Constant |
-0.922 |
0.058 |
-16.031 |
0.0000 |
|log-return| |
-84.446 |
3.708 |
-22.777 |
0.0000 |
I(right-tail) |
0.127 |
0.076 |
1.673 |
0.0947 |
|log-return|*I(right-tail) |
4.197 |
4.944 |
0.849 |
0.3961 |
Hurst exponent (of daily return price)
| 12-day | 24-day | 48-day | 96-day |
| 0.711 |
0.811 |
0.960 |
0.703 |

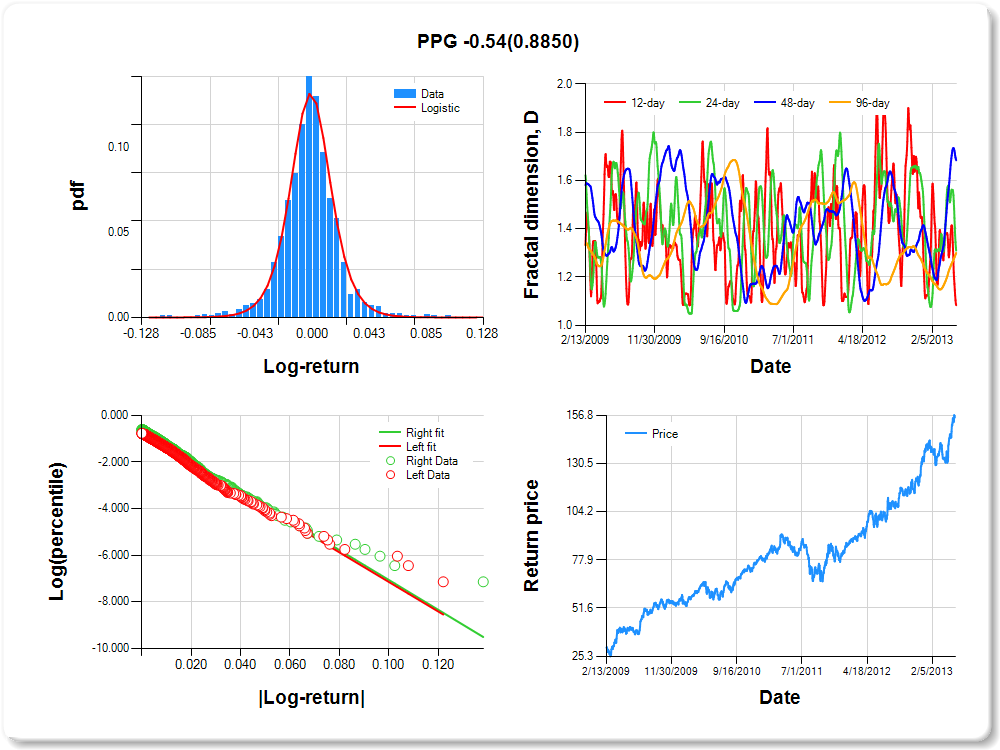
PPG
Percentile values of daily loss(gain) in per cent
| 0.5 | 1 | 5 | 10 | 25 | 50 | 75 | 90 | 95 | 99 | 99.5 |
| -0.07 |
-0.06 |
-0.03 |
-0.02 |
-0.01 |
0.00 |
0.01 |
0.04 |
0.06 |
0.07 |
0.66 |
Daily log-return distribution fitting results
| Distribution | Location, a | Scale, b |
| Logistic |
-0.090 |
0.130 |
Linear regression results [Model: y=log(percentile of log-return), x=|log-return|]
| Variable | Coef(b) | s.e.(b) | t-value | P-value |
| Constant |
-0.800 |
0.059 |
-13.642 |
0.0000 |
|log-return| |
-63.383 |
2.715 |
-23.344 |
0.0000 |
I(right-tail) |
0.138 |
0.080 |
1.735 |
0.0830 |
|log-return|*I(right-tail) |
-0.537 |
3.710 |
-0.145 |
0.8850 |
Hurst exponent (of daily return price)
| 12-day | 24-day | 48-day | 96-day |
| 0.917 |
0.690 |
0.316 |
0.700 |
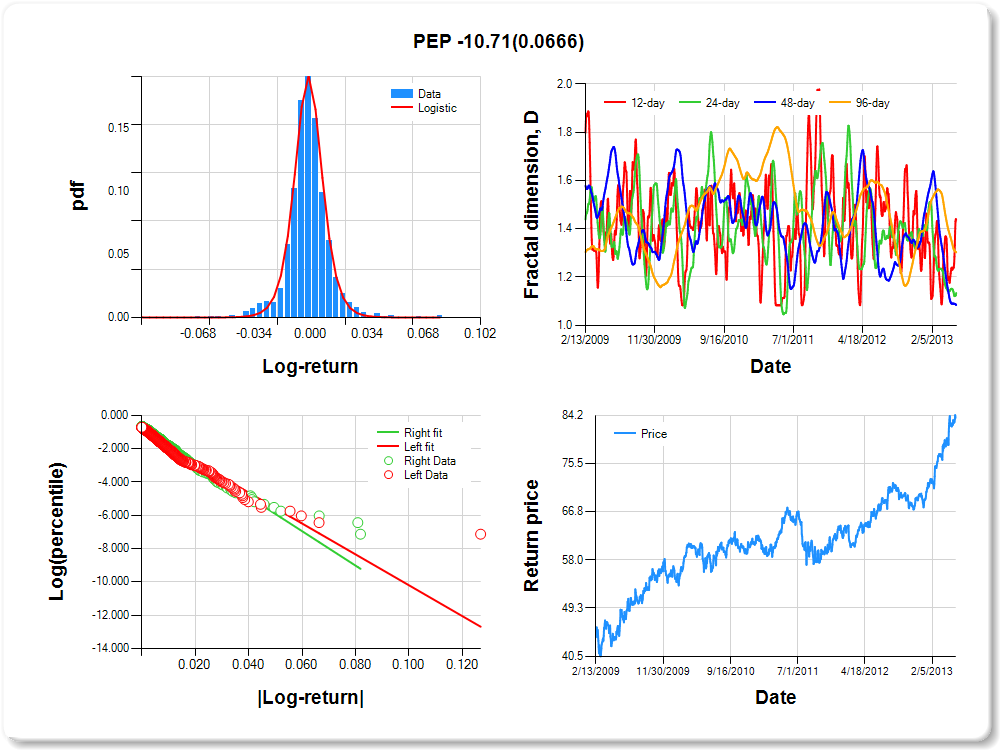
PEP
Percentile values of daily loss(gain) in per cent
| 0.5 | 1 | 5 | 10 | 25 | 50 | 75 | 90 | 95 | 99 | 99.5 |
| -0.04 |
-0.03 |
-0.02 |
-0.01 |
-0.01 |
0.00 |
0.01 |
0.02 |
0.03 |
0.04 |
0.44 |
Daily log-return distribution fitting results
| Distribution | Location, a | Scale, b |
| Logistic |
0.376 |
0.090 |
Linear regression results [Model: y=log(percentile of log-return), x=|log-return|]
| Variable | Coef(b) | s.e.(b) | t-value | P-value |
| Constant |
-0.928 |
0.053 |
-17.563 |
0.0000 |
|log-return| |
-92.657 |
4.006 |
-23.128 |
0.0000 |
I(right-tail) |
0.184 |
0.076 |
2.416 |
0.0158 |
|log-return|*I(right-tail) |
-10.713 |
5.836 |
-1.836 |
0.0666 |
Hurst exponent (of daily return price)
| 12-day | 24-day | 48-day | 96-day |
| 0.563 |
0.866 |
0.916 |
0.698 |
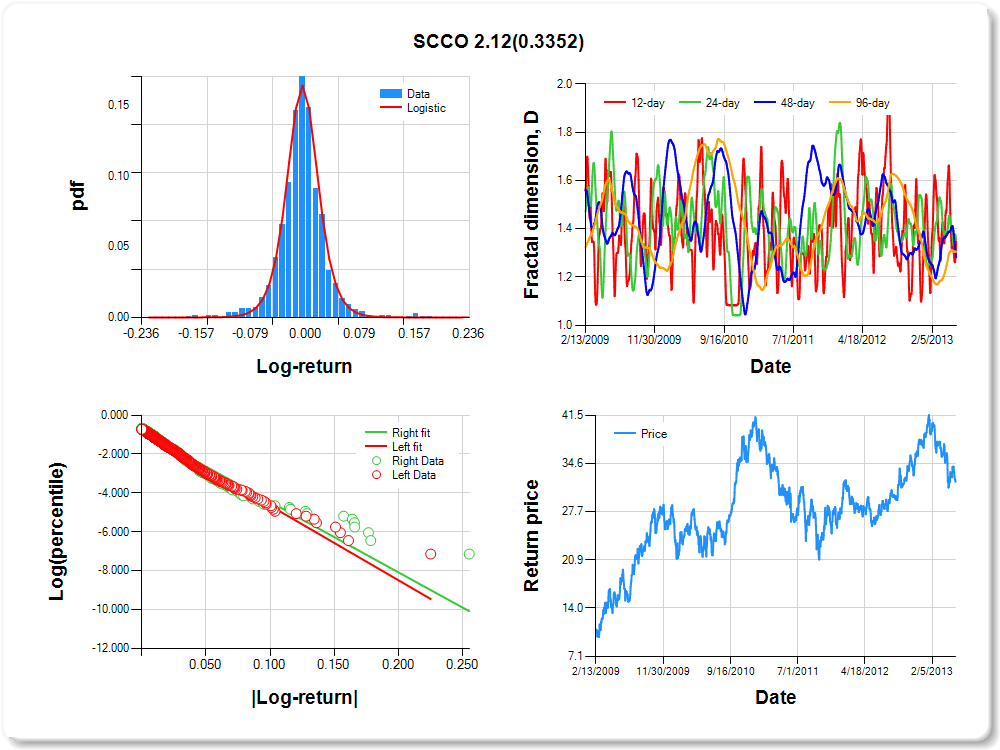
SCCO
Percentile values of daily loss(gain) in per cent
| 0.5 | 1 | 5 | 10 | 25 | 50 | 75 | 90 | 95 | 99 | 99.5 |
| -0.13 |
-0.09 |
-0.05 |
-0.03 |
-0.02 |
0.00 |
0.02 |
0.05 |
0.10 |
0.17 |
1.52 |
Daily log-return distribution fitting results
| Distribution | Location, a | Scale, b |
| Logistic |
-0.103 |
0.105 |
Linear regression results [Model: y=log(percentile of log-return), x=|log-return|]
| Variable | Coef(b) | s.e.(b) | t-value | P-value |
| Constant |
-0.810 |
0.055 |
-14.607 |
0.0000 |
|log-return| |
-38.337 |
1.604 |
-23.905 |
0.0000 |
I(right-tail) |
-0.018 |
0.076 |
-0.237 |
0.8128 |
|log-return|*I(right-tail) |
2.119 |
2.198 |
0.964 |
0.3352 |
Hurst exponent (of daily return price)
| 12-day | 24-day | 48-day | 96-day |
| 0.651 |
0.644 |
0.717 |
0.695 |
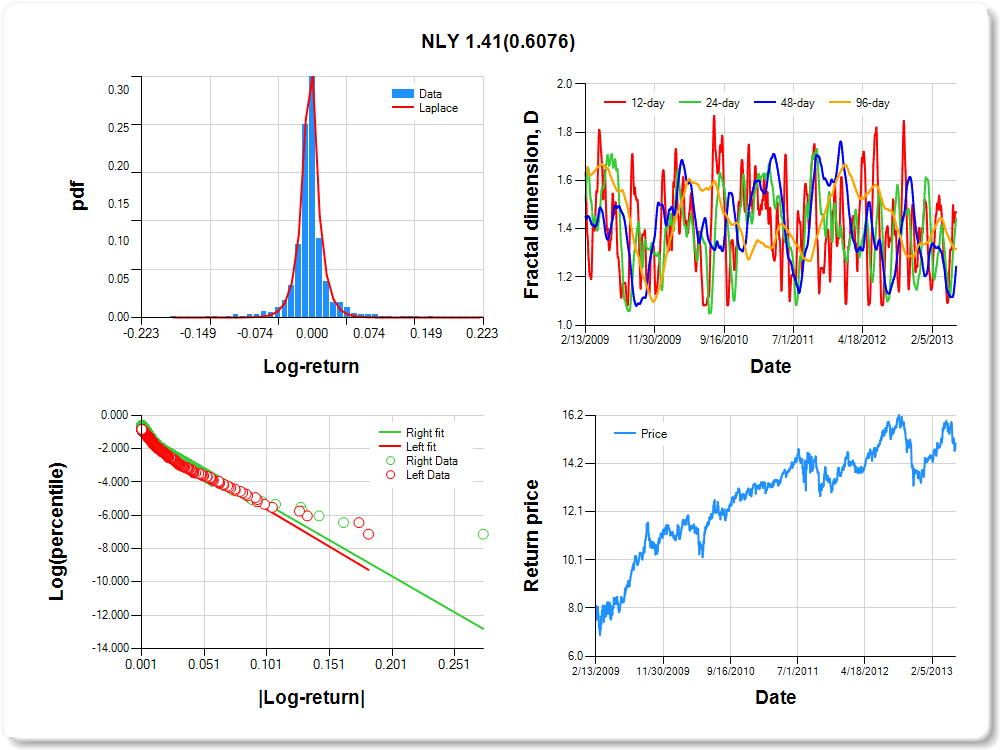
NLY
Percentile values of daily loss(gain) in per cent
| 0.5 | 1 | 5 | 10 | 25 | 50 | 75 | 90 | 95 | 99 | 99.5 |
| -0.09 |
-0.08 |
-0.03 |
-0.02 |
-0.01 |
0.00 |
0.01 |
0.04 |
0.08 |
0.10 |
0.51 |
Daily log-return distribution fitting results
| Distribution | Location, a | Scale, b |
| Laplace |
-0.335 |
0.079 |
Linear regression results [Model: y=log(percentile of log-return), x=|log-return|]
| Variable | Coef(b) | s.e.(b) | t-value | P-value |
| Constant |
-1.161 |
0.053 |
-21.913 |
0.0000 |
|log-return| |
-44.664 |
2.049 |
-21.793 |
0.0000 |
I(right-tail) |
0.172 |
0.070 |
2.447 |
0.0145 |
|log-return|*I(right-tail) |
1.407 |
2.739 |
0.514 |
0.6076 |
Hurst exponent (of daily return price)
| 12-day | 24-day | 48-day | 96-day |
| 0.531 |
0.557 |
0.756 |
0.683 |
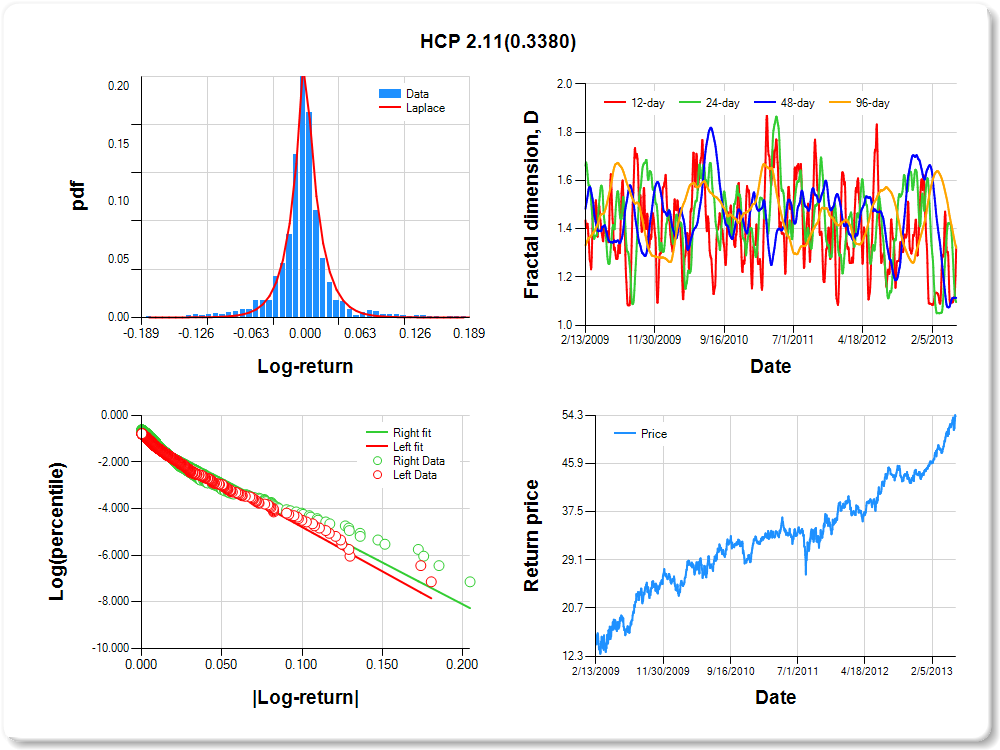
HCP
Percentile values of daily loss(gain) in per cent
| 0.5 | 1 | 5 | 10 | 25 | 50 | 75 | 90 | 95 | 99 | 99.5 |
| -0.12 |
-0.10 |
-0.05 |
-0.03 |
-0.01 |
0.00 |
0.01 |
0.05 |
0.12 |
0.15 |
1.26 |
Daily log-return distribution fitting results
| Distribution | Location, a | Scale, b |
| Laplace |
-0.085 |
0.139 |
Linear regression results [Model: y=log(percentile of log-return), x=|log-return|]
| Variable | Coef(b) | s.e.(b) | t-value | P-value |
| Constant |
-0.997 |
0.054 |
-18.500 |
0.0000 |
|log-return| |
-37.923 |
1.641 |
-23.108 |
0.0000 |
I(right-tail) |
0.062 |
0.072 |
0.864 |
0.3877 |
|log-return|*I(right-tail) |
2.110 |
2.202 |
0.959 |
0.3380 |
Hurst exponent (of daily return price)
| 12-day | 24-day | 48-day | 96-day |
| 0.673 |
0.904 |
0.886 |
0.680 |
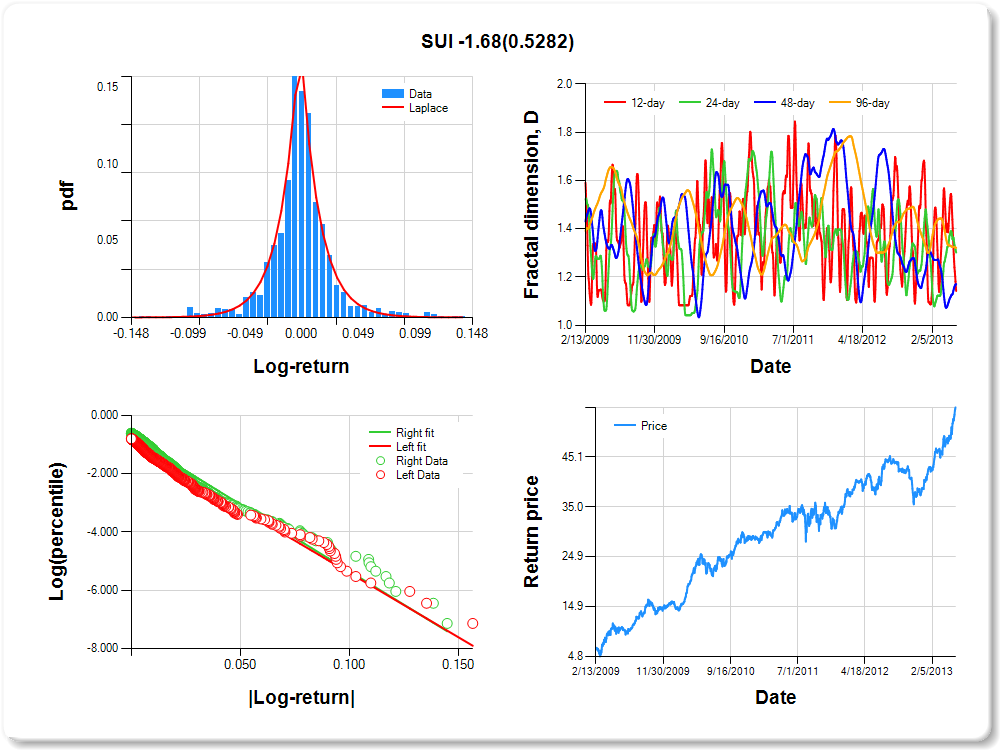
SUI
Percentile values of daily loss(gain) in per cent
| 0.5 | 1 | 5 | 10 | 25 | 50 | 75 | 90 | 95 | 99 | 99.5 |
| -0.09 |
-0.09 |
-0.04 |
-0.03 |
-0.01 |
0.00 |
0.01 |
0.04 |
0.09 |
0.12 |
0.75 |
Daily log-return distribution fitting results
| Distribution | Location, a | Scale, b |
| Laplace |
0.080 |
0.187 |
Linear regression results [Model: y=log(percentile of log-return), x=|log-return|]
| Variable | Coef(b) | s.e.(b) | t-value | P-value |
| Constant |
-0.976 |
0.055 |
-17.595 |
0.0000 |
|log-return| |
-44.244 |
1.932 |
-22.899 |
0.0000 |
I(right-tail) |
0.222 |
0.076 |
2.935 |
0.0034 |
|log-return|*I(right-tail) |
-1.676 |
2.656 |
-0.631 |
0.5282 |
Hurst exponent (of daily return price)
| 12-day | 24-day | 48-day | 96-day |
| 0.858 |
0.698 |
0.829 |
0.679 |
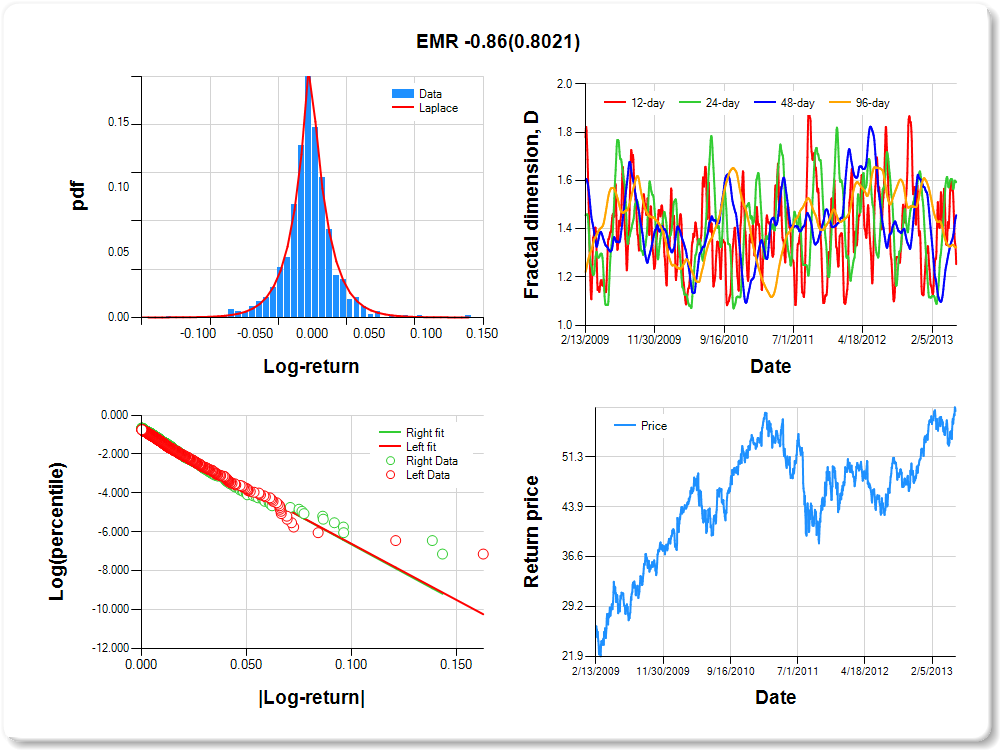
EMR
Percentile values of daily loss(gain) in per cent
| 0.5 | 1 | 5 | 10 | 25 | 50 | 75 | 90 | 95 | 99 | 99.5 |
| -0.07 |
-0.06 |
-0.03 |
-0.02 |
-0.01 |
0.00 |
0.01 |
0.03 |
0.06 |
0.09 |
0.32 |
Daily log-return distribution fitting results
| Distribution | Location, a | Scale, b |
| Laplace |
0.118 |
0.165 |
Linear regression results [Model: y=log(percentile of log-return), x=|log-return|]
| Variable | Coef(b) | s.e.(b) | t-value | P-value |
| Constant |
-0.836 |
0.056 |
-14.940 |
0.0000 |
|log-return| |
-57.762 |
2.449 |
-23.590 |
0.0000 |
I(right-tail) |
0.056 |
0.077 |
0.733 |
0.4638 |
|log-return|*I(right-tail) |
-0.857 |
3.419 |
-0.251 |
0.8021 |
Hurst exponent (of daily return price)
| 12-day | 24-day | 48-day | 96-day |
| 0.746 |
0.406 |
0.544 |
0.676 |
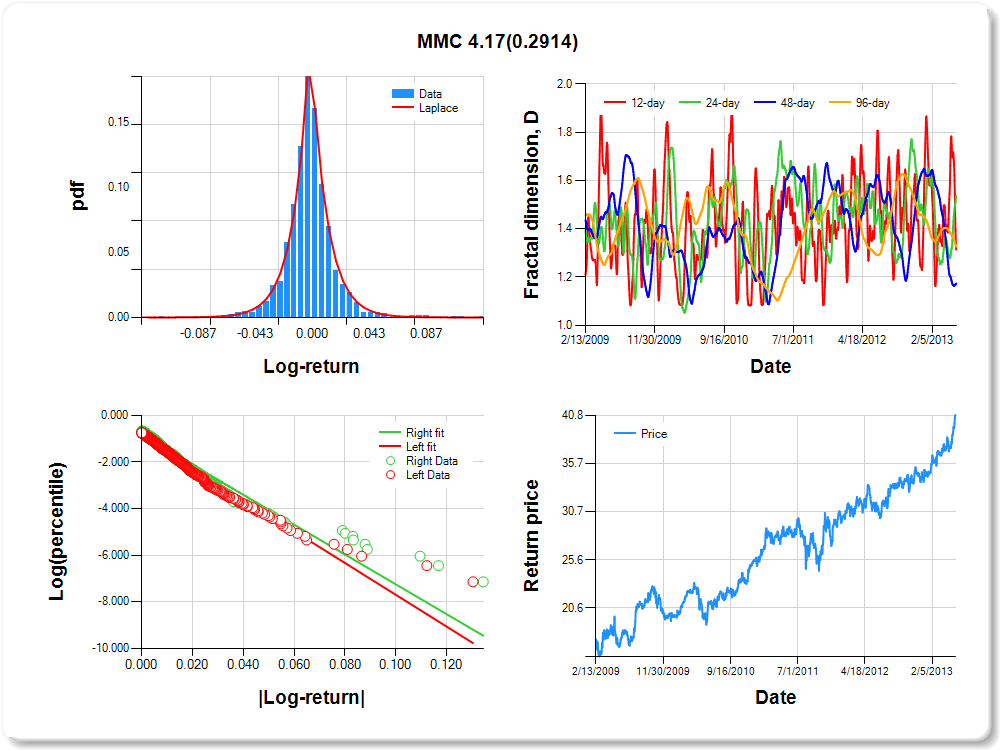
MMC
Percentile values of daily loss(gain) in per cent
| 0.5 | 1 | 5 | 10 | 25 | 50 | 75 | 90 | 95 | 99 | 99.5 |
| -0.06 |
-0.05 |
-0.03 |
-0.02 |
-0.01 |
0.00 |
0.01 |
0.03 |
0.06 |
0.09 |
1.84 |
Daily log-return distribution fitting results
| Distribution | Location, a | Scale, b |
| Laplace |
-0.015 |
0.158 |
Linear regression results [Model: y=log(percentile of log-return), x=|log-return|]
| Variable | Coef(b) | s.e.(b) | t-value | P-value |
| Constant |
-0.870 |
0.056 |
-15.628 |
0.0000 |
|log-return| |
-68.106 |
2.917 |
-23.347 |
0.0000 |
I(right-tail) |
0.031 |
0.077 |
0.404 |
0.6860 |
|log-return|*I(right-tail) |
4.167 |
3.948 |
1.056 |
0.2914 |
Hurst exponent (of daily return price)
| 12-day | 24-day | 48-day | 96-day |
| 0.686 |
0.463 |
0.827 |
0.675 |
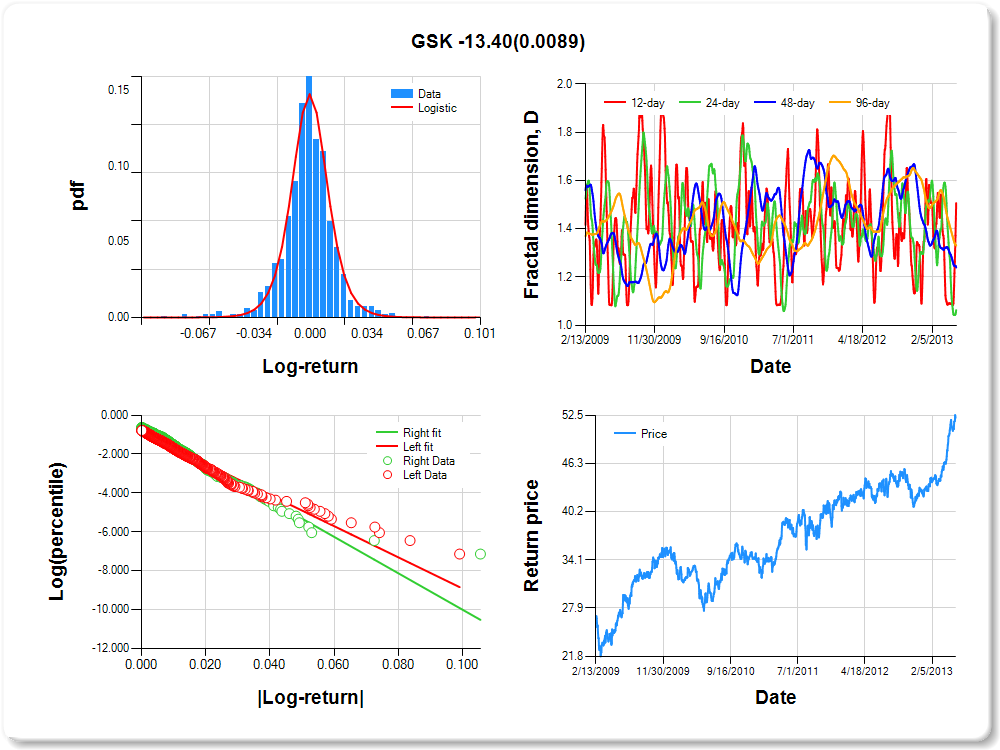
GSK
Percentile values of daily loss(gain) in per cent
| 0.5 | 1 | 5 | 10 | 25 | 50 | 75 | 90 | 95 | 99 | 99.5 |
| -0.06 |
-0.05 |
-0.02 |
-0.02 |
-0.01 |
0.00 |
0.01 |
0.02 |
0.04 |
0.05 |
1.05 |
Daily log-return distribution fitting results
| Distribution | Location, a | Scale, b |
| Logistic |
-0.034 |
0.116 |
Linear regression results [Model: y=log(percentile of log-return), x=|log-return|]
| Variable | Coef(b) | s.e.(b) | t-value | P-value |
| Constant |
-0.880 |
0.057 |
-15.395 |
0.0000 |
|log-return| |
-80.161 |
3.475 |
-23.070 |
0.0000 |
I(right-tail) |
0.256 |
0.080 |
3.196 |
0.0014 |
|log-return|*I(right-tail) |
-13.399 |
5.114 |
-2.620 |
0.0089 |
Hurst exponent (of daily return price)
| 12-day | 24-day | 48-day | 96-day |
| 0.493 |
0.937 |
0.760 |
0.669 |
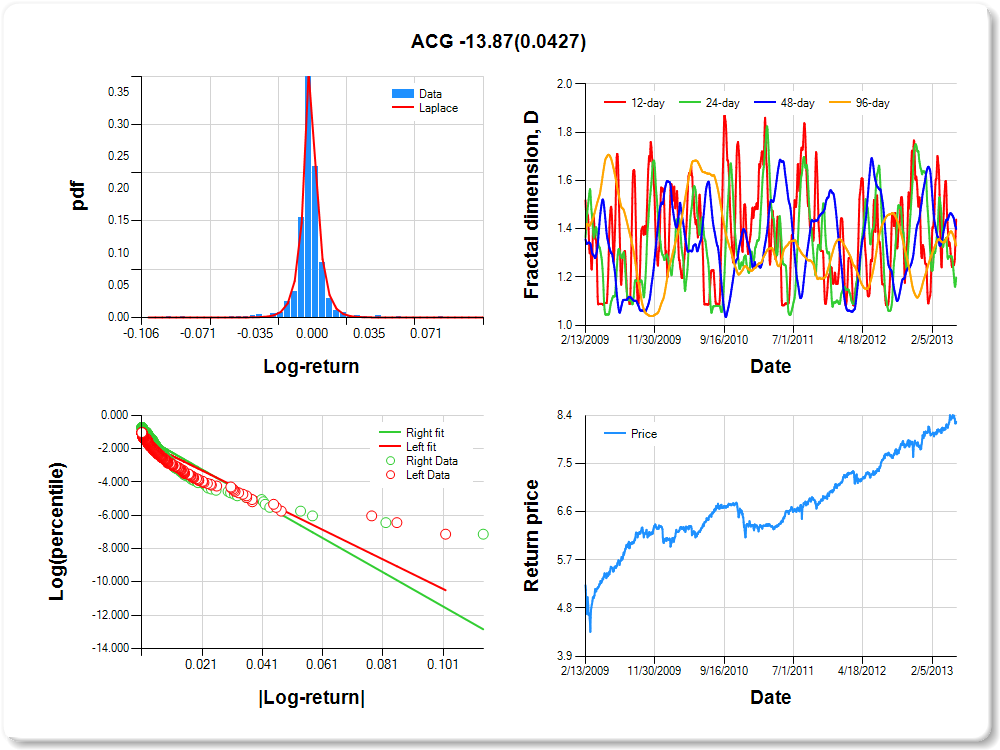
ACG
Percentile values of daily loss(gain) in per cent
| 0.5 | 1 | 5 | 10 | 25 | 50 | 75 | 90 | 95 | 99 | 99.5 |
| -0.04 |
-0.03 |
-0.01 |
-0.01 |
0.00 |
0.00 |
0.00 |
0.01 |
0.03 |
0.04 |
0.88 |
Daily log-return distribution fitting results
| Distribution | Location, a | Scale, b |
| Laplace |
-0.086 |
0.072 |
Linear regression results [Model: y=log(percentile of log-return), x=|log-return|]
| Variable | Coef(b) | s.e.(b) | t-value | P-value |
| Constant |
-1.435 |
0.057 |
-25.050 |
0.0000 |
|log-return| |
-88.944 |
4.785 |
-18.589 |
0.0000 |
I(right-tail) |
0.352 |
0.077 |
4.595 |
0.0000 |
|log-return|*I(right-tail) |
-13.870 |
6.835 |
-2.029 |
0.0427 |
Hurst exponent (of daily return price)
| 12-day | 24-day | 48-day | 96-day |
| 0.562 |
0.802 |
0.601 |
0.669 |
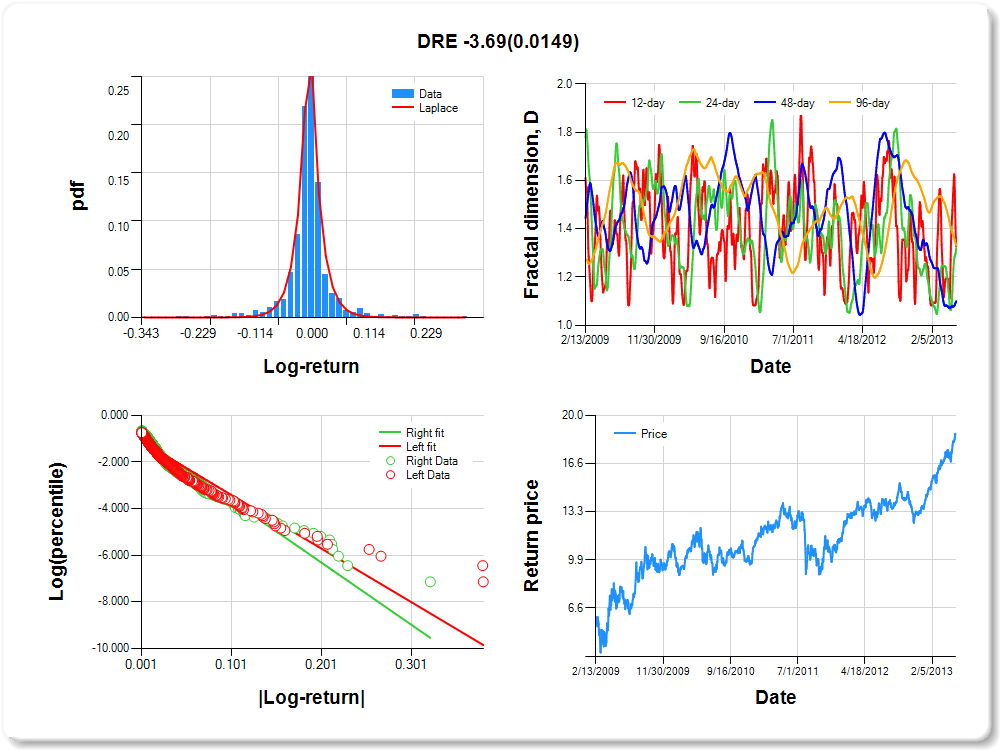
DRE
Percentile values of daily loss(gain) in per cent
| 0.5 | 1 | 5 | 10 | 25 | 50 | 75 | 90 | 95 | 99 | 99.5 |
| -0.18 |
-0.14 |
-0.06 |
-0.04 |
-0.01 |
0.00 |
0.01 |
0.06 |
0.15 |
0.22 |
0.58 |
Daily log-return distribution fitting results
| Distribution | Location, a | Scale, b |
| Laplace |
0.147 |
0.097 |
Linear regression results [Model: y=log(percentile of log-return), x=|log-return|]
| Variable | Coef(b) | s.e.(b) | t-value | P-value |
| Constant |
-1.121 |
0.049 |
-22.743 |
0.0000 |
|log-return| |
-22.973 |
1.017 |
-22.596 |
0.0000 |
I(right-tail) |
0.137 |
0.069 |
1.979 |
0.0480 |
|log-return|*I(right-tail) |
-3.691 |
1.514 |
-2.437 |
0.0149 |
Hurst exponent (of daily return price)
| 12-day | 24-day | 48-day | 96-day |
| 0.673 |
0.680 |
0.900 |
0.669 |
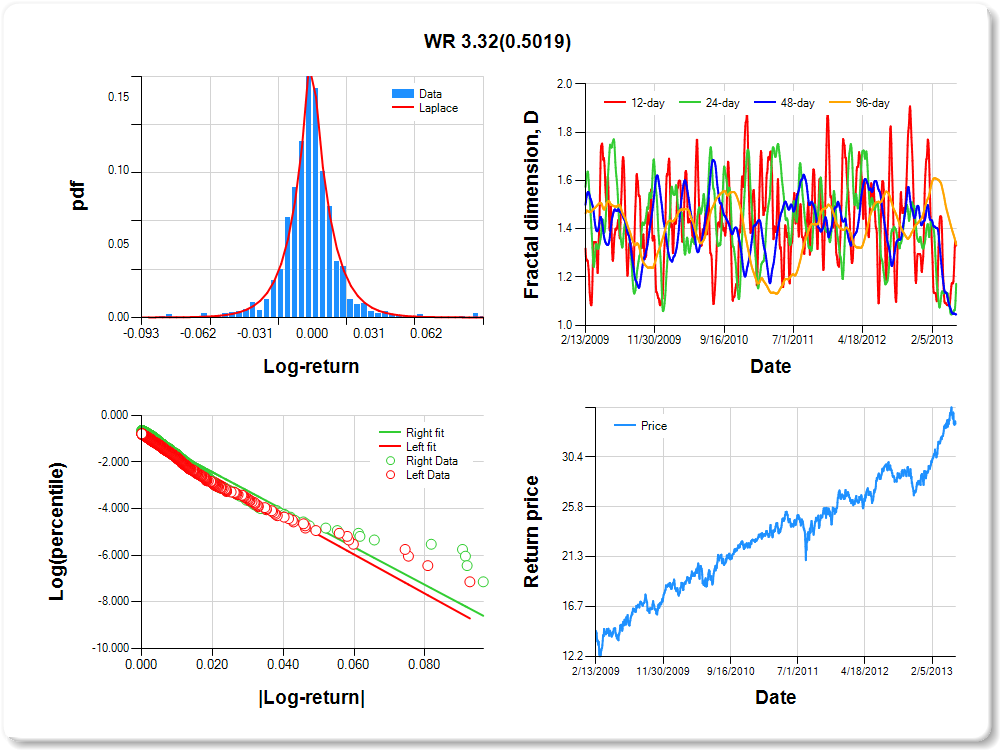
WR
Percentile values of daily loss(gain) in per cent
| 0.5 | 1 | 5 | 10 | 25 | 50 | 75 | 90 | 95 | 99 | 99.5 |
| -0.06 |
-0.04 |
-0.02 |
-0.01 |
-0.01 |
0.00 |
0.01 |
0.02 |
0.04 |
0.06 |
0.43 |
Daily log-return distribution fitting results
| Distribution | Location, a | Scale, b |
| Laplace |
-0.012 |
0.177 |
Linear regression results [Model: y=log(percentile of log-return), x=|log-return|]
| Variable | Coef(b) | s.e.(b) | t-value | P-value |
| Constant |
-0.922 |
0.056 |
-16.352 |
0.0000 |
|log-return| |
-83.780 |
3.657 |
-22.911 |
0.0000 |
I(right-tail) |
0.110 |
0.077 |
1.428 |
0.1536 |
|log-return|*I(right-tail) |
3.320 |
4.942 |
0.672 |
0.5019 |
Hurst exponent (of daily return price)
| 12-day | 24-day | 48-day | 96-day |
| 0.669 |
0.828 |
0.955 |
0.665 |
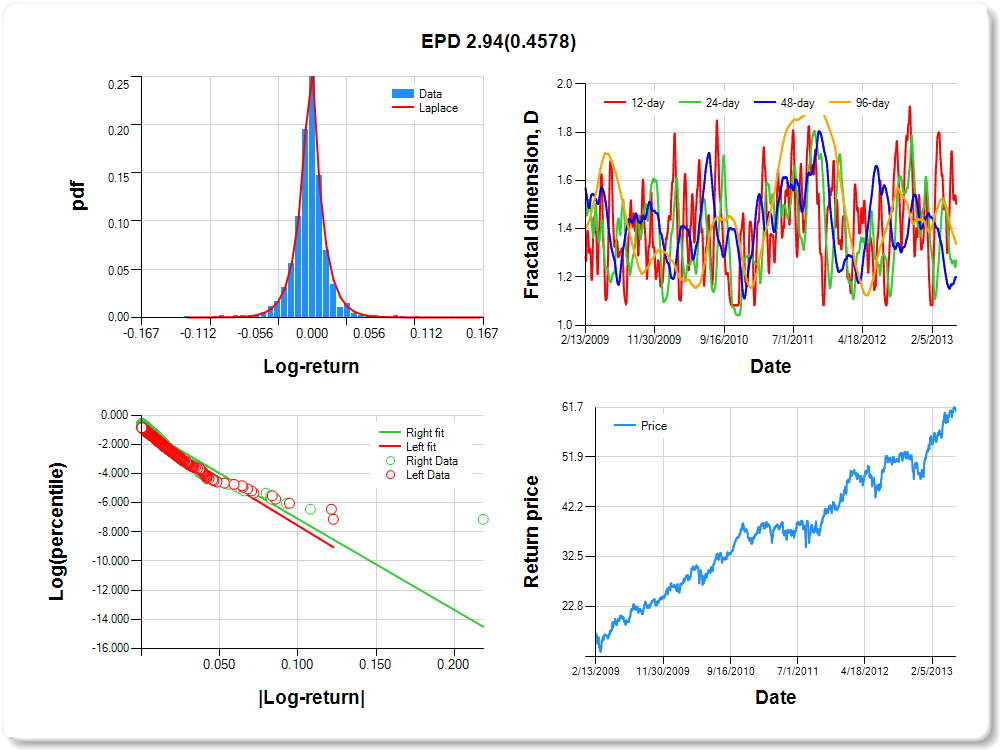
EPD
Percentile values of daily loss(gain) in per cent
| 0.5 | 1 | 5 | 10 | 25 | 50 | 75 | 90 | 95 | 99 | 99.5 |
| -0.07 |
-0.05 |
-0.03 |
-0.02 |
-0.01 |
0.00 |
0.01 |
0.03 |
0.05 |
0.07 |
1.39 |
Daily log-return distribution fitting results
| Distribution | Location, a | Scale, b |
| Laplace |
-0.466 |
0.109 |
Linear regression results [Model: y=log(percentile of log-return), x=|log-return|]
| Variable | Coef(b) | s.e.(b) | t-value | P-value |
| Constant |
-1.039 |
0.057 |
-18.370 |
0.0000 |
|log-return| |
-65.269 |
2.968 |
-21.990 |
0.0000 |
I(right-tail) |
0.168 |
0.074 |
2.269 |
0.0234 |
|log-return|*I(right-tail) |
2.943 |
3.962 |
0.743 |
0.4578 |
Hurst exponent (of daily return price)
| 12-day | 24-day | 48-day | 96-day |
| 0.497 |
0.730 |
0.800 |
0.663 |
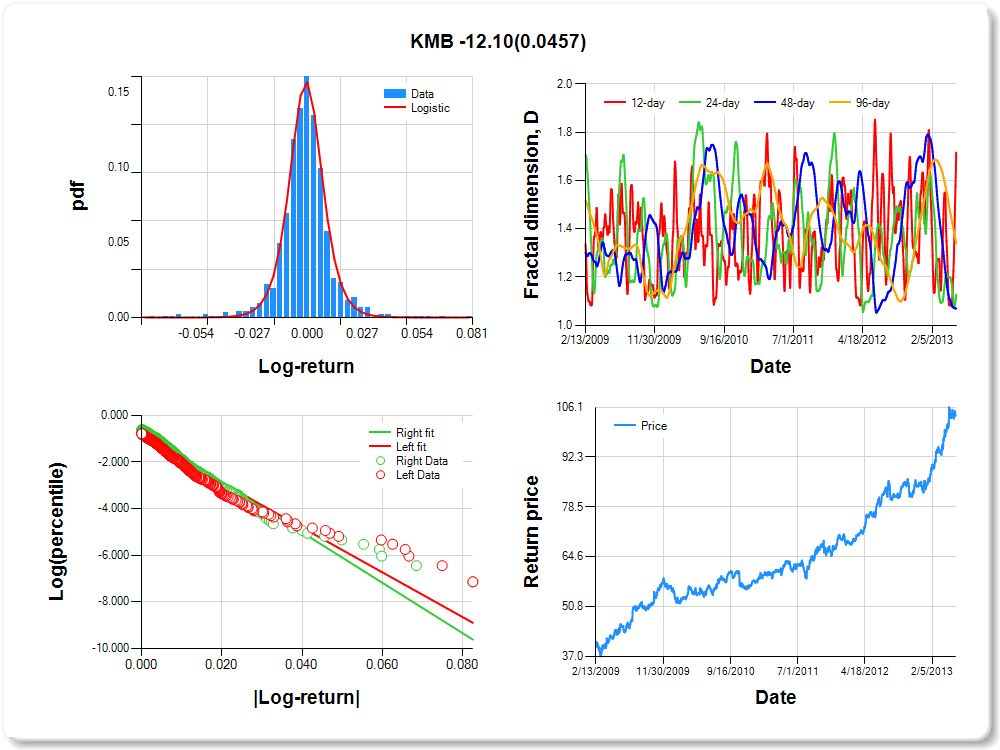
KMB
Percentile values of daily loss(gain) in per cent
| 0.5 | 1 | 5 | 10 | 25 | 50 | 75 | 90 | 95 | 99 | 99.5 |
| -0.06 |
-0.04 |
-0.02 |
-0.01 |
0.00 |
0.00 |
0.01 |
0.02 |
0.03 |
0.05 |
1.16 |
Daily log-return distribution fitting results
| Distribution | Location, a | Scale, b |
| Logistic |
0.021 |
0.109 |
Linear regression results [Model: y=log(percentile of log-return), x=|log-return|]
| Variable | Coef(b) | s.e.(b) | t-value | P-value |
| Constant |
-0.976 |
0.055 |
-17.704 |
0.0000 |
|log-return| |
-95.814 |
4.238 |
-22.606 |
0.0000 |
I(right-tail) |
0.278 |
0.077 |
3.635 |
0.0003 |
|log-return|*I(right-tail) |
-12.097 |
6.047 |
-2.001 |
0.0457 |
Hurst exponent (of daily return price)
| 12-day | 24-day | 48-day | 96-day |
| 0.284 |
0.872 |
0.930 |
0.660 |
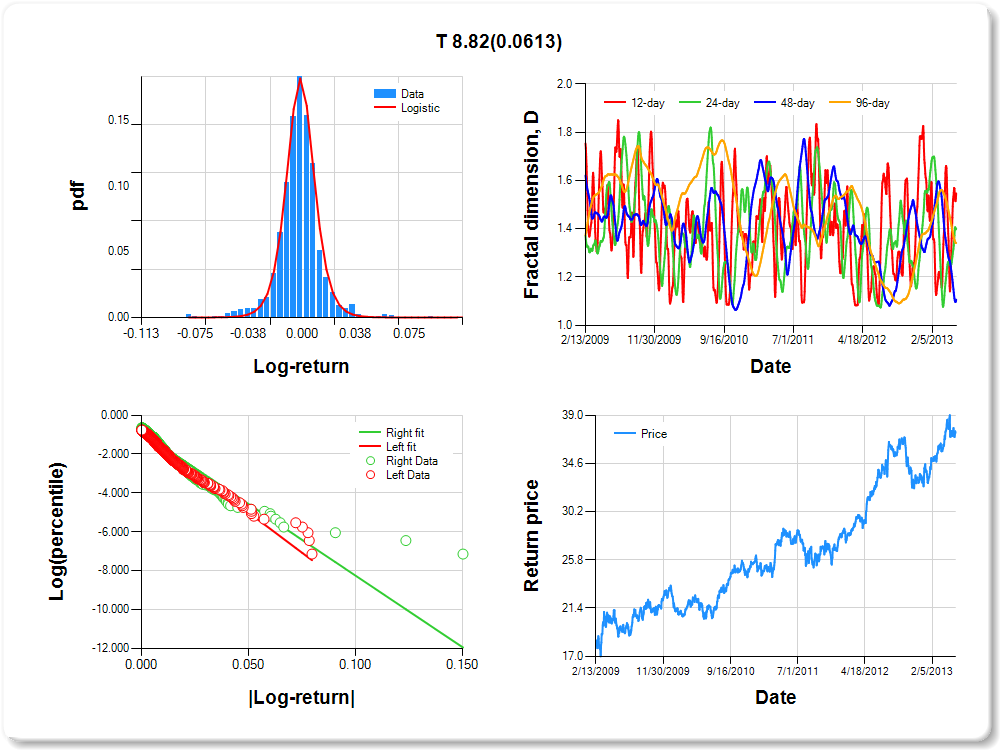
T
Percentile values of daily loss(gain) in per cent
| 0.5 | 1 | 5 | 10 | 25 | 50 | 75 | 90 | 95 | 99 | 99.5 |
| -0.06 |
-0.05 |
-0.02 |
-0.01 |
-0.01 |
0.00 |
0.01 |
0.02 |
0.04 |
0.06 |
-0.18 |
Daily log-return distribution fitting results
| Distribution | Location, a | Scale, b |
| Logistic |
-0.512 |
0.094 |
Linear regression results [Model: y=log(percentile of log-return), x=|log-return|]
| Variable | Coef(b) | s.e.(b) | t-value | P-value |
| Constant |
-0.876 |
0.056 |
-15.653 |
0.0000 |
|log-return| |
-82.350 |
3.526 |
-23.355 |
0.0000 |
I(right-tail) |
-0.001 |
0.076 |
-0.017 |
0.9863 |
|log-return|*I(right-tail) |
8.824 |
4.711 |
1.873 |
0.0613 |
Hurst exponent (of daily return price)
| 12-day | 24-day | 48-day | 96-day |
| 0.453 |
0.599 |
0.894 |
0.658 |
LRY
Percentile values of daily loss(gain) in per cent
| 0.5 | 1 | 5 | 10 | 25 | 50 | 75 | 90 | 95 | 99 | 99.5 |
| -0.13 |
-0.11 |
-0.05 |
-0.03 |
-0.01 |
0.00 |
0.01 |
0.05 |
0.11 |
0.13 |
0.83 |
Daily log-return distribution fitting results
| Distribution | Location, a | Scale, b |
| Laplace |
0.431 |
0.130 |
Linear regression results [Model: y=log(percentile of log-return), x=|log-return|]
| Variable | Coef(b) | s.e.(b) | t-value | P-value |
| Constant |
-1.061 |
0.053 |
-20.102 |
0.0000 |
|log-return| |
-33.549 |
1.483 |
-22.620 |
0.0000 |
I(right-tail) |
0.206 |
0.072 |
2.865 |
0.0042 |
|log-return|*I(right-tail) |
-5.347 |
2.151 |
-2.486 |
0.0131 |
Hurst exponent (of daily return price)
| 12-day | 24-day | 48-day | 96-day |
| 0.884 |
0.877 |
0.758 |
0.658 |

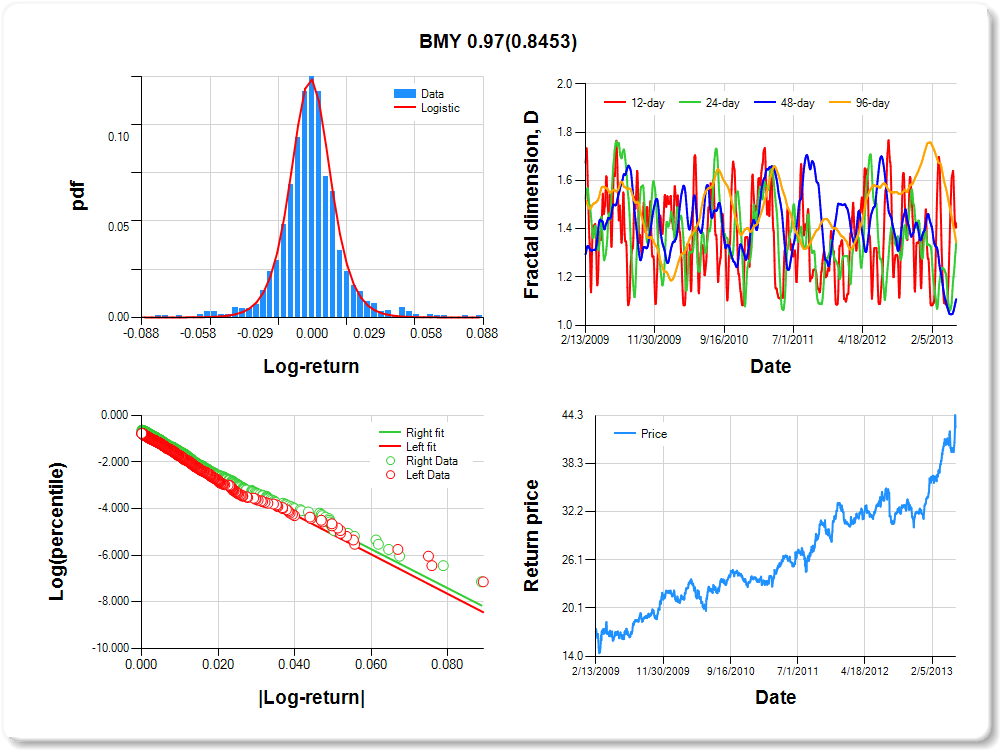
BMY
Percentile values of daily loss(gain) in per cent
| 0.5 | 1 | 5 | 10 | 25 | 50 | 75 | 90 | 95 | 99 | 99.5 |
| -0.05 |
-0.05 |
-0.02 |
-0.02 |
-0.01 |
0.00 |
0.01 |
0.03 |
0.05 |
0.06 |
0.05 |
Daily log-return distribution fitting results
| Distribution | Location, a | Scale, b |
| Logistic |
0.020 |
0.129 |
Linear regression results [Model: y=log(percentile of log-return), x=|log-return|]
| Variable | Coef(b) | s.e.(b) | t-value | P-value |
| Constant |
-0.861 |
0.057 |
-15.057 |
0.0000 |
|log-return| |
-84.732 |
3.649 |
-23.223 |
0.0000 |
I(right-tail) |
0.166 |
0.079 |
2.103 |
0.0356 |
|log-return|*I(right-tail) |
0.966 |
4.949 |
0.195 |
0.8453 |
Hurst exponent (of daily return price)
| 12-day | 24-day | 48-day | 96-day |
| 0.594 |
0.650 |
0.891 |
0.656 |
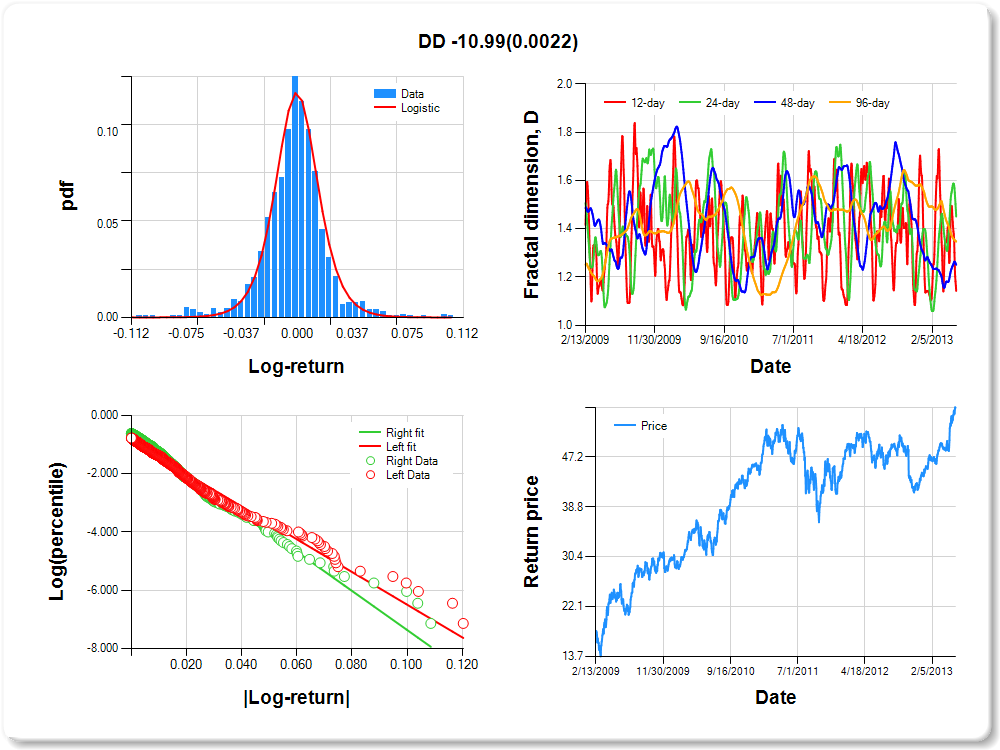
DD
Percentile values of daily loss(gain) in per cent
| 0.5 | 1 | 5 | 10 | 25 | 50 | 75 | 90 | 95 | 99 | 99.5 |
| -0.08 |
-0.07 |
-0.03 |
-0.02 |
-0.01 |
0.00 |
0.01 |
0.03 |
0.06 |
0.08 |
0.48 |
Daily log-return distribution fitting results
| Distribution | Location, a | Scale, b |
| Logistic |
0.117 |
0.141 |
Linear regression results [Model: y=log(percentile of log-return), x=|log-return|]
| Variable | Coef(b) | s.e.(b) | t-value | P-value |
| Constant |
-0.878 |
0.057 |
-15.433 |
0.0000 |
|log-return| |
-56.085 |
2.415 |
-23.225 |
0.0000 |
I(right-tail) |
0.233 |
0.079 |
2.953 |
0.0032 |
|log-return|*I(right-tail) |
-10.994 |
3.591 |
-3.062 |
0.0022 |
Hurst exponent (of daily return price)
| 12-day | 24-day | 48-day | 96-day |
| 0.857 |
0.549 |
0.749 |
0.653 |
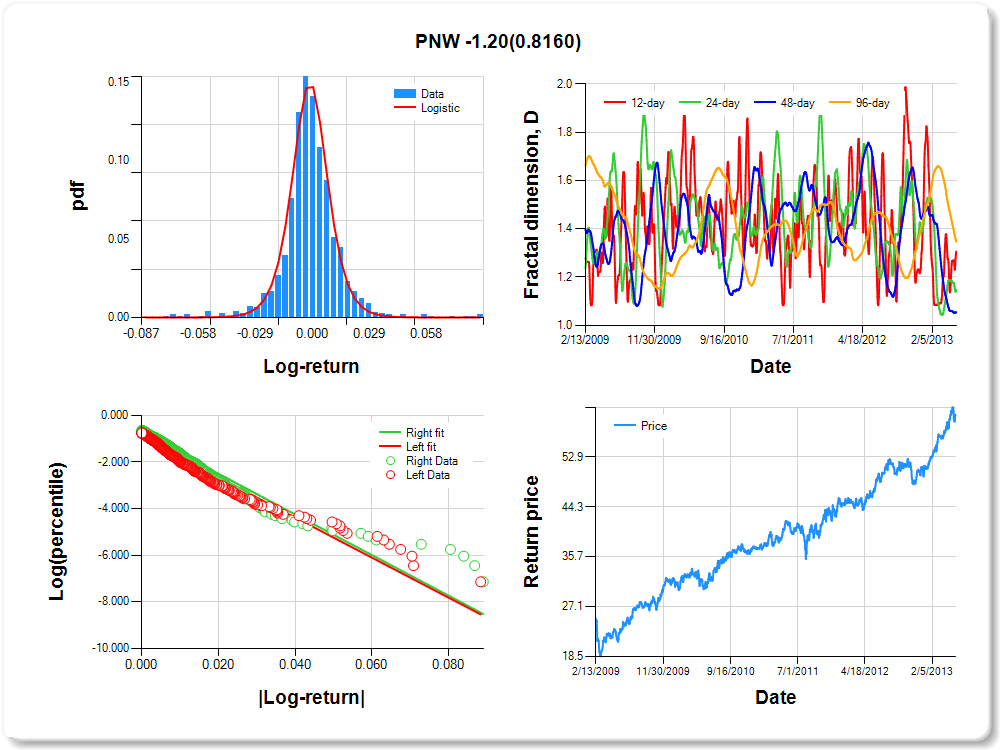
PNW
Percentile values of daily loss(gain) in per cent
| 0.5 | 1 | 5 | 10 | 25 | 50 | 75 | 90 | 95 | 99 | 99.5 |
| -0.06 |
-0.05 |
-0.02 |
-0.01 |
-0.01 |
0.00 |
0.01 |
0.02 |
0.04 |
0.06 |
1.55 |
Daily log-return distribution fitting results
| Distribution | Location, a | Scale, b |
| Logistic |
0.001 |
0.114 |
Linear regression results [Model: y=log(percentile of log-return), x=|log-return|]
| Variable | Coef(b) | s.e.(b) | t-value | P-value |
| Constant |
-0.943 |
0.054 |
-17.438 |
0.0000 |
|log-return| |
-85.826 |
3.704 |
-23.170 |
0.0000 |
I(right-tail) |
0.183 |
0.076 |
2.408 |
0.0162 |
|log-return|*I(right-tail) |
-1.198 |
5.148 |
-0.233 |
0.8160 |
Hurst exponent (of daily return price)
| 12-day | 24-day | 48-day | 96-day |
| 0.694 |
0.853 |
0.946 |
0.653 |
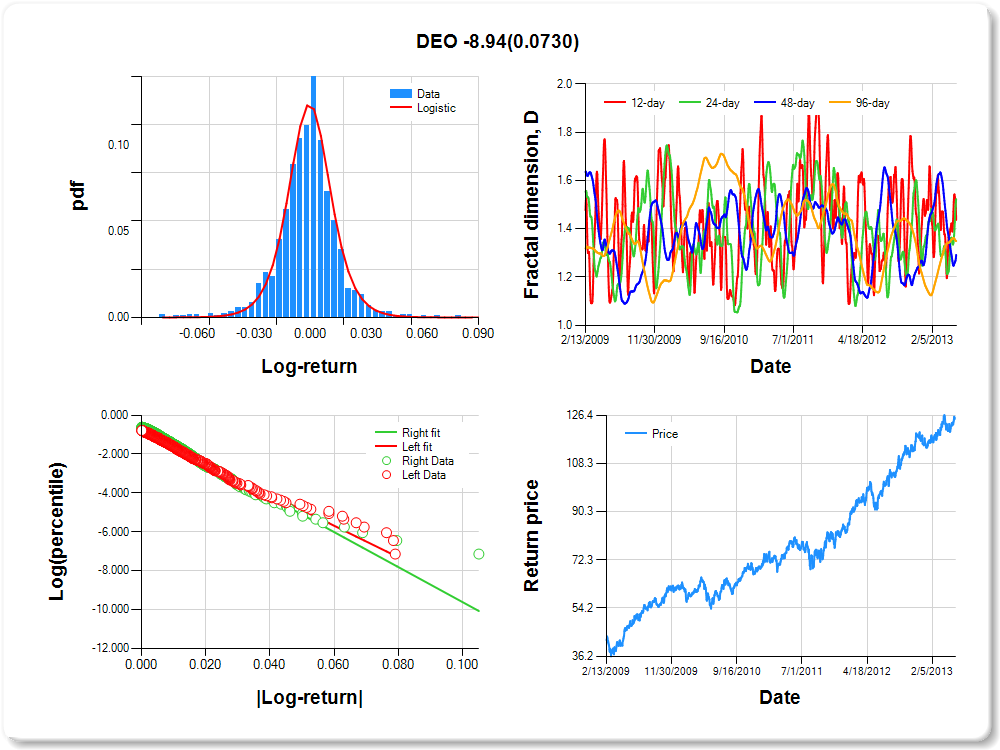
DEO
Percentile values of daily loss(gain) in per cent
| 0.5 | 1 | 5 | 10 | 25 | 50 | 75 | 90 | 95 | 99 | 99.5 |
| -0.06 |
-0.05 |
-0.02 |
-0.02 |
-0.01 |
0.00 |
0.01 |
0.02 |
0.04 |
0.05 |
1.36 |
Daily log-return distribution fitting results
| Distribution | Location, a | Scale, b |
| Logistic |
-0.216 |
0.138 |
Linear regression results [Model: y=log(percentile of log-return), x=|log-return|]
| Variable | Coef(b) | s.e.(b) | t-value | P-value |
| Constant |
-0.821 |
0.059 |
-13.994 |
0.0000 |
|log-return| |
-80.980 |
3.483 |
-23.250 |
0.0000 |
I(right-tail) |
0.210 |
0.080 |
2.603 |
0.0094 |
|log-return|*I(right-tail) |
-8.940 |
4.982 |
-1.795 |
0.0730 |
Hurst exponent (of daily return price)
| 12-day | 24-day | 48-day | 96-day |
| 0.563 |
0.477 |
0.708 |
0.651 |
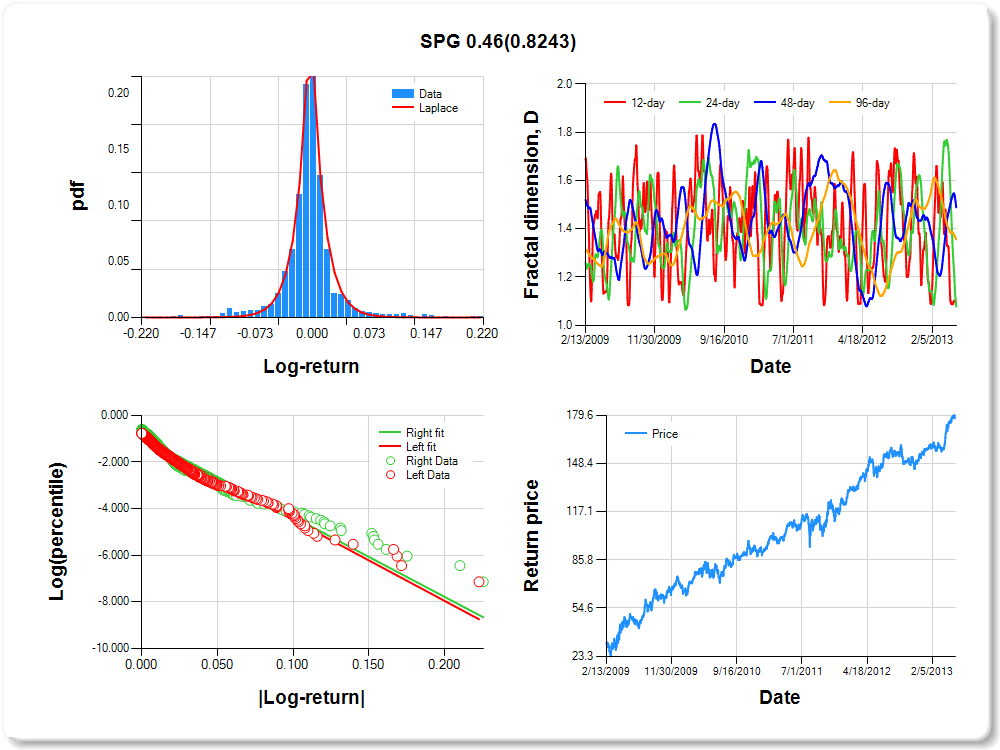
SPG
Percentile values of daily loss(gain) in per cent
| 0.5 | 1 | 5 | 10 | 25 | 50 | 75 | 90 | 95 | 99 | 99.5 |
| -0.12 |
-0.10 |
-0.05 |
-0.03 |
-0.01 |
0.00 |
0.01 |
0.05 |
0.13 |
0.17 |
0.04 |
Daily log-return distribution fitting results
| Distribution | Location, a | Scale, b |
| Laplace |
0.002 |
0.122 |
Linear regression results [Model: y=log(percentile of log-return), x=|log-return|]
| Variable | Coef(b) | s.e.(b) | t-value | P-value |
| Constant |
-1.017 |
0.053 |
-19.242 |
0.0000 |
|log-return| |
-34.669 |
1.502 |
-23.087 |
0.0000 |
I(right-tail) |
0.081 |
0.071 |
1.139 |
0.2550 |
|log-return|*I(right-tail) |
0.455 |
2.051 |
0.222 |
0.8243 |
Hurst exponent (of daily return price)
| 12-day | 24-day | 48-day | 96-day |
| 0.903 |
0.922 |
0.511 |
0.644 |
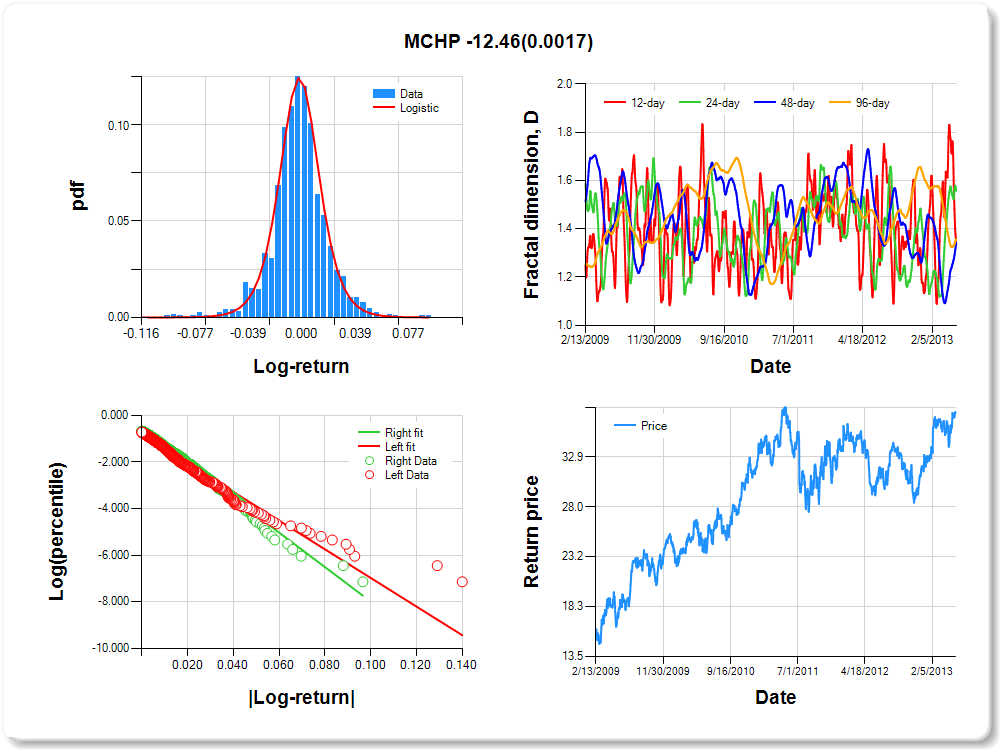
MCHP
Percentile values of daily loss(gain) in per cent
| 0.5 | 1 | 5 | 10 | 25 | 50 | 75 | 90 | 95 | 99 | 99.5 |
| -0.08 |
-0.06 |
-0.03 |
-0.02 |
-0.01 |
0.00 |
0.01 |
0.03 |
0.05 |
0.06 |
1.27 |
Daily log-return distribution fitting results
| Distribution | Location, a | Scale, b |
| Logistic |
0.321 |
0.137 |
Linear regression results [Model: y=log(percentile of log-return), x=|log-return|]
| Variable | Coef(b) | s.e.(b) | t-value | P-value |
| Constant |
-0.820 |
0.055 |
-14.797 |
0.0000 |
|log-return| |
-61.375 |
2.589 |
-23.703 |
0.0000 |
I(right-tail) |
0.237 |
0.081 |
2.910 |
0.0037 |
|log-return|*I(right-tail) |
-12.455 |
3.959 |
-3.146 |
0.0017 |
Hurst exponent (of daily return price)
| 12-day | 24-day | 48-day | 96-day |
| 0.666 |
0.443 |
0.658 |
0.642 |
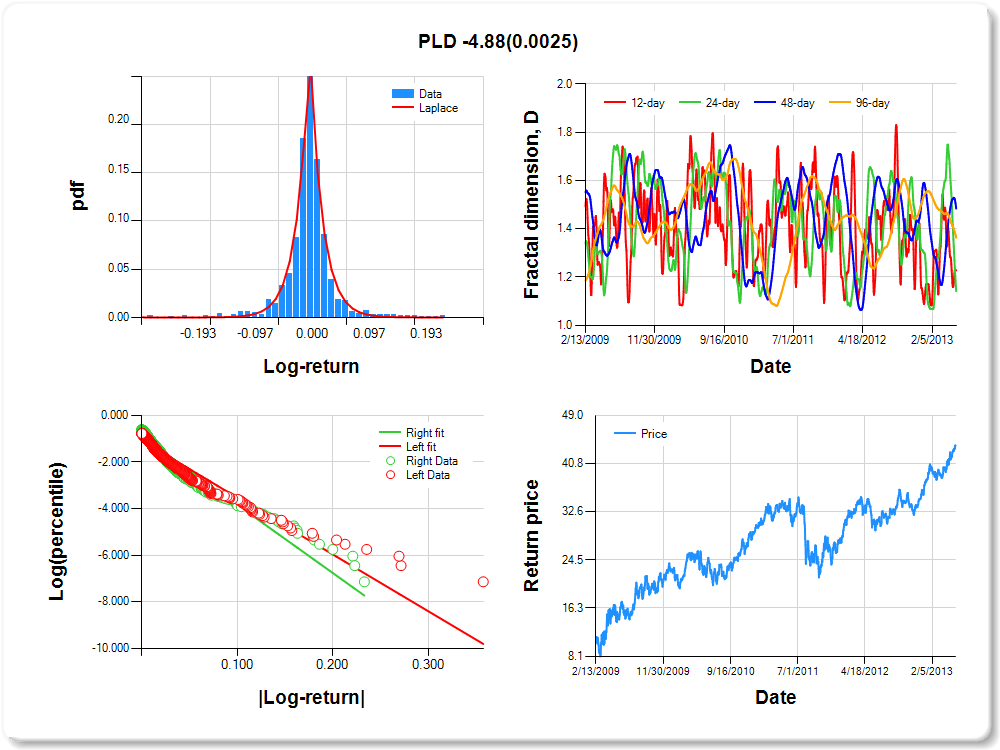
PLD
Percentile values of daily loss(gain) in per cent
| 0.5 | 1 | 5 | 10 | 25 | 50 | 75 | 90 | 95 | 99 | 99.5 |
| -0.18 |
-0.14 |
-0.06 |
-0.04 |
-0.01 |
0.00 |
0.02 |
0.06 |
0.15 |
0.20 |
0.80 |
Daily log-return distribution fitting results
| Distribution | Location, a | Scale, b |
| Laplace |
0.367 |
0.124 |
Linear regression results [Model: y=log(percentile of log-return), x=|log-return|]
| Variable | Coef(b) | s.e.(b) | t-value | P-value |
| Constant |
-1.091 |
0.052 |
-21.141 |
0.0000 |
|log-return| |
-24.351 |
1.079 |
-22.570 |
0.0000 |
I(right-tail) |
0.180 |
0.071 |
2.559 |
0.0106 |
|log-return|*I(right-tail) |
-4.876 |
1.607 |
-3.034 |
0.0025 |
Hurst exponent (of daily return price)
| 12-day | 24-day | 48-day | 96-day |
| 0.772 |
0.858 |
0.516 |
0.637 |
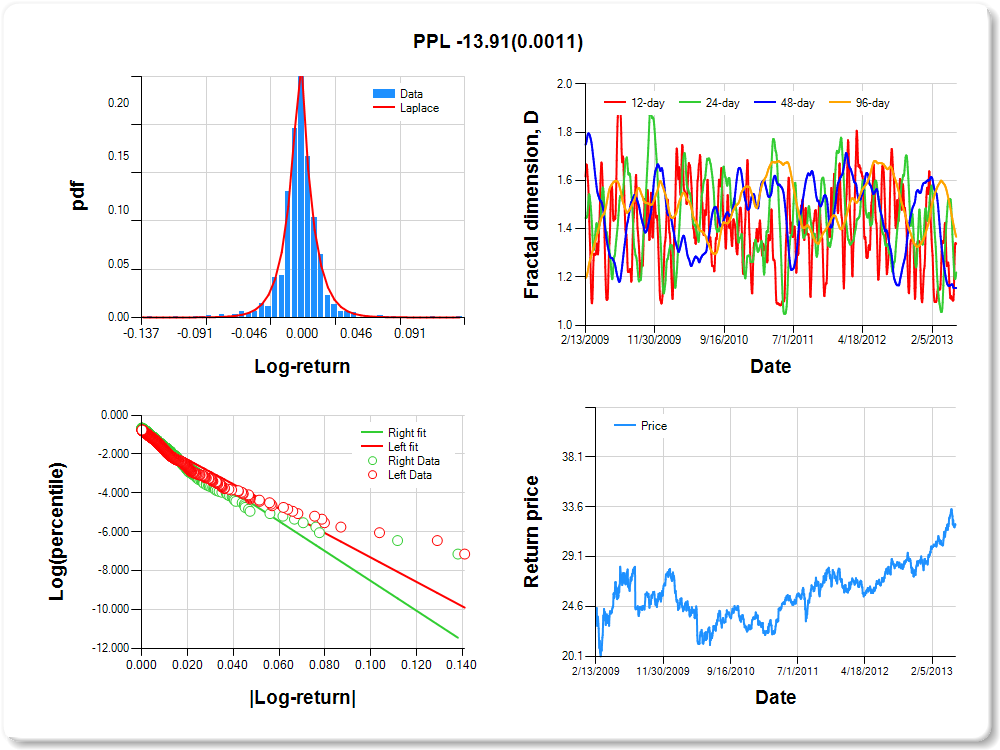
PPL
Percentile values of daily loss(gain) in per cent
| 0.5 | 1 | 5 | 10 | 25 | 50 | 75 | 90 | 95 | 99 | 99.5 |
| -0.08 |
-0.06 |
-0.02 |
-0.02 |
-0.01 |
0.00 |
0.01 |
0.02 |
0.05 |
0.06 |
0.82 |
Daily log-return distribution fitting results
| Distribution | Location, a | Scale, b |
| Laplace |
0.019 |
0.129 |
Linear regression results [Model: y=log(percentile of log-return), x=|log-return|]
| Variable | Coef(b) | s.e.(b) | t-value | P-value |
| Constant |
-1.023 |
0.052 |
-19.530 |
0.0000 |
|log-return| |
-62.807 |
2.773 |
-22.651 |
0.0000 |
I(right-tail) |
0.188 |
0.074 |
2.537 |
0.0113 |
|log-return|*I(right-tail) |
-13.905 |
4.251 |
-3.271 |
0.0011 |
Hurst exponent (of daily return price)
| 12-day | 24-day | 48-day | 96-day |
| 0.662 |
0.781 |
0.845 |
0.633 |
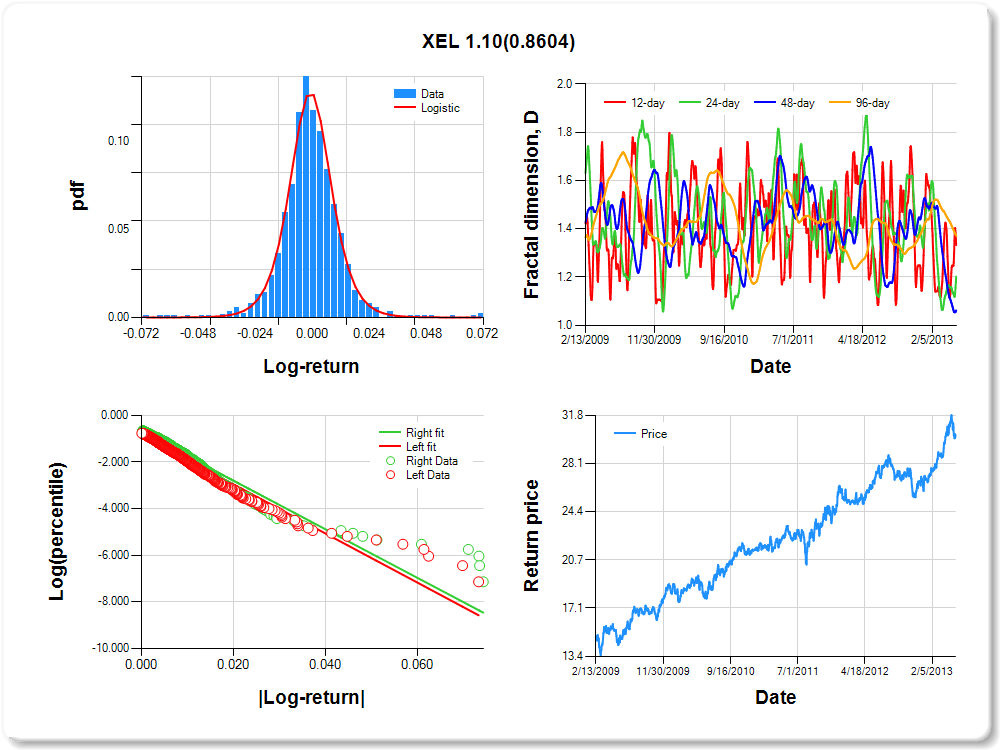
XEL
Percentile values of daily loss(gain) in per cent
| 0.5 | 1 | 5 | 10 | 25 | 50 | 75 | 90 | 95 | 99 | 99.5 |
| -0.05 |
-0.03 |
-0.02 |
-0.01 |
-0.01 |
0.00 |
0.01 |
0.02 |
0.03 |
0.05 |
1.22 |
Daily log-return distribution fitting results
| Distribution | Location, a | Scale, b |
| Logistic |
0.003 |
0.134 |
Linear regression results [Model: y=log(percentile of log-return), x=|log-return|]
| Variable | Coef(b) | s.e.(b) | t-value | P-value |
| Constant |
-0.856 |
0.057 |
-14.954 |
0.0000 |
|log-return| |
-105.226 |
4.554 |
-23.104 |
0.0000 |
I(right-tail) |
0.137 |
0.080 |
1.717 |
0.0863 |
|log-return|*I(right-tail) |
1.105 |
6.282 |
0.176 |
0.8604 |
Hurst exponent (of daily return price)
| 12-day | 24-day | 48-day | 96-day |
| 0.668 |
0.798 |
0.938 |
0.629 |
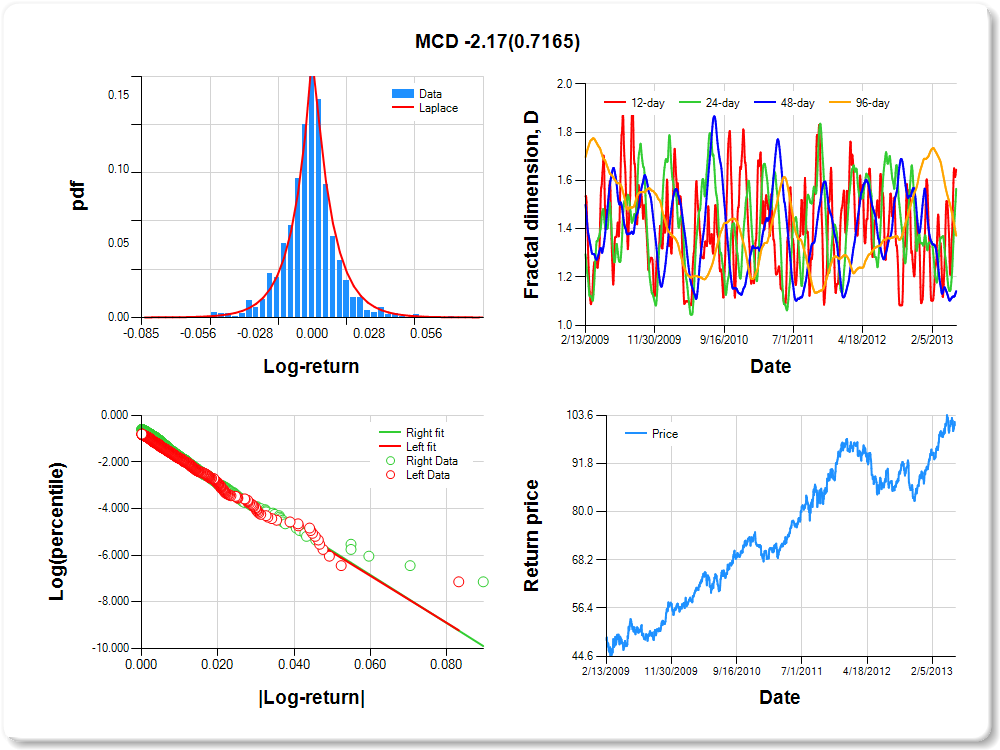
MCD
Percentile values of daily loss(gain) in per cent
| 0.5 | 1 | 5 | 10 | 25 | 50 | 75 | 90 | 95 | 99 | 99.5 |
| -0.05 |
-0.04 |
-0.02 |
-0.01 |
-0.01 |
0.00 |
0.01 |
0.02 |
0.04 |
0.04 |
1.78 |
Daily log-return distribution fitting results
| Distribution | Location, a | Scale, b |
| Laplace |
-0.026 |
0.186 |
Linear regression results [Model: y=log(percentile of log-return), x=|log-return|]
| Variable | Coef(b) | s.e.(b) | t-value | P-value |
| Constant |
-0.836 |
0.060 |
-14.037 |
0.0000 |
|log-return| |
-100.718 |
4.378 |
-23.005 |
0.0000 |
I(right-tail) |
0.167 |
0.080 |
2.102 |
0.0358 |
|log-return|*I(right-tail) |
-2.168 |
5.967 |
-0.363 |
0.7165 |
Hurst exponent (of daily return price)
| 12-day | 24-day | 48-day | 96-day |
| 0.355 |
0.434 |
0.858 |
0.629 |
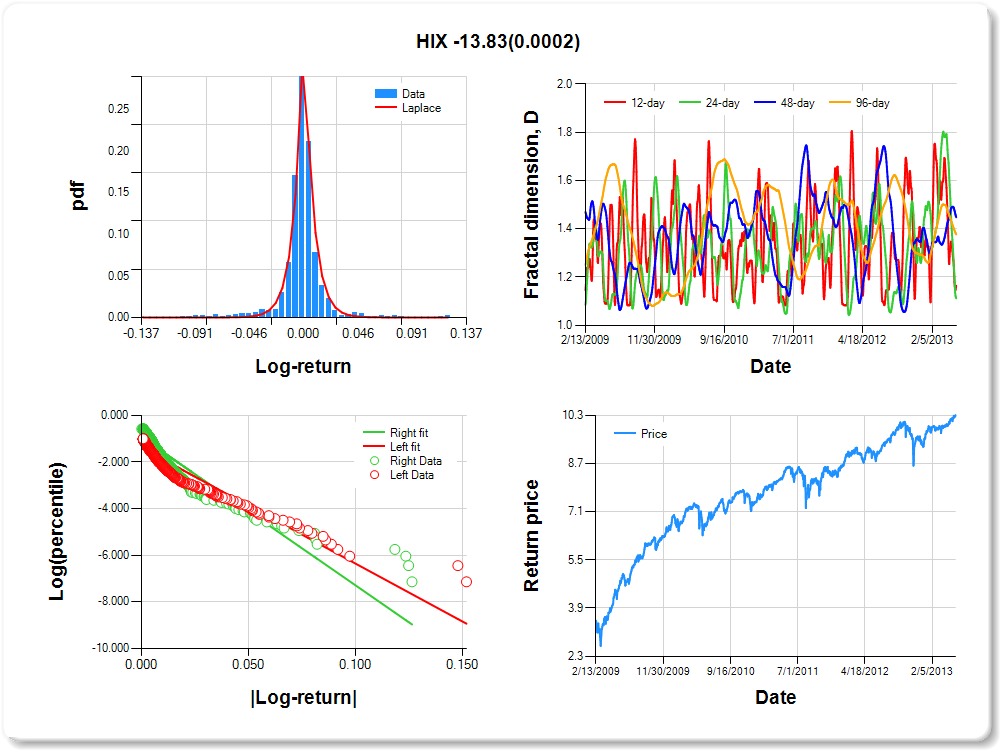
HIX
Percentile values of daily loss(gain) in per cent
| 0.5 | 1 | 5 | 10 | 25 | 50 | 75 | 90 | 95 | 99 | 99.5 |
| -0.08 |
-0.07 |
-0.02 |
-0.01 |
0.00 |
0.00 |
0.01 |
0.02 |
0.06 |
0.08 |
0.88 |
Daily log-return distribution fitting results
| Distribution | Location, a | Scale, b |
| Laplace |
0.188 |
0.096 |
Linear regression results [Model: y=log(percentile of log-return), x=|log-return|]
| Variable | Coef(b) | s.e.(b) | t-value | P-value |
| Constant |
-1.386 |
0.056 |
-24.678 |
0.0000 |
|log-return| |
-49.598 |
2.508 |
-19.772 |
0.0000 |
I(right-tail) |
0.456 |
0.073 |
6.255 |
0.0000 |
|log-return|*I(right-tail) |
-13.829 |
3.649 |
-3.790 |
0.0002 |
Hurst exponent (of daily return price)
| 12-day | 24-day | 48-day | 96-day |
| 0.836 |
0.888 |
0.552 |
0.623 |
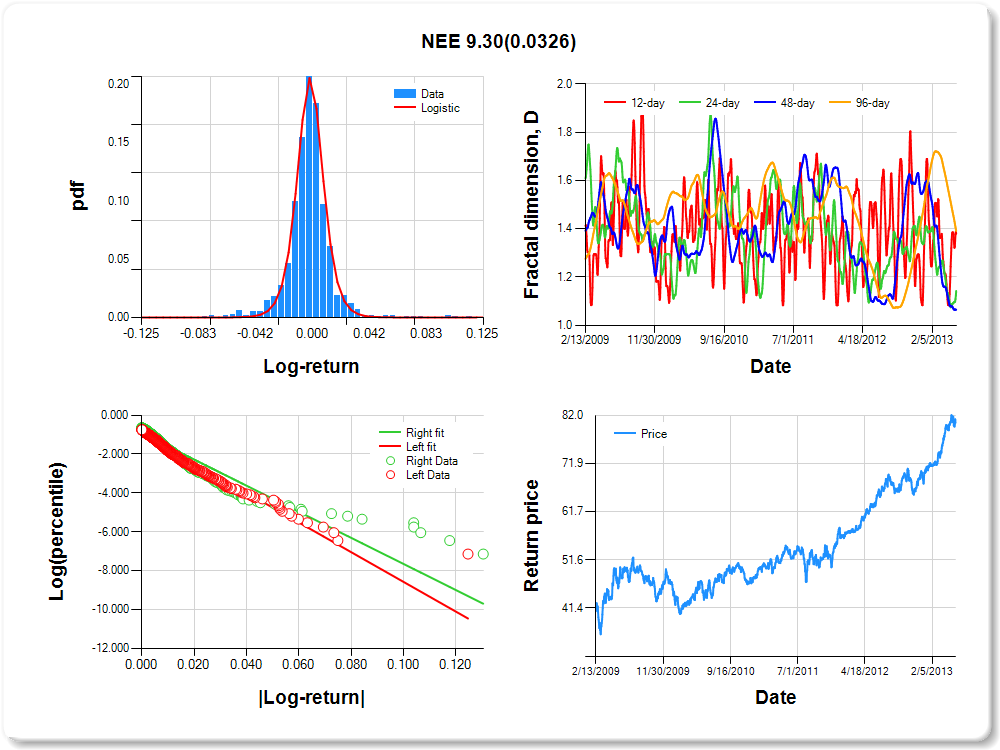
NEE
Percentile values of daily loss(gain) in per cent
| 0.5 | 1 | 5 | 10 | 25 | 50 | 75 | 90 | 95 | 99 | 99.5 |
| -0.06 |
-0.05 |
-0.02 |
-0.02 |
-0.01 |
0.00 |
0.01 |
0.02 |
0.05 |
0.08 |
0.94 |
Daily log-return distribution fitting results
| Distribution | Location, a | Scale, b |
| Logistic |
-0.028 |
0.083 |
Linear regression results [Model: y=log(percentile of log-return), x=|log-return|]
| Variable | Coef(b) | s.e.(b) | t-value | P-value |
| Constant |
-0.924 |
0.054 |
-17.159 |
0.0000 |
|log-return| |
-76.432 |
3.271 |
-23.369 |
0.0000 |
I(right-tail) |
-0.008 |
0.073 |
-0.109 |
0.9135 |
|log-return|*I(right-tail) |
9.297 |
4.345 |
2.140 |
0.0326 |
Hurst exponent (of daily return price)
| 12-day | 24-day | 48-day | 96-day |
| 0.620 |
0.857 |
0.935 |
0.609 |
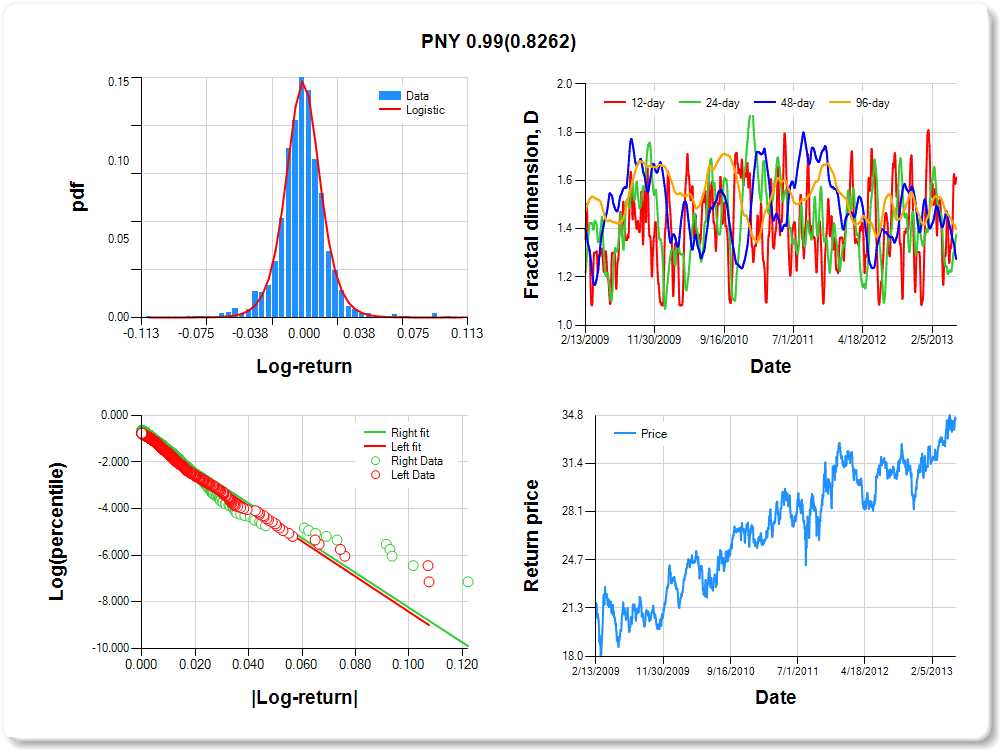
PNY
Percentile values of daily loss(gain) in per cent
| 0.5 | 1 | 5 | 10 | 25 | 50 | 75 | 90 | 95 | 99 | 99.5 |
| -0.06 |
-0.05 |
-0.03 |
-0.02 |
-0.01 |
0.00 |
0.01 |
0.02 |
0.04 |
0.07 |
0.82 |
Daily log-return distribution fitting results
| Distribution | Location, a | Scale, b |
| Logistic |
-0.094 |
0.114 |
Linear regression results [Model: y=log(percentile of log-return), x=|log-return|]
| Variable | Coef(b) | s.e.(b) | t-value | P-value |
| Constant |
-0.853 |
0.057 |
-14.922 |
0.0000 |
|log-return| |
-75.579 |
3.260 |
-23.182 |
0.0000 |
I(right-tail) |
0.081 |
0.078 |
1.044 |
0.2966 |
|log-return|*I(right-tail) |
0.987 |
4.494 |
0.220 |
0.8262 |
Hurst exponent (of daily return price)
| 12-day | 24-day | 48-day | 96-day |
| 0.388 |
0.623 |
0.725 |
0.601 |
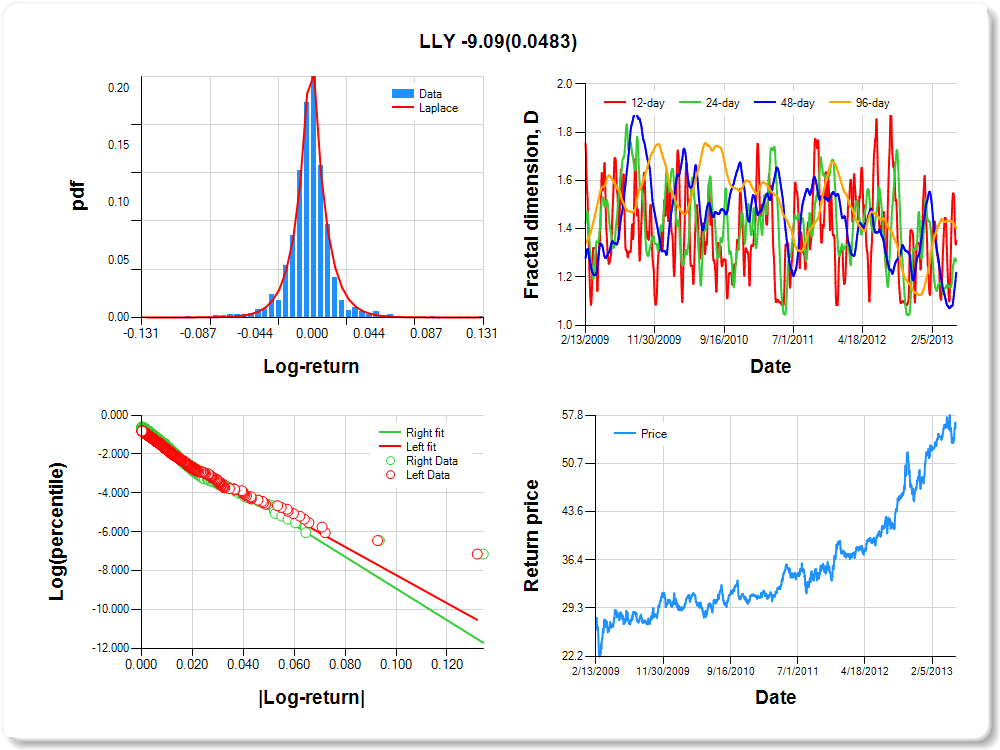
LLY
Percentile values of daily loss(gain) in per cent
| 0.5 | 1 | 5 | 10 | 25 | 50 | 75 | 90 | 95 | 99 | 99.5 |
| -0.06 |
-0.05 |
-0.02 |
-0.02 |
-0.01 |
0.00 |
0.01 |
0.02 |
0.05 |
0.06 |
0.38 |
Daily log-return distribution fitting results
| Distribution | Location, a | Scale, b |
| Laplace |
0.005 |
0.131 |
Linear regression results [Model: y=log(percentile of log-return), x=|log-return|]
| Variable | Coef(b) | s.e.(b) | t-value | P-value |
| Constant |
-0.978 |
0.056 |
-17.501 |
0.0000 |
|log-return| |
-72.339 |
3.206 |
-22.565 |
0.0000 |
I(right-tail) |
0.219 |
0.076 |
2.885 |
0.0040 |
|log-return|*I(right-tail) |
-9.089 |
4.598 |
-1.977 |
0.0483 |
Hurst exponent (of daily return price)
| 12-day | 24-day | 48-day | 96-day |
| 0.649 |
0.730 |
0.782 |
0.597 |
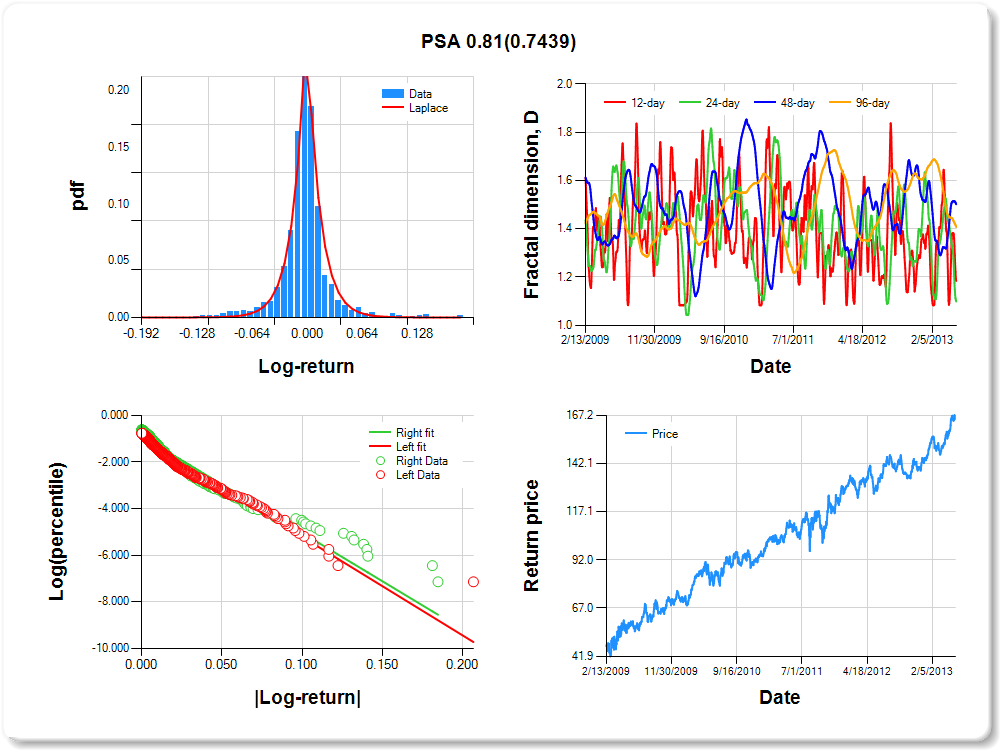
PSA
Percentile values of daily loss(gain) in per cent
| 0.5 | 1 | 5 | 10 | 25 | 50 | 75 | 90 | 95 | 99 | 99.5 |
| -0.10 |
-0.09 |
-0.04 |
-0.02 |
-0.01 |
0.00 |
0.01 |
0.04 |
0.10 |
0.14 |
0.85 |
Daily log-return distribution fitting results
| Distribution | Location, a | Scale, b |
| Laplace |
0.120 |
0.130 |
Linear regression results [Model: y=log(percentile of log-return), x=|log-return|]
| Variable | Coef(b) | s.e.(b) | t-value | P-value |
| Constant |
-0.996 |
0.053 |
-18.726 |
0.0000 |
|log-return| |
-42.191 |
1.823 |
-23.150 |
0.0000 |
I(right-tail) |
0.089 |
0.072 |
1.240 |
0.2153 |
|log-return|*I(right-tail) |
0.812 |
2.484 |
0.327 |
0.7439 |
Hurst exponent (of daily return price)
| 12-day | 24-day | 48-day | 96-day |
| 0.816 |
0.901 |
0.498 |
0.592 |
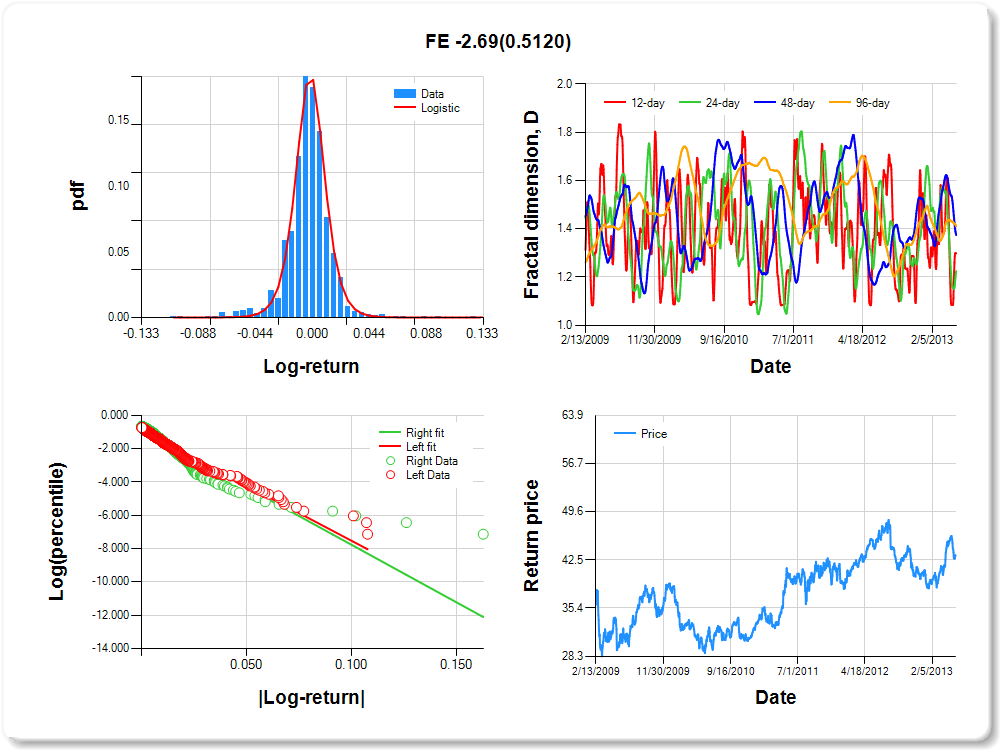
FE
Percentile values of daily loss(gain) in per cent
| 0.5 | 1 | 5 | 10 | 25 | 50 | 75 | 90 | 95 | 99 | 99.5 |
| -0.07 |
-0.06 |
-0.03 |
-0.02 |
-0.01 |
0.00 |
0.01 |
0.02 |
0.04 |
0.06 |
0.16 |
Daily log-return distribution fitting results
| Distribution | Location, a | Scale, b |
| Logistic |
-0.338 |
0.092 |
Linear regression results [Model: y=log(percentile of log-return), x=|log-return|]
| Variable | Coef(b) | s.e.(b) | t-value | P-value |
| Constant |
-0.897 |
0.054 |
-16.516 |
0.0000 |
|log-return| |
-66.309 |
2.815 |
-23.554 |
0.0000 |
I(right-tail) |
0.027 |
0.075 |
0.358 |
0.7203 |
|log-return|*I(right-tail) |
-2.691 |
4.104 |
-0.656 |
0.5120 |
Hurst exponent (of daily return price)
| 12-day | 24-day | 48-day | 96-day |
| 0.702 |
0.775 |
0.626 |
0.590 |
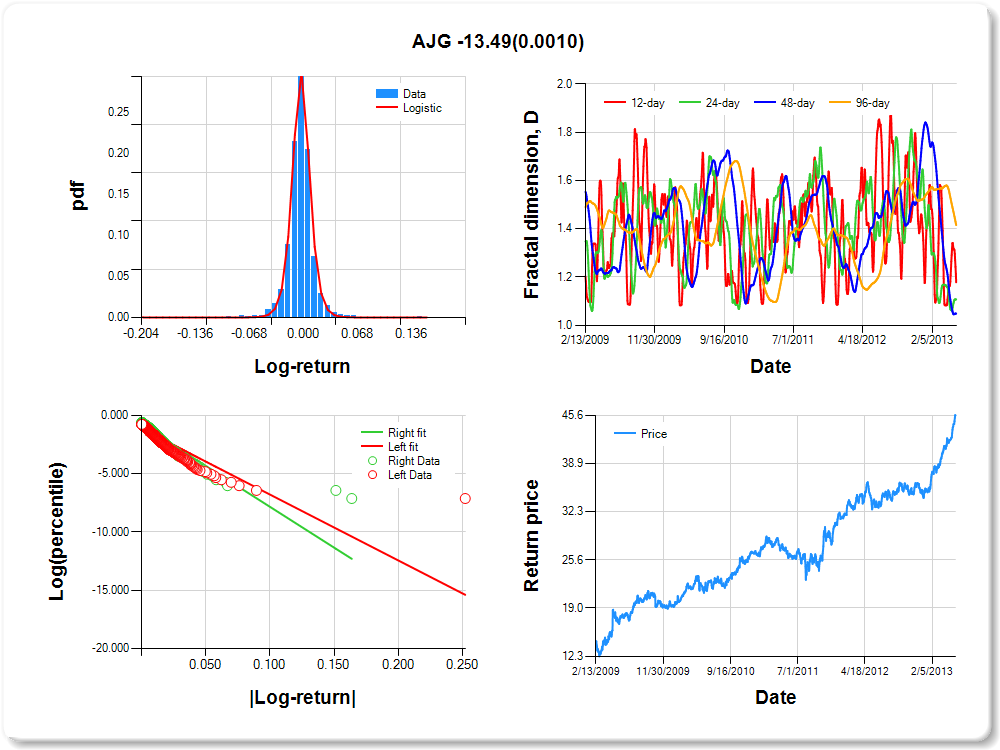
AJG
Percentile values of daily loss(gain) in per cent
| 0.5 | 1 | 5 | 10 | 25 | 50 | 75 | 90 | 95 | 99 | 99.5 |
| -0.06 |
-0.04 |
-0.02 |
-0.02 |
-0.01 |
0.00 |
0.01 |
0.02 |
0.05 |
0.06 |
0.28 |
Daily log-return distribution fitting results
| Distribution | Location, a | Scale, b |
| Logistic |
0.373 |
0.057 |
Linear regression results [Model: y=log(percentile of log-return), x=|log-return|]
| Variable | Coef(b) | s.e.(b) | t-value | P-value |
| Constant |
-1.147 |
0.052 |
-22.087 |
0.0000 |
|log-return| |
-56.443 |
2.780 |
-20.305 |
0.0000 |
I(right-tail) |
0.301 |
0.073 |
4.122 |
0.0000 |
|log-return|*I(right-tail) |
-13.486 |
4.078 |
-3.307 |
0.0010 |
Hurst exponent (of daily return price)
| 12-day | 24-day | 48-day | 96-day |
| 0.822 |
0.893 |
0.951 |
0.585 |
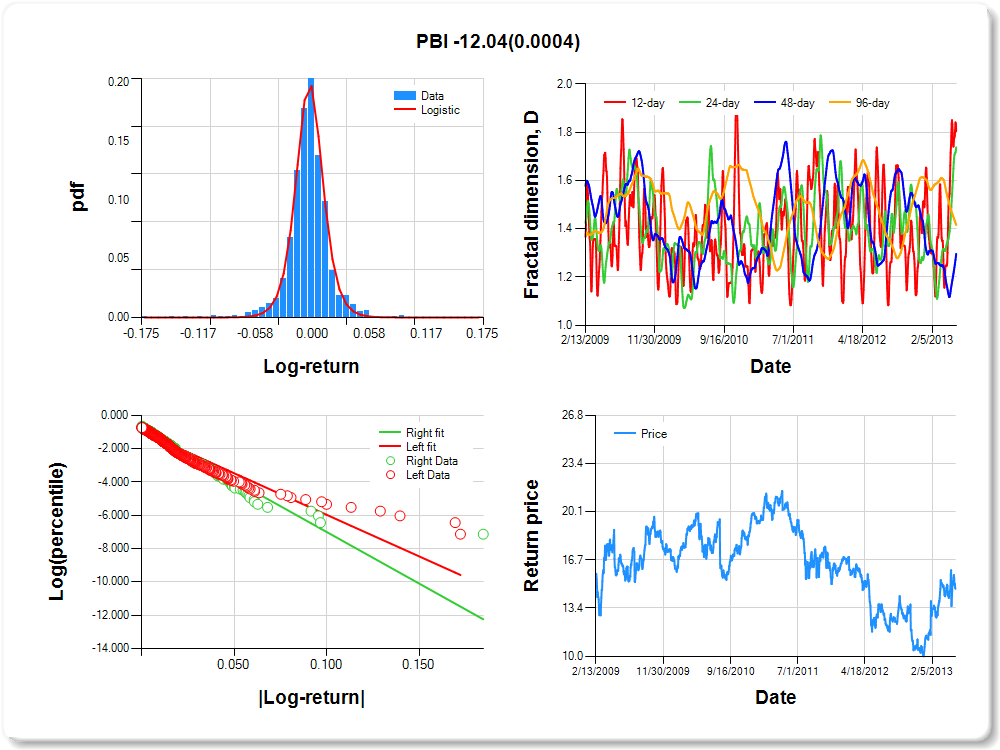
PBI
Percentile values of daily loss(gain) in per cent
| 0.5 | 1 | 5 | 10 | 25 | 50 | 75 | 90 | 95 | 99 | 99.5 |
| -0.10 |
-0.06 |
-0.03 |
-0.02 |
-0.01 |
0.00 |
0.01 |
0.03 |
0.06 |
0.06 |
0.11 |
Daily log-return distribution fitting results
| Distribution | Location, a | Scale, b |
| Logistic |
-0.055 |
0.086 |
Linear regression results [Model: y=log(percentile of log-return), x=|log-return|]
| Variable | Coef(b) | s.e.(b) | t-value | P-value |
| Constant |
-0.974 |
0.053 |
-18.387 |
0.0000 |
|log-return| |
-49.854 |
2.195 |
-22.713 |
0.0000 |
I(right-tail) |
0.179 |
0.076 |
2.360 |
0.0184 |
|log-return|*I(right-tail) |
-12.037 |
3.402 |
-3.538 |
0.0004 |
Hurst exponent (of daily return price)
| 12-day | 24-day | 48-day | 96-day |
| 0.195 |
0.262 |
0.704 |
0.584 |
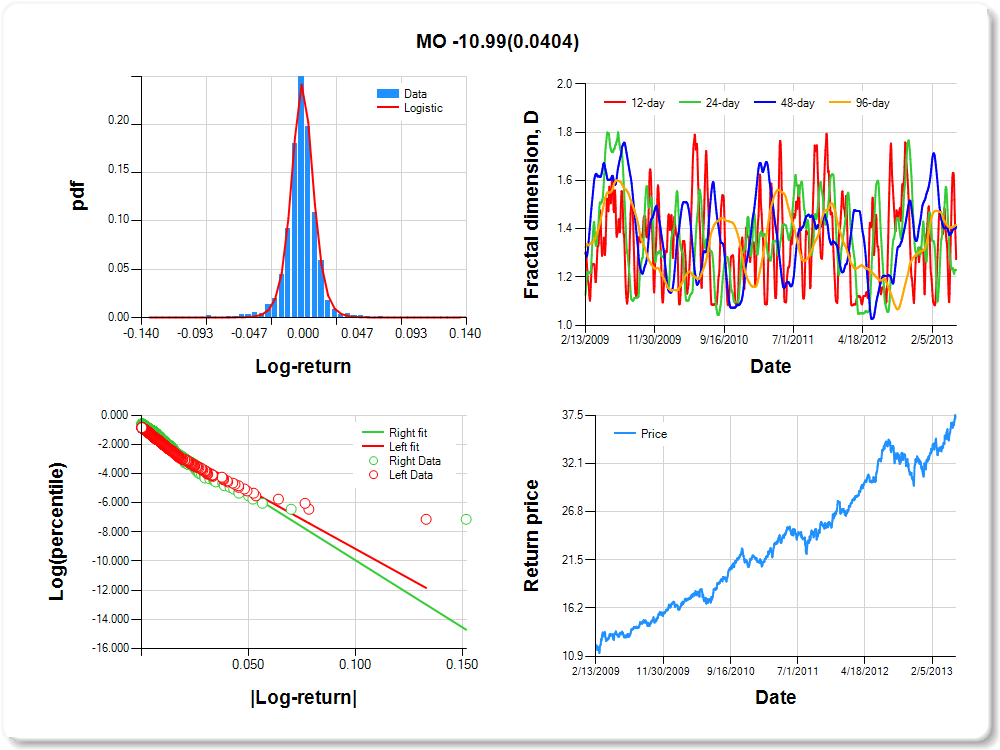
MO
Percentile values of daily loss(gain) in per cent
| 0.5 | 1 | 5 | 10 | 25 | 50 | 75 | 90 | 95 | 99 | 99.5 |
| -0.05 |
-0.04 |
-0.02 |
-0.01 |
-0.01 |
0.00 |
0.01 |
0.02 |
0.03 |
0.05 |
0.00 |
Daily log-return distribution fitting results
| Distribution | Location, a | Scale, b |
| Logistic |
-0.096 |
0.072 |
Linear regression results [Model: y=log(percentile of log-return), x=|log-return|]
| Variable | Coef(b) | s.e.(b) | t-value | P-value |
| Constant |
-1.056 |
0.056 |
-18.705 |
0.0000 |
|log-return| |
-80.933 |
3.744 |
-21.617 |
0.0000 |
I(right-tail) |
0.323 |
0.077 |
4.210 |
0.0000 |
|log-return|*I(right-tail) |
-10.993 |
5.357 |
-2.052 |
0.0404 |
Hurst exponent (of daily return price)
| 12-day | 24-day | 48-day | 96-day |
| 0.726 |
0.770 |
0.589 |
0.584 |
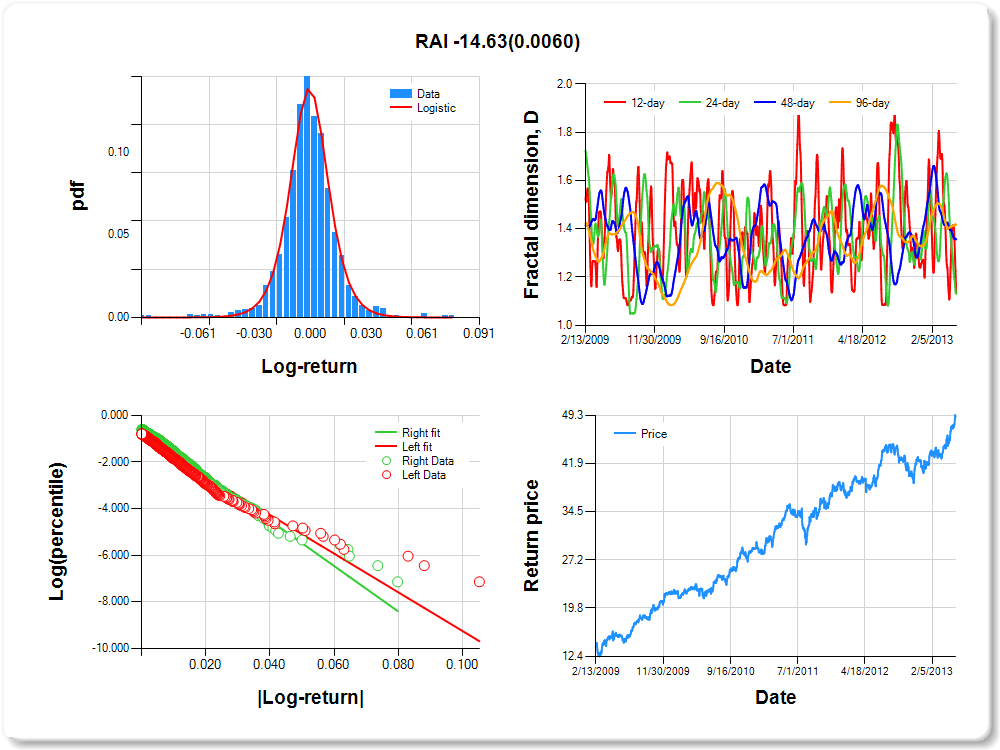
RAI
Percentile values of daily loss(gain) in per cent
| 0.5 | 1 | 5 | 10 | 25 | 50 | 75 | 90 | 95 | 99 | 99.5 |
| -0.06 |
-0.04 |
-0.02 |
-0.01 |
-0.01 |
0.00 |
0.01 |
0.02 |
0.04 |
0.05 |
1.05 |
Daily log-return distribution fitting results
| Distribution | Location, a | Scale, b |
| Logistic |
0.258 |
0.124 |
Linear regression results [Model: y=log(percentile of log-return), x=|log-return|]
| Variable | Coef(b) | s.e.(b) | t-value | P-value |
| Constant |
-0.946 |
0.056 |
-16.794 |
0.0000 |
|log-return| |
-82.851 |
3.666 |
-22.600 |
0.0000 |
I(right-tail) |
0.351 |
0.079 |
4.437 |
0.0000 |
|log-return|*I(right-tail) |
-14.634 |
5.314 |
-2.754 |
0.0060 |
Hurst exponent (of daily return price)
| 12-day | 24-day | 48-day | 96-day |
| 0.865 |
0.870 |
0.644 |
0.583 |
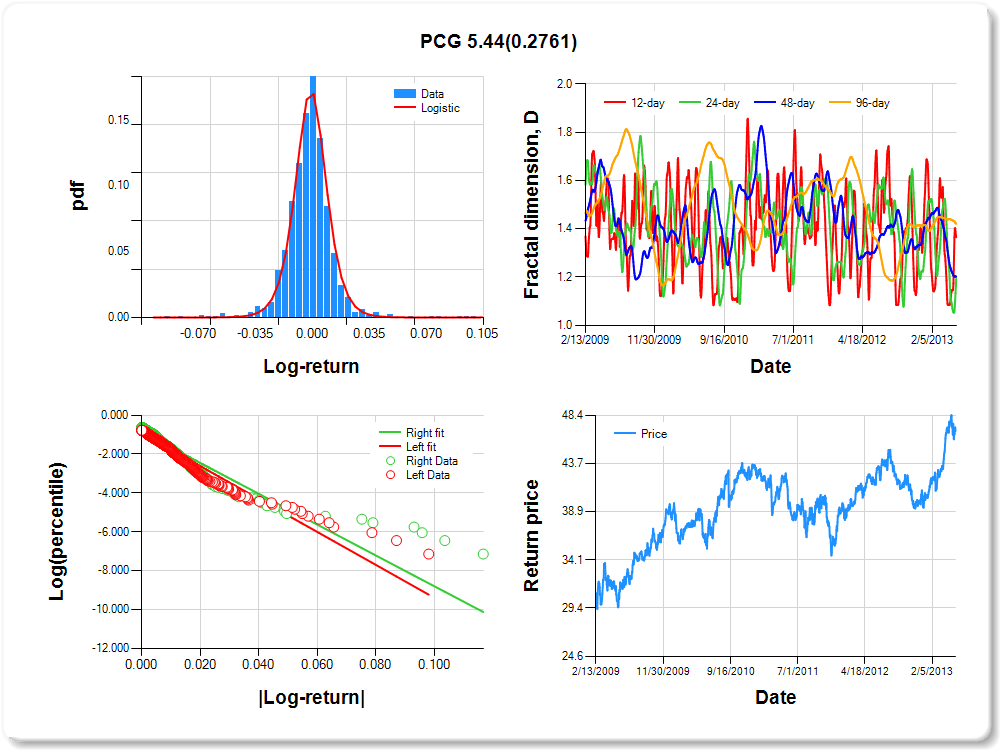
PCG
Percentile values of daily loss(gain) in per cent
| 0.5 | 1 | 5 | 10 | 25 | 50 | 75 | 90 | 95 | 99 | 99.5 |
| -0.06 |
-0.04 |
-0.02 |
-0.01 |
-0.01 |
0.00 |
0.01 |
0.02 |
0.04 |
0.06 |
0.49 |
Daily log-return distribution fitting results
| Distribution | Location, a | Scale, b |
| Logistic |
-0.130 |
0.099 |
Linear regression results [Model: y=log(percentile of log-return), x=|log-return|]
| Variable | Coef(b) | s.e.(b) | t-value | P-value |
| Constant |
-0.908 |
0.056 |
-16.198 |
0.0000 |
|log-return| |
-84.701 |
3.708 |
-22.844 |
0.0000 |
I(right-tail) |
0.049 |
0.075 |
0.655 |
0.5127 |
|log-return|*I(right-tail) |
5.438 |
4.991 |
1.090 |
0.2761 |
Hurst exponent (of daily return price)
| 12-day | 24-day | 48-day | 96-day |
| 0.635 |
0.807 |
0.799 |
0.580 |
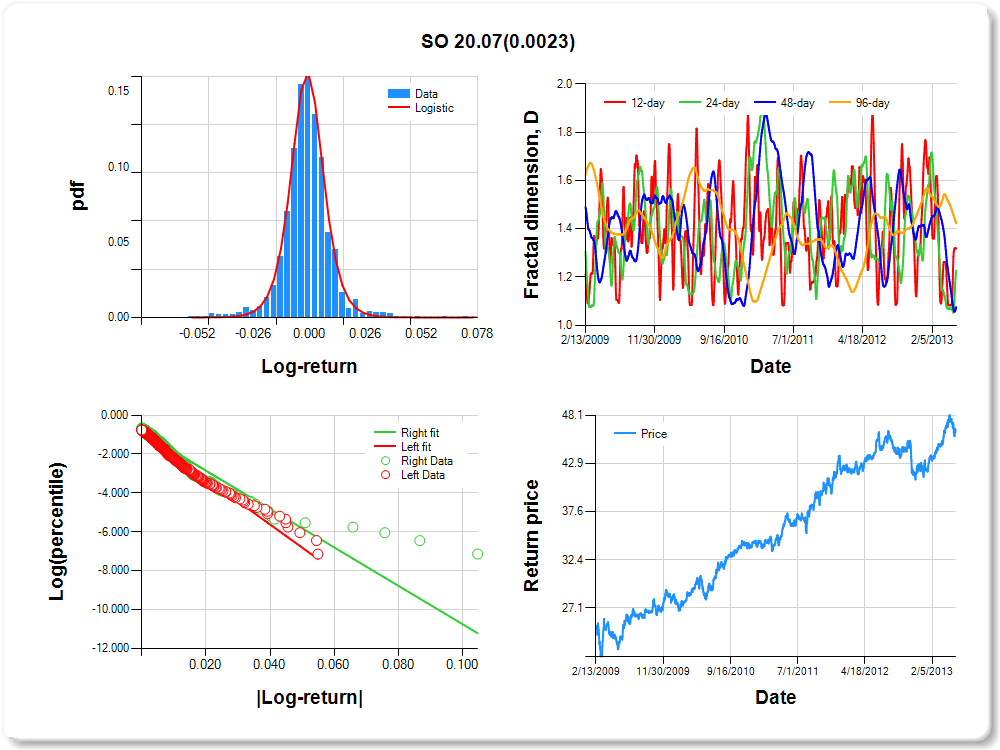
SO
Percentile values of daily loss(gain) in per cent
| 0.5 | 1 | 5 | 10 | 25 | 50 | 75 | 90 | 95 | 99 | 99.5 |
| -0.04 |
-0.03 |
-0.02 |
-0.01 |
0.00 |
0.00 |
0.01 |
0.02 |
0.04 |
0.04 |
0.56 |
Daily log-return distribution fitting results
| Distribution | Location, a | Scale, b |
| Logistic |
-0.524 |
0.105 |
Linear regression results [Model: y=log(percentile of log-return), x=|log-return|]
| Variable | Coef(b) | s.e.(b) | t-value | P-value |
| Constant |
-0.847 |
0.057 |
-14.947 |
0.0000 |
|log-return| |
-118.729 |
5.068 |
-23.428 |
0.0000 |
I(right-tail) |
-0.013 |
0.077 |
-0.175 |
0.8611 |
|log-return|*I(right-tail) |
20.075 |
6.583 |
3.050 |
0.0023 |
Hurst exponent (of daily return price)
| 12-day | 24-day | 48-day | 96-day |
| 0.682 |
0.772 |
0.925 |
0.577 |
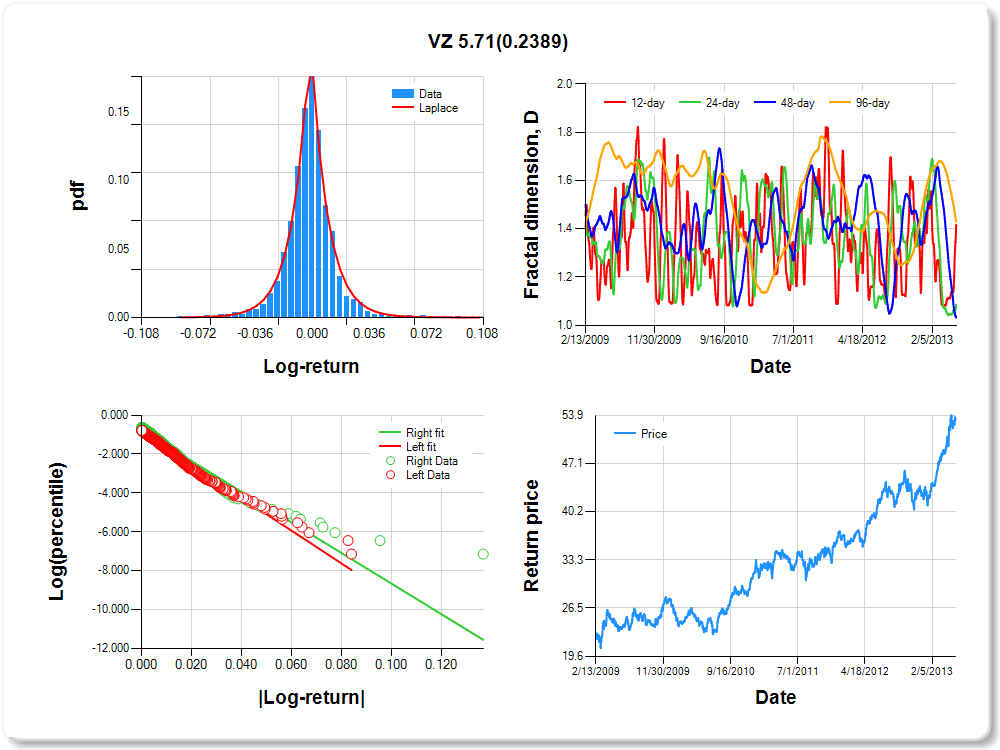
VZ
Percentile values of daily loss(gain) in per cent
| 0.5 | 1 | 5 | 10 | 25 | 50 | 75 | 90 | 95 | 99 | 99.5 |
| -0.05 |
-0.04 |
-0.02 |
-0.02 |
-0.01 |
0.00 |
0.01 |
0.02 |
0.04 |
0.06 |
1.17 |
Daily log-return distribution fitting results
| Distribution | Location, a | Scale, b |
| Laplace |
-0.397 |
0.165 |
Linear regression results [Model: y=log(percentile of log-return), x=|log-return|]
| Variable | Coef(b) | s.e.(b) | t-value | P-value |
| Constant |
-0.861 |
0.057 |
-15.047 |
0.0000 |
|log-return| |
-84.348 |
3.624 |
-23.274 |
0.0000 |
I(right-tail) |
0.078 |
0.077 |
1.012 |
0.3118 |
|log-return|*I(right-tail) |
5.707 |
4.844 |
1.178 |
0.2389 |
Hurst exponent (of daily return price)
| 12-day | 24-day | 48-day | 96-day |
| 0.584 |
0.915 |
0.969 |
0.571 |
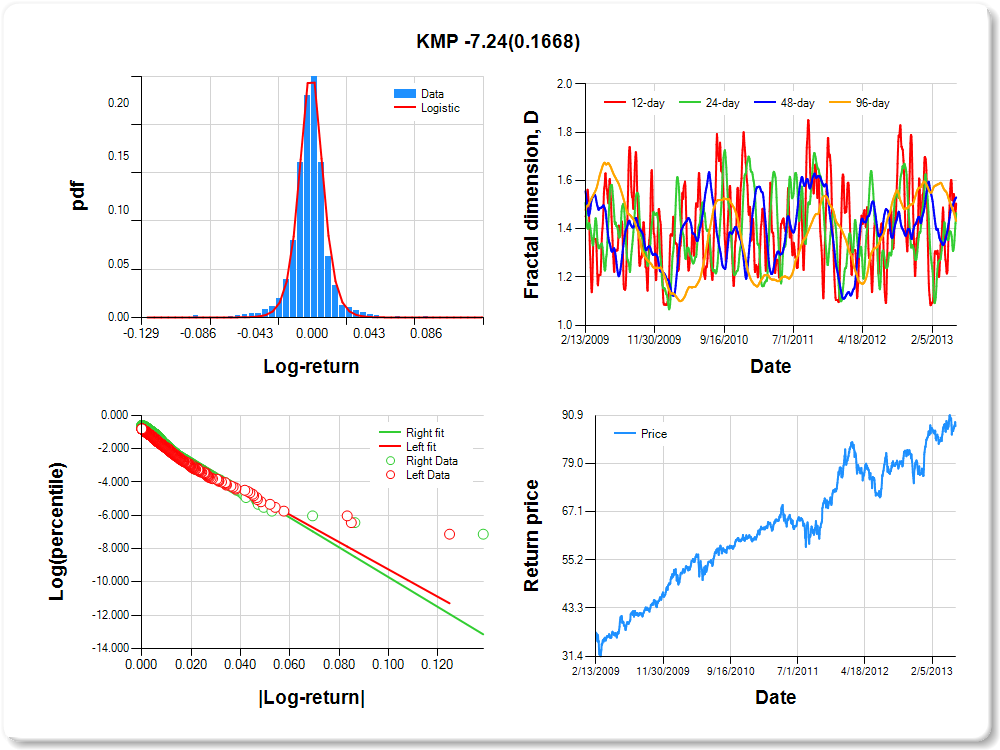
KMP
Percentile values of daily loss(gain) in per cent
| 0.5 | 1 | 5 | 10 | 25 | 50 | 75 | 90 | 95 | 99 | 99.5 |
| -0.05 |
-0.04 |
-0.02 |
-0.01 |
0.00 |
0.00 |
0.01 |
0.02 |
0.04 |
0.05 |
0.82 |
Daily log-return distribution fitting results
| Distribution | Location, a | Scale, b |
| Logistic |
-0.068 |
0.074 |
Linear regression results [Model: y=log(percentile of log-return), x=|log-return|]
| Variable | Coef(b) | s.e.(b) | t-value | P-value |
| Constant |
-1.037 |
0.055 |
-18.867 |
0.0000 |
|log-return| |
-82.095 |
3.716 |
-22.092 |
0.0000 |
I(right-tail) |
0.262 |
0.075 |
3.483 |
0.0005 |
|log-return|*I(right-tail) |
-7.240 |
5.234 |
-1.383 |
0.1668 |
Hurst exponent (of daily return price)
| 12-day | 24-day | 48-day | 96-day |
| 0.495 |
0.534 |
0.469 |
0.568 |
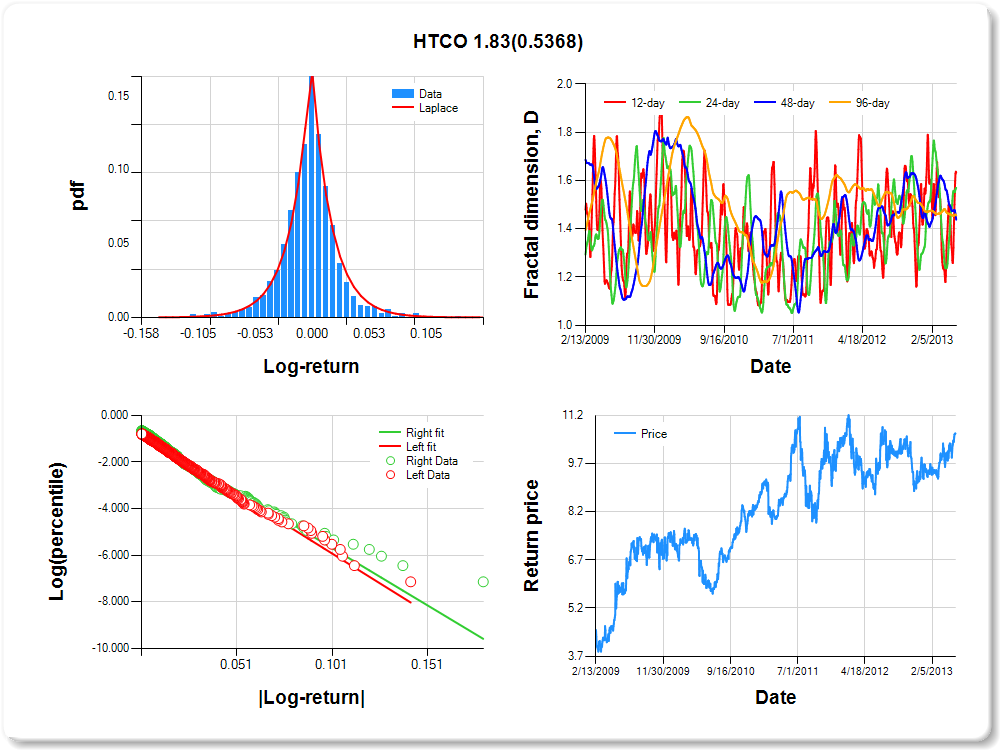
HTCO
Percentile values of daily loss(gain) in per cent
| 0.5 | 1 | 5 | 10 | 25 | 50 | 75 | 90 | 95 | 99 | 99.5 |
| -0.09 |
-0.07 |
-0.04 |
-0.03 |
-0.01 |
0.00 |
0.01 |
0.04 |
0.08 |
0.10 |
1.03 |
Daily log-return distribution fitting results
| Distribution | Location, a | Scale, b |
| Laplace |
-0.180 |
0.197 |
Linear regression results [Model: y=log(percentile of log-return), x=|log-return|]
| Variable | Coef(b) | s.e.(b) | t-value | P-value |
| Constant |
-0.800 |
0.060 |
-13.320 |
0.0000 |
|log-return| |
-50.835 |
2.195 |
-23.162 |
0.0000 |
I(right-tail) |
0.050 |
0.081 |
0.620 |
0.5353 |
|log-return|*I(right-tail) |
1.835 |
2.969 |
0.618 |
0.5368 |
Hurst exponent (of daily return price)
| 12-day | 24-day | 48-day | 96-day |
| 0.366 |
0.430 |
0.562 |
0.545 |
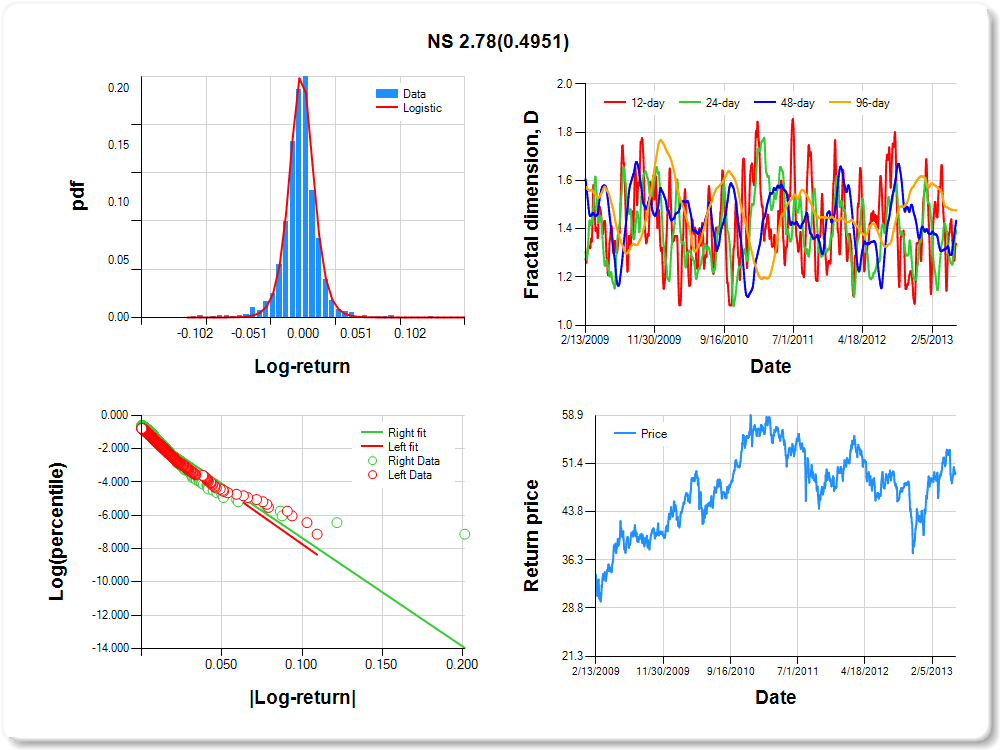
NS
Percentile values of daily loss(gain) in per cent
| 0.5 | 1 | 5 | 10 | 25 | 50 | 75 | 90 | 95 | 99 | 99.5 |
| -0.08 |
-0.05 |
-0.03 |
-0.02 |
-0.01 |
0.00 |
0.01 |
0.02 |
0.05 |
0.06 |
0.03 |
Daily log-return distribution fitting results
| Distribution | Location, a | Scale, b |
| Logistic |
-0.492 |
0.081 |
Linear regression results [Model: y=log(percentile of log-return), x=|log-return|]
| Variable | Coef(b) | s.e.(b) | t-value | P-value |
| Constant |
-0.946 |
0.056 |
-16.943 |
0.0000 |
|log-return| |
-67.779 |
2.973 |
-22.798 |
0.0000 |
I(right-tail) |
0.090 |
0.075 |
1.204 |
0.2290 |
|log-return|*I(right-tail) |
2.778 |
4.071 |
0.682 |
0.4951 |
Hurst exponent (of daily return price)
| 12-day | 24-day | 48-day | 96-day |
| 0.664 |
0.606 |
0.566 |
0.524 |
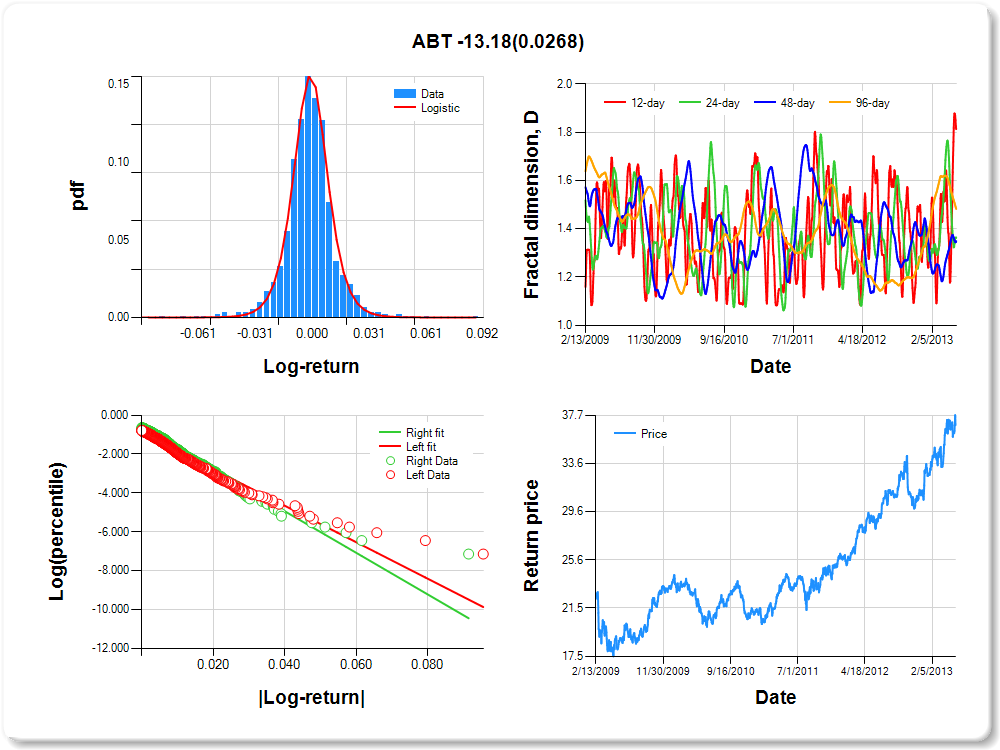
ABT
Percentile values of daily loss(gain) in per cent
| 0.5 | 1 | 5 | 10 | 25 | 50 | 75 | 90 | 95 | 99 | 99.5 |
| -0.05 |
-0.04 |
-0.02 |
-0.01 |
-0.01 |
0.00 |
0.01 |
0.02 |
0.04 |
0.04 |
0.00 |
Daily log-return distribution fitting results
| Distribution | Location, a | Scale, b |
| Logistic |
0.052 |
0.110 |
Linear regression results [Model: y=log(percentile of log-return), x=|log-return|]
| Variable | Coef(b) | s.e.(b) | t-value | P-value |
| Constant |
-0.880 |
0.057 |
-15.377 |
0.0000 |
|log-return| |
-93.807 |
4.093 |
-22.917 |
0.0000 |
I(right-tail) |
0.249 |
0.080 |
3.097 |
0.0020 |
|log-return|*I(right-tail) |
-13.181 |
5.946 |
-2.217 |
0.0268 |
Hurst exponent (of daily return price)
| 12-day | 24-day | 48-day | 96-day |
| 0.186 |
0.635 |
0.651 |
0.518 |
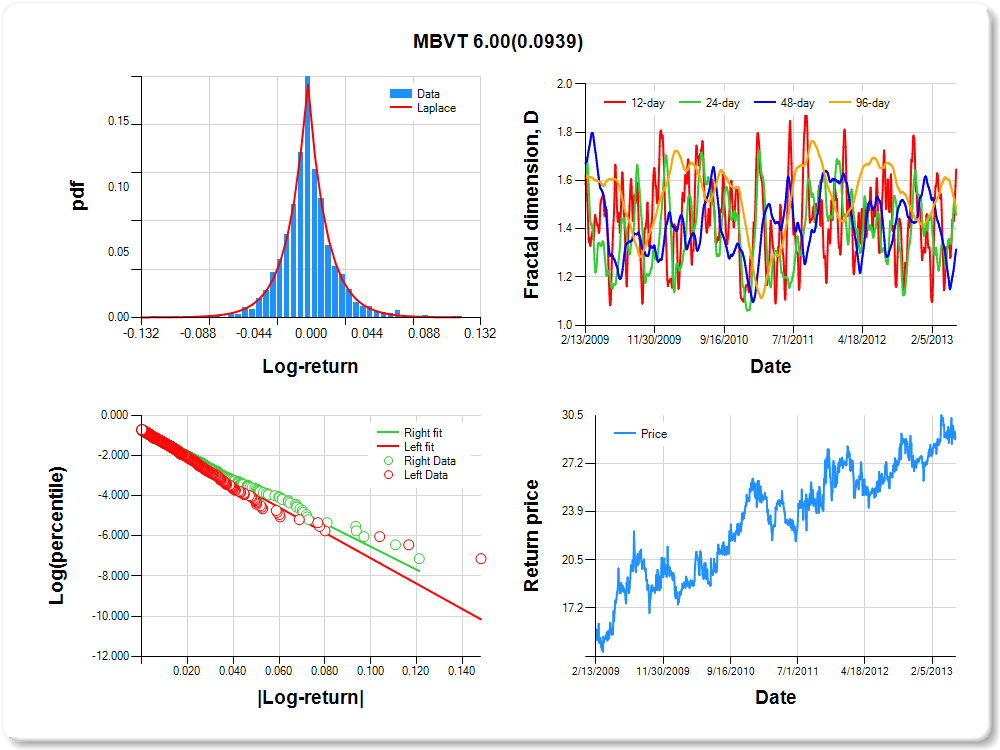
MBVT
Percentile values of daily loss(gain) in per cent
| 0.5 | 1 | 5 | 10 | 25 | 50 | 75 | 90 | 95 | 99 | 99.5 |
| -0.07 |
-0.05 |
-0.03 |
-0.02 |
-0.01 |
0.00 |
0.01 |
0.04 |
0.07 |
0.08 |
1.81 |
Daily log-return distribution fitting results
| Distribution | Location, a | Scale, b |
| Laplace |
0.168 |
0.187 |
Linear regression results [Model: y=log(percentile of log-return), x=|log-return|]
| Variable | Coef(b) | s.e.(b) | t-value | P-value |
| Constant |
-0.779 |
0.056 |
-13.863 |
0.0000 |
|log-return| |
-63.180 |
2.651 |
-23.833 |
0.0000 |
I(right-tail) |
-0.027 |
0.080 |
-0.337 |
0.7364 |
|log-return|*I(right-tail) |
5.995 |
3.576 |
1.677 |
0.0939 |
Hurst exponent (of daily return price)
| 12-day | 24-day | 48-day | 96-day |
| 0.354 |
0.542 |
0.685 |
0.517 |
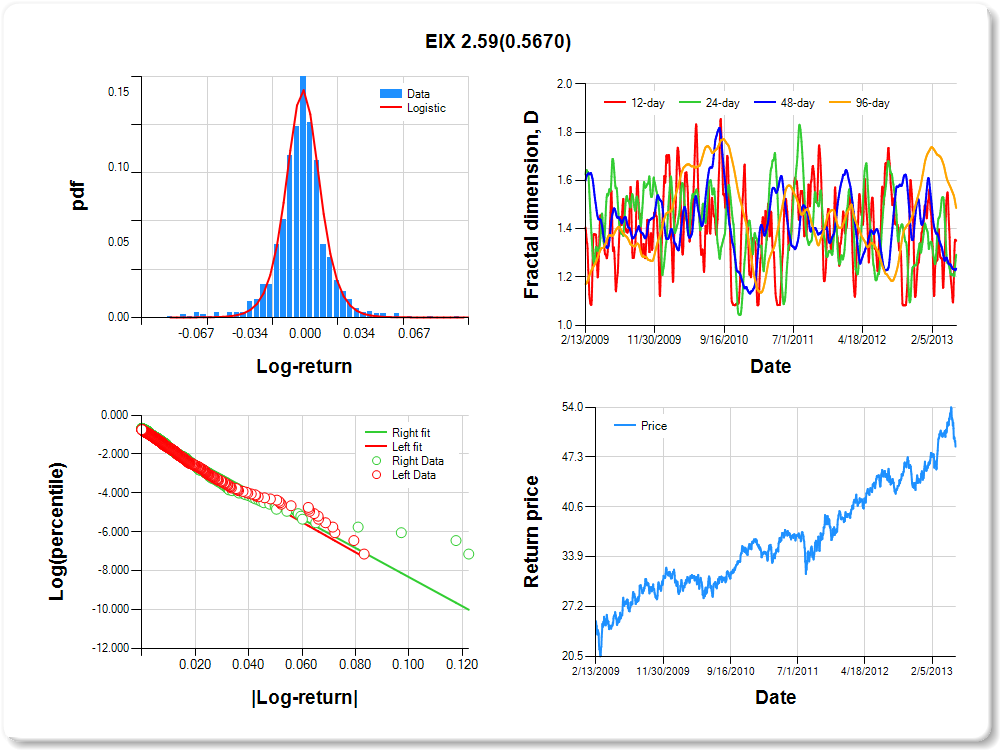
EIX
Percentile values of daily loss(gain) in per cent
| 0.5 | 1 | 5 | 10 | 25 | 50 | 75 | 90 | 95 | 99 | 99.5 |
| -0.06 |
-0.05 |
-0.02 |
-0.02 |
-0.01 |
0.00 |
0.01 |
0.02 |
0.05 |
0.06 |
0.13 |
Daily log-return distribution fitting results
| Distribution | Location, a | Scale, b |
| Logistic |
-0.317 |
0.113 |
Linear regression results [Model: y=log(percentile of log-return), x=|log-return|]
| Variable | Coef(b) | s.e.(b) | t-value | P-value |
| Constant |
-0.842 |
0.055 |
-15.183 |
0.0000 |
|log-return| |
-77.479 |
3.269 |
-23.703 |
0.0000 |
I(right-tail) |
0.015 |
0.076 |
0.194 |
0.8461 |
|log-return|*I(right-tail) |
2.590 |
4.523 |
0.573 |
0.5670 |
Hurst exponent (of daily return price)
| 12-day | 24-day | 48-day | 96-day |
| 0.649 |
0.707 |
0.765 |
0.514 |
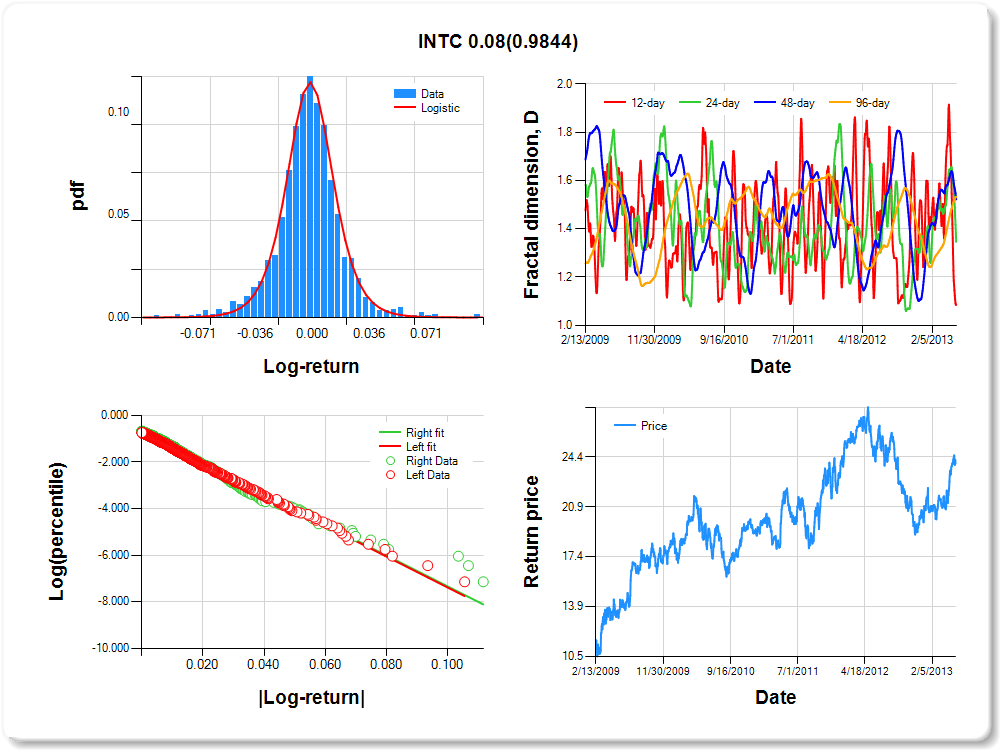
INTC
Percentile values of daily loss(gain) in per cent
| 0.5 | 1 | 5 | 10 | 25 | 50 | 75 | 90 | 95 | 99 | 99.5 |
| -0.07 |
-0.06 |
-0.03 |
-0.02 |
-0.01 |
0.00 |
0.01 |
0.03 |
0.06 |
0.07 |
1.07 |
Daily log-return distribution fitting results
| Distribution | Location, a | Scale, b |
| Logistic |
-0.038 |
0.150 |
Linear regression results [Model: y=log(percentile of log-return), x=|log-return|]
| Variable | Coef(b) | s.e.(b) | t-value | P-value |
| Constant |
-0.731 |
0.059 |
-12.460 |
0.0000 |
|log-return| |
-66.341 |
2.776 |
-23.901 |
0.0000 |
I(right-tail) |
0.039 |
0.081 |
0.475 |
0.6346 |
|log-return|*I(right-tail) |
0.076 |
3.878 |
0.020 |
0.9844 |
Hurst exponent (of daily return price)
| 12-day | 24-day | 48-day | 96-day |
| 0.914 |
0.654 |
0.478 |
0.466 |
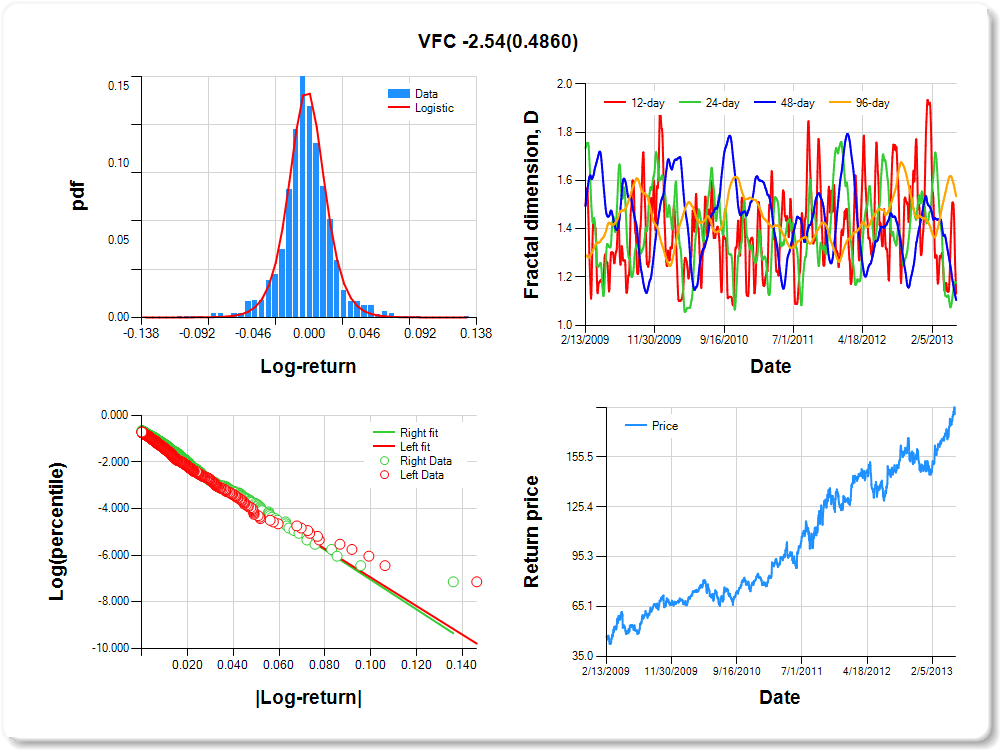
VFC
Percentile values of daily loss(gain) in per cent
| 0.5 | 1 | 5 | 10 | 25 | 50 | 75 | 90 | 95 | 99 | 99.5 |
| -0.07 |
-0.06 |
-0.03 |
-0.02 |
-0.01 |
0.00 |
0.01 |
0.03 |
0.06 |
0.07 |
2.21 |
Daily log-return distribution fitting results
| Distribution | Location, a | Scale, b |
| Logistic |
0.072 |
0.116 |
Linear regression results [Model: y=log(percentile of log-return), x=|log-return|]
| Variable | Coef(b) | s.e.(b) | t-value | P-value |
| Constant |
-0.834 |
0.055 |
-15.231 |
0.0000 |
|log-return| |
-61.232 |
2.565 |
-23.869 |
0.0000 |
I(right-tail) |
0.160 |
0.078 |
2.042 |
0.0414 |
|log-return|*I(right-tail) |
-2.536 |
3.640 |
-0.697 |
0.4860 |
Hurst exponent (of daily return price)
| 12-day | 24-day | 48-day | 96-day |
| 0.869 |
0.825 |
0.895 |
0.466 |
VOD
Percentile values of daily loss(gain) in per cent
| 0.5 | 1 | 5 | 10 | 25 | 50 | 75 | 90 | 95 | 99 | 99.5 |
| -0.09 |
-0.06 |
-0.03 |
-0.02 |
-0.01 |
0.00 |
0.01 |
0.03 |
0.06 |
0.08 |
0.98 |
Daily log-return distribution fitting results
| Distribution | Location, a | Scale, b |
| Logistic |
0.190 |
0.108 |
Linear regression results [Model: y=log(percentile of log-return), x=|log-return|]
| Variable | Coef(b) | s.e.(b) | t-value | P-value |
| Constant |
-0.901 |
0.054 |
-16.729 |
0.0000 |
|log-return| |
-58.702 |
2.510 |
-23.387 |
0.0000 |
I(right-tail) |
0.166 |
0.077 |
2.153 |
0.0315 |
|log-return|*I(right-tail) |
-7.133 |
3.680 |
-1.938 |
0.0528 |
Hurst exponent (of daily return price)
| 12-day | 24-day | 48-day | 96-day |
| 0.701 |
0.808 |
0.621 |
0.464 |
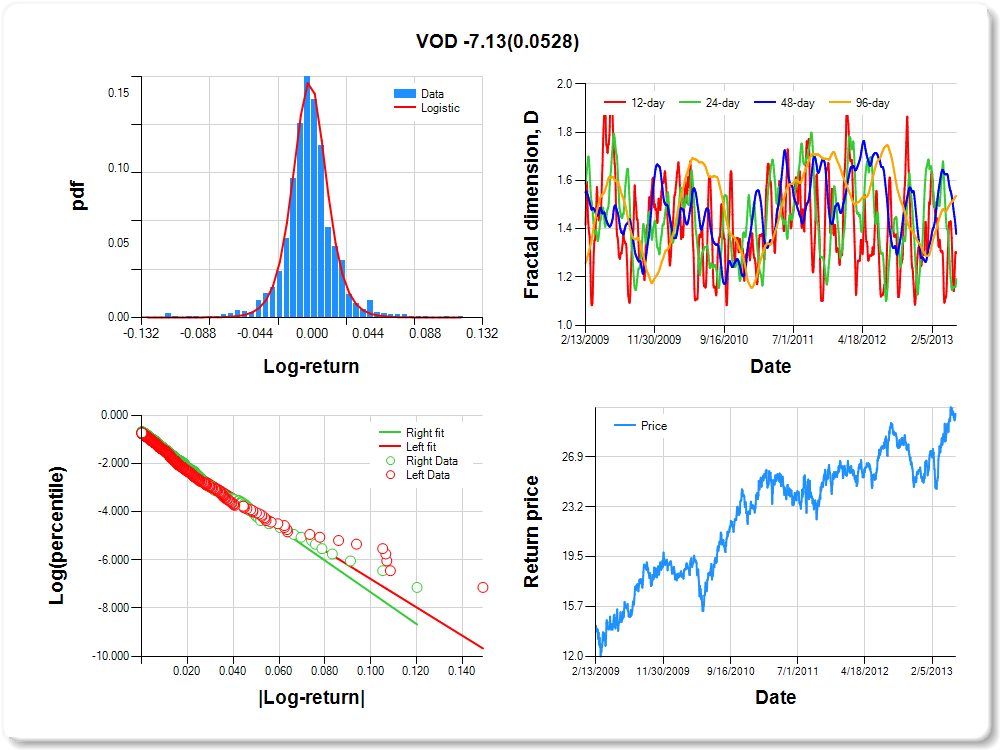
ITW
Percentile values of daily loss(gain) in per cent
| 0.5 | 1 | 5 | 10 | 25 | 50 | 75 | 90 | 95 | 99 | 99.5 |
| -0.08 |
-0.06 |
-0.03 |
-0.02 |
-0.01 |
0.00 |
0.01 |
0.03 |
0.06 |
0.06 |
1.13 |
Daily log-return distribution fitting results
| Distribution | Location, a | Scale, b |
| Laplace |
-0.141 |
0.209 |
Linear regression results [Model: y=log(percentile of log-return), x=|log-return|]
| Variable | Coef(b) | s.e.(b) | t-value | P-value |
| Constant |
-0.805 |
0.056 |
-14.294 |
0.0000 |
|log-return| |
-64.924 |
2.716 |
-23.908 |
0.0000 |
I(right-tail) |
0.106 |
0.079 |
1.355 |
0.1757 |
|log-return|*I(right-tail) |
-3.012 |
3.860 |
-0.780 |
0.4353 |
Hurst exponent (of daily return price)
| 12-day | 24-day | 48-day | 96-day |
| 0.737 |
0.415 |
0.449 |
0.457 |

MRK
Percentile values of daily loss(gain) in per cent
| 0.5 | 1 | 5 | 10 | 25 | 50 | 75 | 90 | 95 | 99 | 99.5 |
| -0.07 |
-0.06 |
-0.03 |
-0.02 |
-0.01 |
0.00 |
0.01 |
0.03 |
0.05 |
0.07 |
0.33 |
Daily log-return distribution fitting results
| Distribution | Location, a | Scale, b |
| Logistic |
0.013 |
0.113 |
Linear regression results [Model: y=log(percentile of log-return), x=|log-return|]
| Variable | Coef(b) | s.e.(b) | t-value | P-value |
| Constant |
-0.883 |
0.054 |
-16.440 |
0.0000 |
|log-return| |
-67.350 |
2.849 |
-23.640 |
0.0000 |
I(right-tail) |
0.115 |
0.077 |
1.498 |
0.1343 |
|log-return|*I(right-tail) |
-2.999 |
4.081 |
-0.735 |
0.4626 |
Hurst exponent (of daily return price)
| 12-day | 24-day | 48-day | 96-day |
| 0.563 |
0.653 |
0.684 |
0.456 |
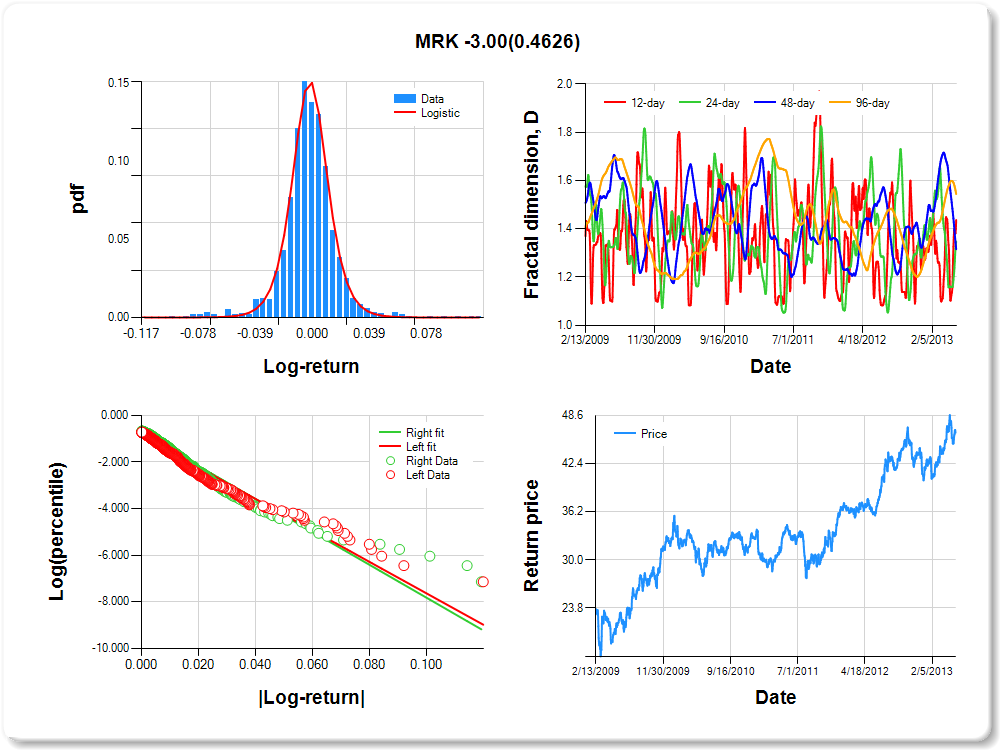
APU
Percentile values of daily loss(gain) in per cent
| 0.5 | 1 | 5 | 10 | 25 | 50 | 75 | 90 | 95 | 99 | 99.5 |
| -0.08 |
-0.05 |
-0.02 |
-0.01 |
-0.01 |
0.00 |
0.01 |
0.02 |
0.04 |
0.07 |
0.97 |
Daily log-return distribution fitting results
| Distribution | Location, a | Scale, b |
| Logistic |
-0.346 |
0.056 |
Linear regression results [Model: y=log(percentile of log-return), x=|log-return|]
| Variable | Coef(b) | s.e.(b) | t-value | P-value |
| Constant |
-1.115 |
0.051 |
-21.689 |
0.0000 |
|log-return| |
-58.127 |
2.686 |
-21.644 |
0.0000 |
I(right-tail) |
0.117 |
0.071 |
1.645 |
0.1002 |
|log-return|*I(right-tail) |
2.403 |
3.752 |
0.640 |
0.5220 |
Hurst exponent (of daily return price)
| 12-day | 24-day | 48-day | 96-day |
| 0.654 |
0.433 |
0.643 |
0.453 |

HCBK
Percentile values of daily loss(gain) in per cent
| 0.5 | 1 | 5 | 10 | 25 | 50 | 75 | 90 | 95 | 99 | 99.5 |
| -0.10 |
-0.08 |
-0.04 |
-0.03 |
-0.01 |
0.00 |
0.01 |
0.04 |
0.07 |
0.11 |
1.37 |
Daily log-return distribution fitting results
| Distribution | Location, a | Scale, b |
| Laplace |
0.026 |
0.194 |
Linear regression results [Model: y=log(percentile of log-return), x=|log-return|]
| Variable | Coef(b) | s.e.(b) | t-value | P-value |
| Constant |
-0.849 |
0.055 |
-15.494 |
0.0000 |
|log-return| |
-48.605 |
2.040 |
-23.822 |
0.0000 |
I(right-tail) |
0.022 |
0.077 |
0.289 |
0.7726 |
|log-return|*I(right-tail) |
-2.686 |
2.960 |
-0.907 |
0.3643 |
Hurst exponent (of daily return price)
| 12-day | 24-day | 48-day | 96-day |
| 0.732 |
0.564 |
0.390 |
0.449 |
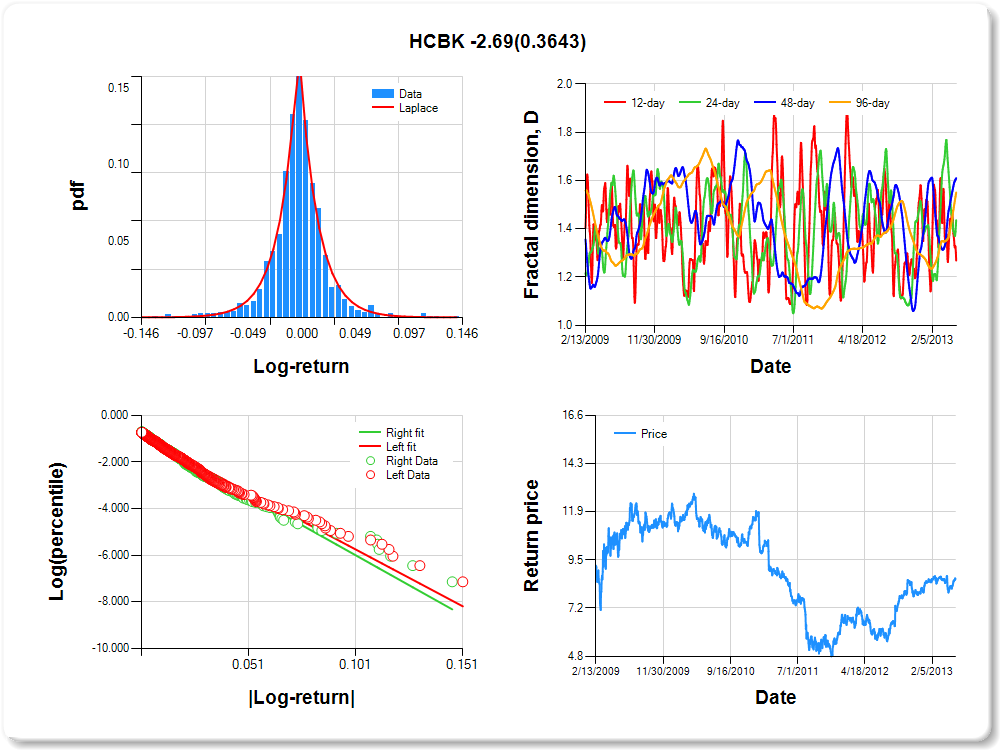
DO
Percentile values of daily loss(gain) in per cent
| 0.5 | 1 | 5 | 10 | 25 | 50 | 75 | 90 | 95 | 99 | 99.5 |
| -0.11 |
-0.07 |
-0.04 |
-0.03 |
-0.01 |
0.00 |
0.01 |
0.04 |
0.08 |
0.10 |
0.66 |
Daily log-return distribution fitting results
| Distribution | Location, a | Scale, b |
| Logistic |
-0.036 |
0.094 |
Linear regression results [Model: y=log(percentile of log-return), x=|log-return|]
| Variable | Coef(b) | s.e.(b) | t-value | P-value |
| Constant |
-0.872 |
0.054 |
-16.257 |
0.0000 |
|log-return| |
-44.931 |
1.900 |
-23.645 |
0.0000 |
I(right-tail) |
0.106 |
0.076 |
1.388 |
0.1654 |
|log-return|*I(right-tail) |
-5.108 |
2.811 |
-1.817 |
0.0695 |
Hurst exponent (of daily return price)
| 12-day | 24-day | 48-day | 96-day |
| 0.702 |
0.456 |
0.536 |
0.437 |
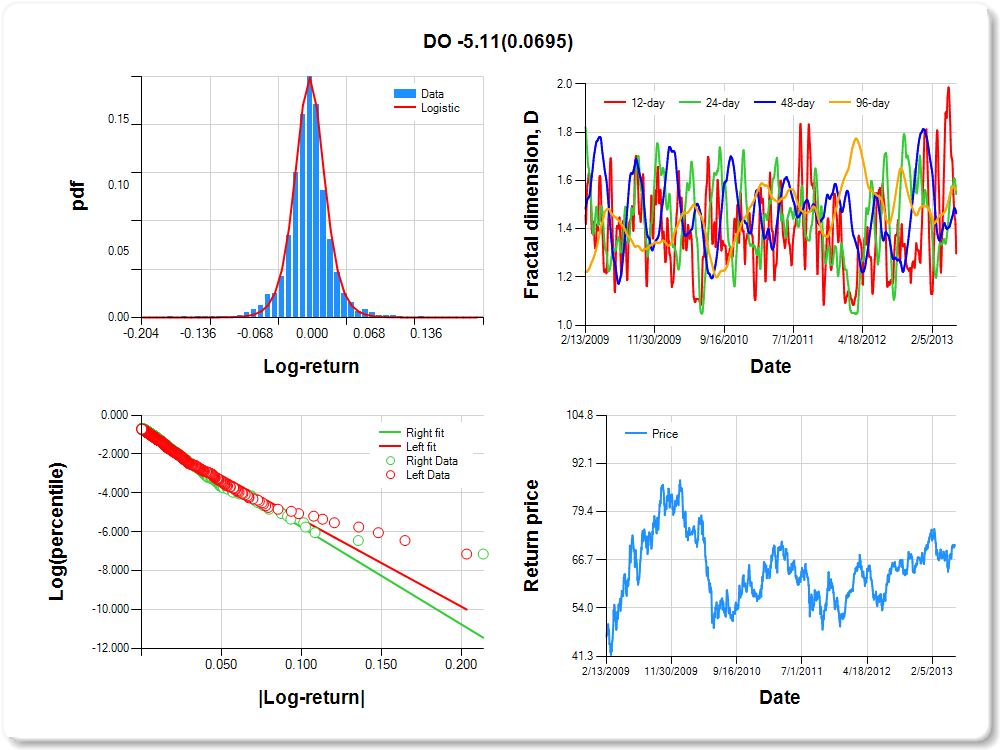
MTB
Percentile values of daily loss(gain) in per cent
| 0.5 | 1 | 5 | 10 | 25 | 50 | 75 | 90 | 95 | 99 | 99.5 |
| -0.11 |
-0.08 |
-0.04 |
-0.03 |
-0.01 |
0.00 |
0.01 |
0.04 |
0.08 |
0.12 |
0.84 |
Daily log-return distribution fitting results
| Distribution | Location, a | Scale, b |
| Laplace |
-0.087 |
0.165 |
Linear regression results [Model: y=log(percentile of log-return), x=|log-return|]
| Variable | Coef(b) | s.e.(b) | t-value | P-value |
| Constant |
-0.885 |
0.054 |
-16.512 |
0.0000 |
|log-return| |
-44.029 |
1.843 |
-23.886 |
0.0000 |
I(right-tail) |
0.051 |
0.074 |
0.686 |
0.4927 |
|log-return|*I(right-tail) |
-0.174 |
2.581 |
-0.068 |
0.9462 |
Hurst exponent (of daily return price)
| 12-day | 24-day | 48-day | 96-day |
| 0.800 |
0.507 |
0.376 |
0.419 |
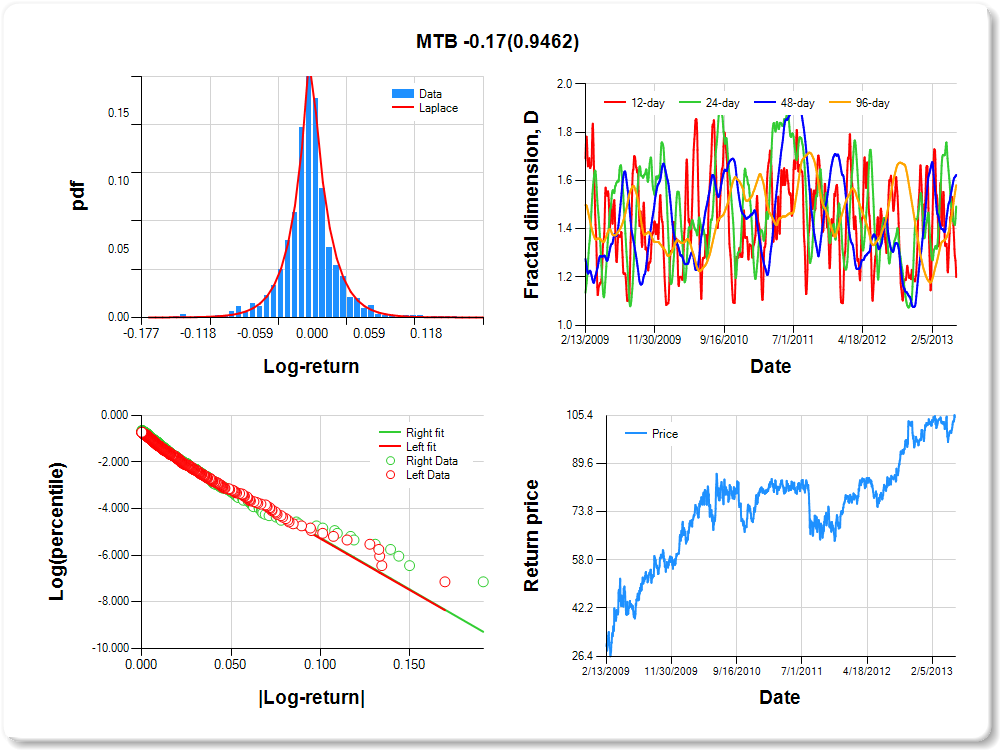
YUM
Percentile values of daily loss(gain) in per cent
| 0.5 | 1 | 5 | 10 | 25 | 50 | 75 | 90 | 95 | 99 | 99.5 |
| -0.07 |
-0.05 |
-0.03 |
-0.02 |
-0.01 |
0.00 |
0.01 |
0.03 |
0.06 |
0.07 |
0.44 |
Daily log-return distribution fitting results
| Distribution | Location, a | Scale, b |
| Logistic |
-0.017 |
0.141 |
Linear regression results [Model: y=log(percentile of log-return), x=|log-return|]
| Variable | Coef(b) | s.e.(b) | t-value | P-value |
| Constant |
-0.795 |
0.058 |
-13.722 |
0.0000 |
|log-return| |
-68.288 |
2.894 |
-23.598 |
0.0000 |
I(right-tail) |
0.128 |
0.079 |
1.615 |
0.1066 |
|log-return|*I(right-tail) |
-2.870 |
4.045 |
-0.709 |
0.4782 |
Hurst exponent (of daily return price)
| 12-day | 24-day | 48-day | 96-day |
| 0.687 |
0.581 |
0.476 |
0.400 |
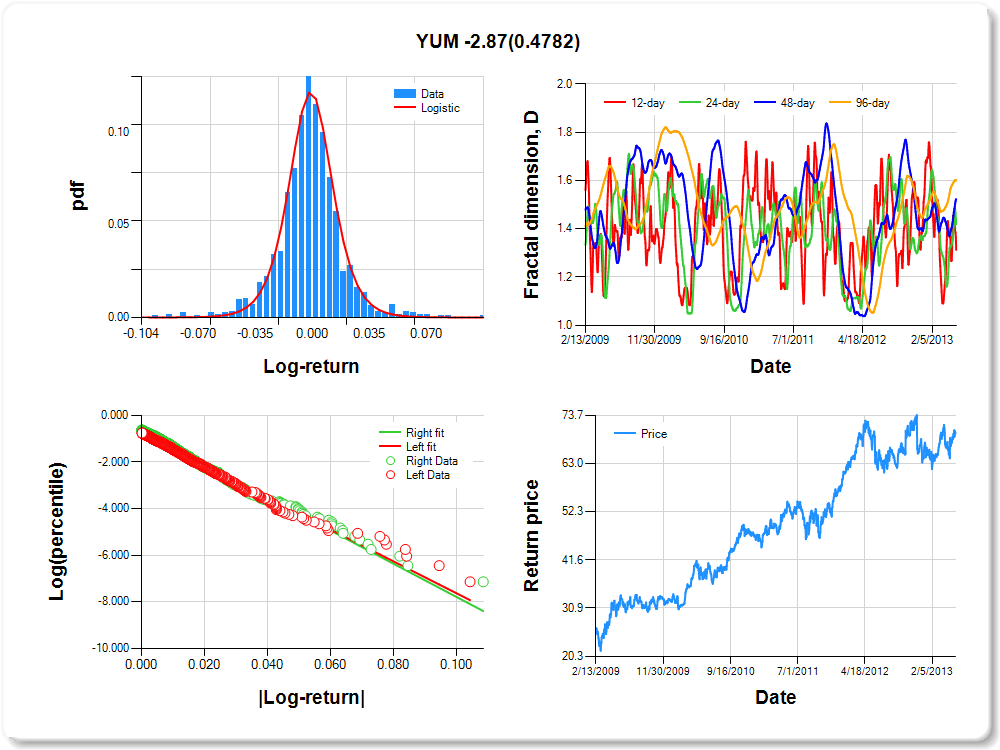
CPSI
Percentile values of daily loss(gain) in per cent
| 0.5 | 1 | 5 | 10 | 25 | 50 | 75 | 90 | 95 | 99 | 99.5 |
| -0.10 |
-0.08 |
-0.03 |
-0.02 |
-0.01 |
0.00 |
0.01 |
0.04 |
0.07 |
0.10 |
1.02 |
Daily log-return distribution fitting results
| Distribution | Location, a | Scale, b |
| Laplace |
0.595 |
0.122 |
Linear regression results [Model: y=log(percentile of log-return), x=|log-return|]
| Variable | Coef(b) | s.e.(b) | t-value | P-value |
| Constant |
-1.065 |
0.051 |
-20.860 |
0.0000 |
|log-return| |
-38.878 |
1.793 |
-21.682 |
0.0000 |
I(right-tail) |
0.328 |
0.074 |
4.406 |
0.0000 |
|log-return|*I(right-tail) |
-12.411 |
2.758 |
-4.500 |
0.0000 |
Hurst exponent (of daily return price)
| 12-day | 24-day | 48-day | 96-day |
| 0.746 |
0.483 |
0.593 |
0.383 |
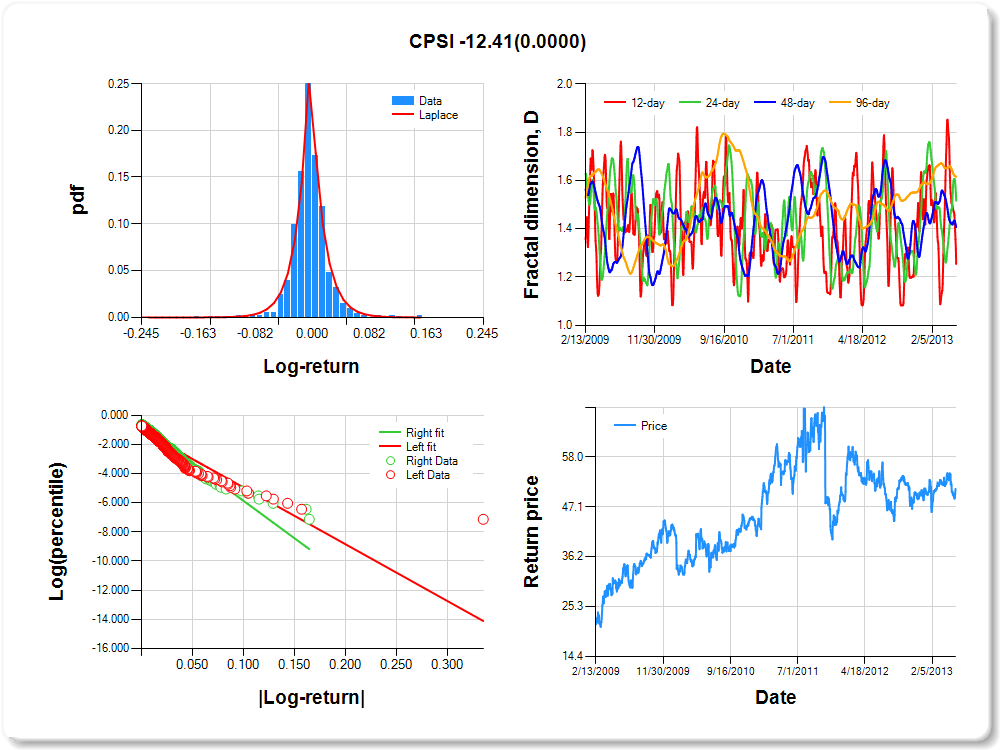
FTR
Percentile values of daily loss(gain) in per cent
| 0.5 | 1 | 5 | 10 | 25 | 50 | 75 | 90 | 95 | 99 | 99.5 |
| -0.09 |
-0.07 |
-0.04 |
-0.02 |
-0.01 |
0.00 |
0.01 |
0.04 |
0.07 |
0.09 |
2.58 |
Daily log-return distribution fitting results
| Distribution | Location, a | Scale, b |
| Laplace |
-0.081 |
0.196 |
Linear regression results [Model: y=log(percentile of log-return), x=|log-return|]
| Variable | Coef(b) | s.e.(b) | t-value | P-value |
| Constant |
-0.820 |
0.058 |
-14.208 |
0.0000 |
|log-return| |
-55.132 |
2.353 |
-23.430 |
0.0000 |
I(right-tail) |
0.087 |
0.082 |
1.059 |
0.2898 |
|log-return|*I(right-tail) |
-2.989 |
3.399 |
-0.879 |
0.3795 |
Hurst exponent (of daily return price)
| 12-day | 24-day | 48-day | 96-day |
| 0.266 |
0.338 |
0.465 |
0.323 |
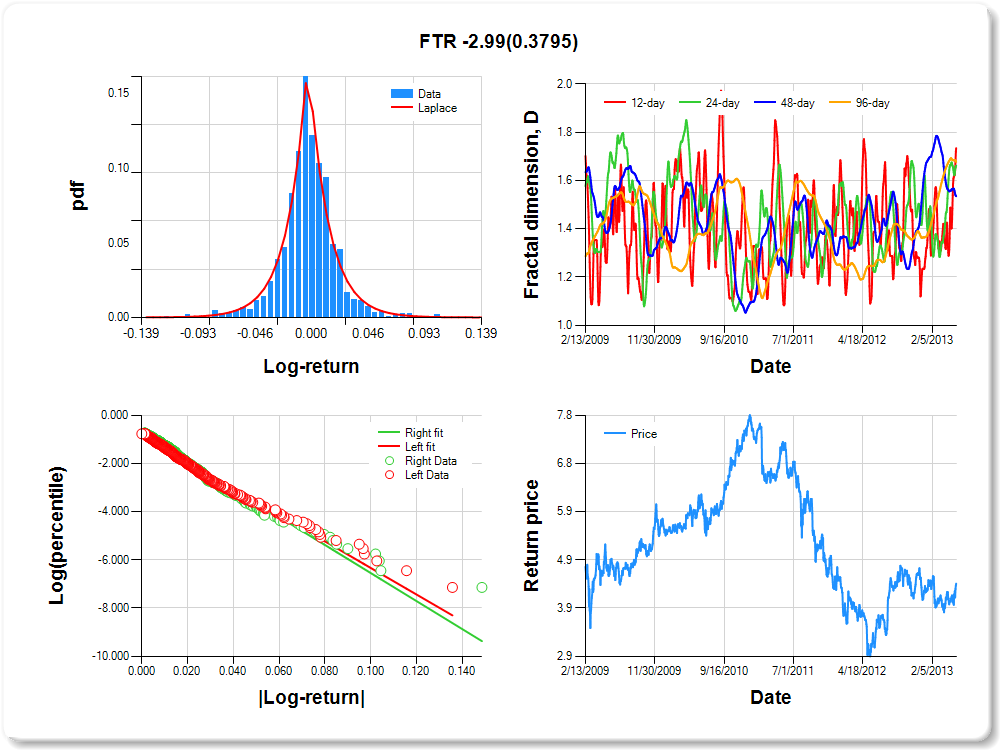
EEP
Percentile values of daily loss(gain) in per cent
| 0.5 | 1 | 5 | 10 | 25 | 50 | 75 | 90 | 95 | 99 | 99.5 |
| -0.08 |
-0.06 |
-0.03 |
-0.02 |
-0.01 |
0.00 |
0.01 |
0.03 |
0.05 |
0.07 |
0.38 |
Daily log-return distribution fitting results
| Distribution | Location, a | Scale, b |
| Laplace |
-0.405 |
0.115 |
Linear regression results [Model: y=log(percentile of log-return), x=|log-return|]
| Variable | Coef(b) | s.e.(b) | t-value | P-value |
| Constant |
-1.018 |
0.055 |
-18.657 |
0.0000 |
|log-return| |
-62.427 |
2.752 |
-22.681 |
0.0000 |
I(right-tail) |
0.139 |
0.074 |
1.880 |
0.0604 |
|log-return|*I(right-tail) |
0.915 |
3.807 |
0.240 |
0.8102 |
Hurst exponent (of daily return price)
| 12-day | 24-day | 48-day | 96-day |
| 0.419 |
0.518 |
0.429 |
0.294 |

XOM
Percentile values of daily loss(gain) in per cent
| 0.5 | 1 | 5 | 10 | 25 | 50 | 75 | 90 | 95 | 99 | 99.5 |
| -0.07 |
-0.05 |
-0.02 |
-0.02 |
-0.01 |
0.00 |
0.01 |
0.02 |
0.04 |
0.09 |
1.05 |
Daily log-return distribution fitting results
| Distribution | Location, a | Scale, b |
| Logistic |
-0.044 |
0.079 |
Linear regression results [Model: y=log(percentile of log-return), x=|log-return|]
| Variable | Coef(b) | s.e.(b) | t-value | P-value |
| Constant |
-0.948 |
0.052 |
-18.247 |
0.0000 |
|log-return| |
-65.175 |
2.811 |
-23.187 |
0.0000 |
I(right-tail) |
0.016 |
0.073 |
0.216 |
0.8293 |
|log-return|*I(right-tail) |
1.687 |
3.933 |
0.429 |
0.6680 |
Hurst exponent (of daily return price)
| 12-day | 24-day | 48-day | 96-day |
| 0.610 |
0.534 |
0.467 |
0.238 |
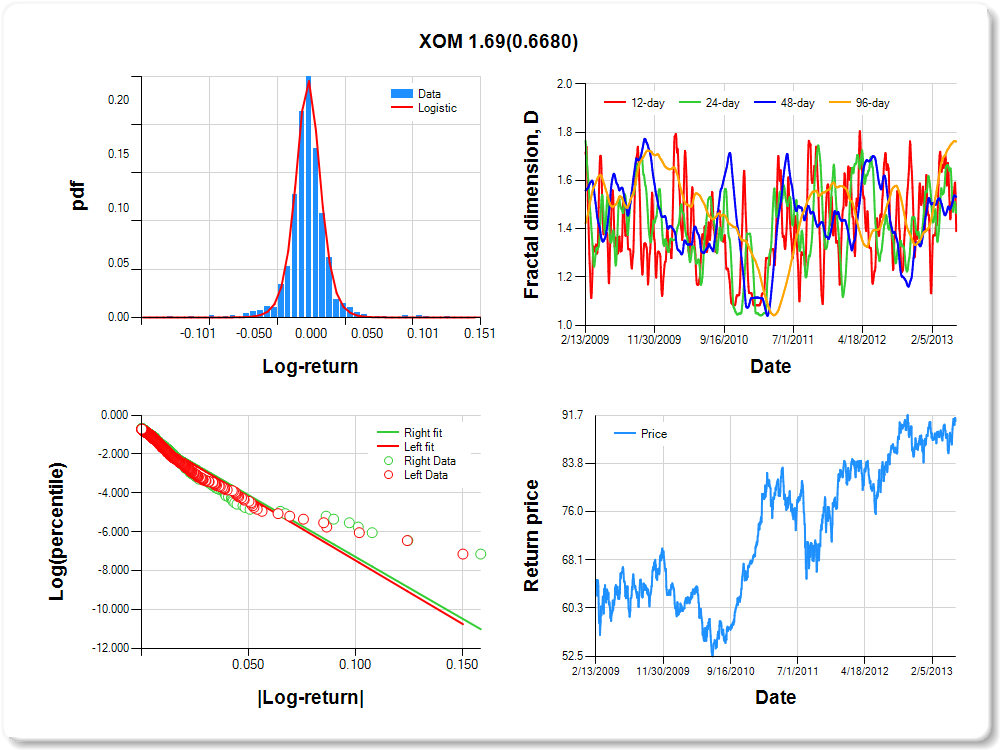
EQR
Percentile values of daily loss(gain) in per cent
| 0.5 | 1 | 5 | 10 | 25 | 50 | 75 | 90 | 95 | 99 | 99.5 |
| -0.12 |
-0.10 |
-0.05 |
-0.03 |
-0.01 |
0.00 |
0.01 |
0.05 |
0.12 |
0.16 |
0.03 |
Daily log-return distribution fitting results
| Distribution | Location, a | Scale, b |
| Laplace |
0.133 |
0.122 |
Linear regression results [Model: y=log(percentile of log-return), x=|log-return|]
| Variable | Coef(b) | s.e.(b) | t-value | P-value |
| Constant |
-1.012 |
0.051 |
-19.703 |
0.0000 |
|log-return| |
-33.940 |
1.456 |
-23.312 |
0.0000 |
I(right-tail) |
0.063 |
0.071 |
0.886 |
0.3755 |
|log-return|*I(right-tail) |
0.051 |
2.022 |
0.025 |
0.9798 |
Hurst exponent (of daily return price)
| 12-day | 24-day | 48-day | 96-day |
| 0.674 |
0.635 |
0.373 |
0.233 |
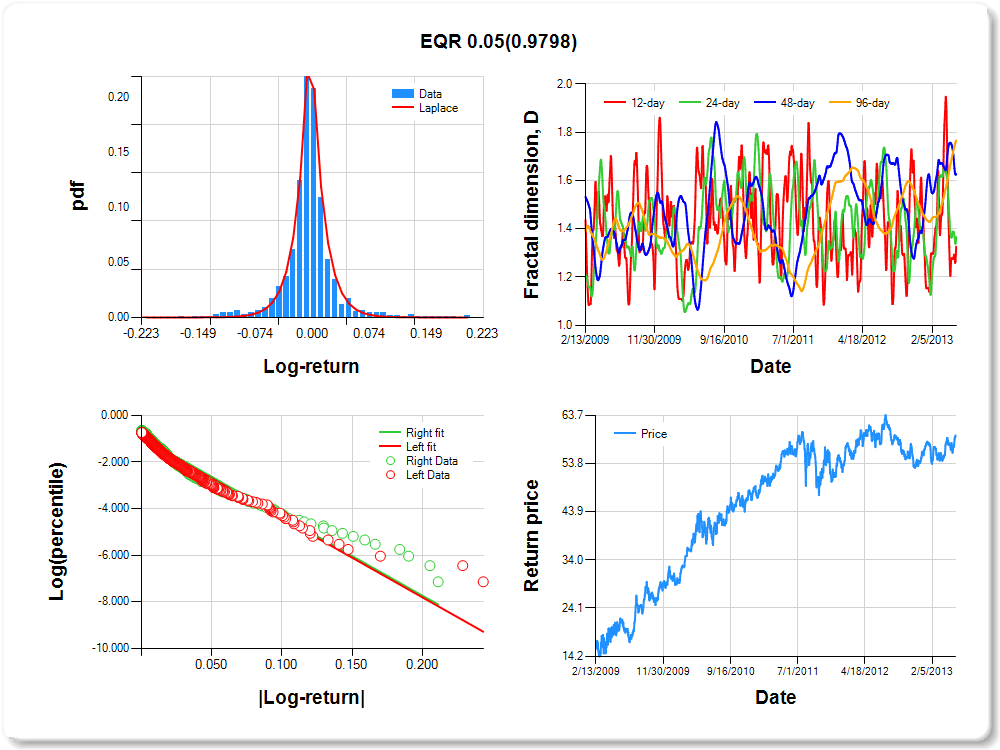
FL
Percentile values of daily loss(gain) in per cent
| 0.5 | 1 | 5 | 10 | 25 | 50 | 75 | 90 | 95 | 99 | 99.5 |
| -0.08 |
-0.07 |
-0.04 |
-0.03 |
-0.01 |
0.00 |
0.02 |
0.04 |
0.09 |
0.11 |
0.16 |
Daily log-return distribution fitting results
| Distribution | Location, a | Scale, b |
| Logistic |
0.767 |
0.096 |
Linear regression results [Model: y=log(percentile of log-return), x=|log-return|]
| Variable | Coef(b) | s.e.(b) | t-value | P-value |
| Constant |
-0.963 |
0.055 |
-17.413 |
0.0000 |
|log-return| |
-39.542 |
1.822 |
-21.708 |
0.0000 |
I(right-tail) |
0.305 |
0.078 |
3.901 |
0.0001 |
|log-return|*I(right-tail) |
-9.542 |
2.677 |
-3.564 |
0.0004 |
Hurst exponent (of daily return price)
| 12-day | 24-day | 48-day | 96-day |
| 0.669 |
0.356 |
0.330 |
0.233 |