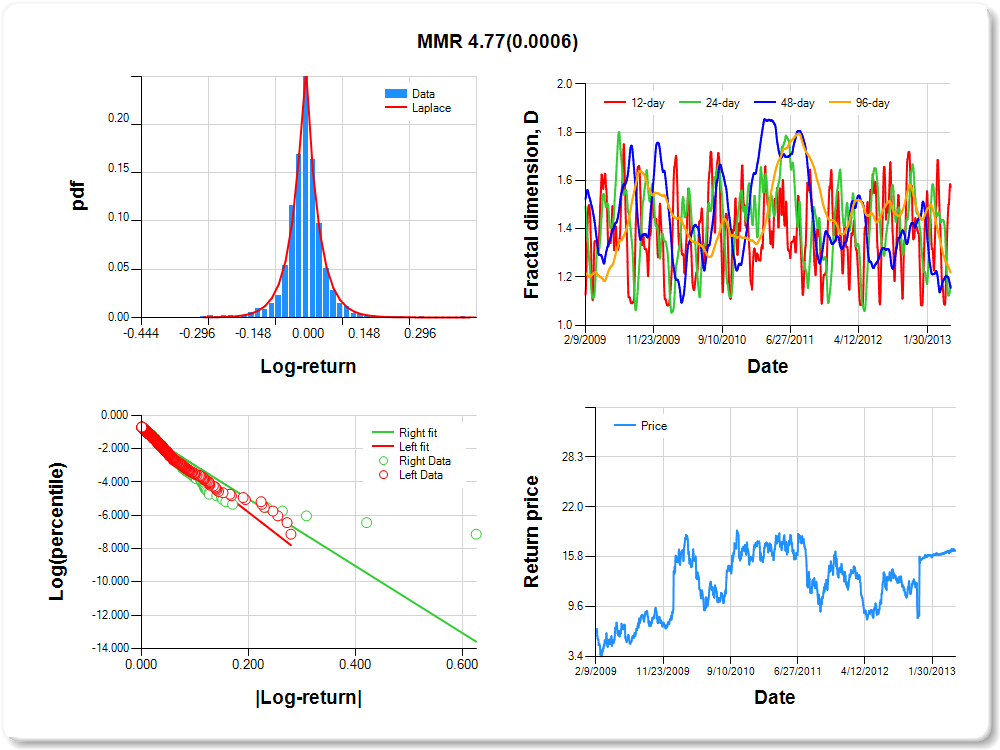
MMR
Percentile values of daily loss(gain) in per cent
| 0.5 | 1 | 5 | 10 | 25 | 50 | 75 | 90 | 95 | 99 | 99.5 |
| -0.20 |
-0.13 |
-0.07 |
-0.05 |
-0.02 |
0.00 |
0.02 |
0.08 |
0.13 |
0.17 |
0.46 |
Daily log-return distribution fitting results
| Distribution | Location, a | Scale, b |
| Laplace |
-0.659 |
0.129 |
Linear regression results [Model: y=log(percentile of log-return), x=|log-return|]
| Variable | Coef(b) | s.e.(b) | t-value | P-value |
| Constant |
-0.856 |
0.054 |
-15.938 |
0.0000 |
|log-return| |
-24.861 |
1.041 |
-23.888 |
0.0000 |
I(right-tail) |
-0.158 |
0.074 |
-2.125 |
0.0337 |
|log-return|*I(right-tail) |
4.773 |
1.387 |
3.441 |
0.0006 |
Hurst exponent (of daily return price)
| 12-day | 24-day | 48-day | 96-day |
| 0.428 |
0.836 |
0.844 |
0.782 |
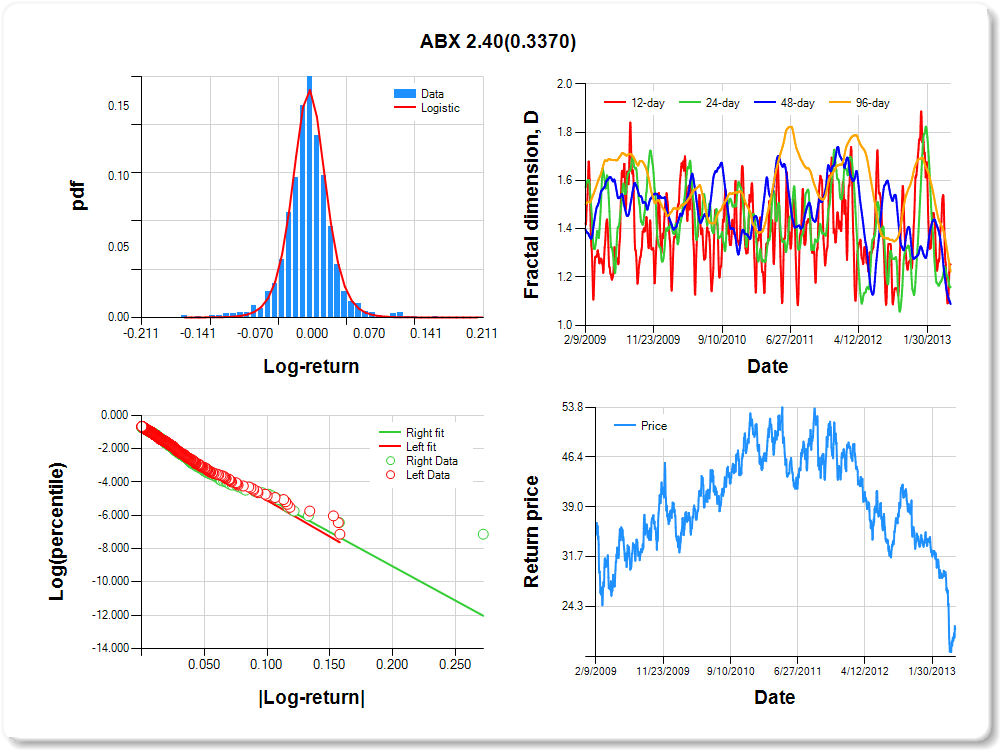
ABX
Percentile values of daily loss(gain) in per cent
| 0.5 | 1 | 5 | 10 | 25 | 50 | 75 | 90 | 95 | 99 | 99.5 |
| -0.11 |
-0.09 |
-0.05 |
-0.03 |
-0.01 |
0.00 |
0.01 |
0.04 |
0.09 |
0.12 |
1.29 |
Daily log-return distribution fitting results
| Distribution | Location, a | Scale, b |
| Logistic |
-0.454 |
0.106 |
Linear regression results [Model: y=log(percentile of log-return), x=|log-return|]
| Variable | Coef(b) | s.e.(b) | t-value | P-value |
| Constant |
-0.761 |
0.054 |
-14.028 |
0.0000 |
|log-return| |
-43.447 |
1.771 |
-24.527 |
0.0000 |
I(right-tail) |
-0.086 |
0.077 |
-1.116 |
0.2644 |
|log-return|*I(right-tail) |
2.400 |
2.499 |
0.960 |
0.3370 |
Hurst exponent (of daily return price)
| 12-day | 24-day | 48-day | 96-day |
| 0.748 |
0.841 |
0.912 |
0.777 |
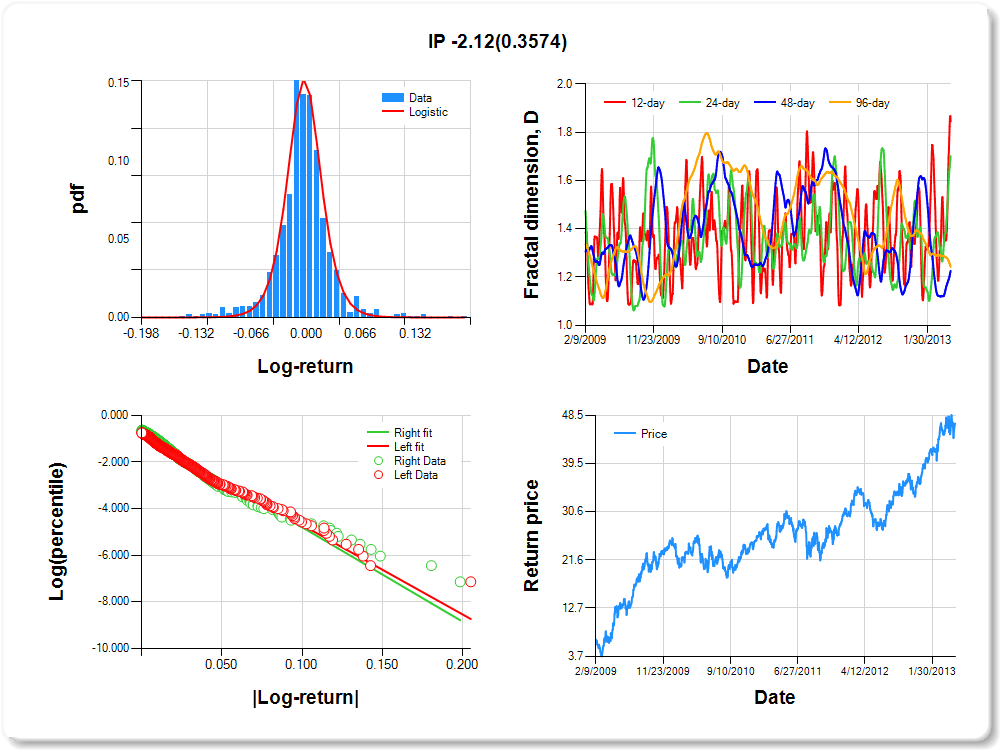
IP
Percentile values of daily loss(gain) in per cent
| 0.5 | 1 | 5 | 10 | 25 | 50 | 75 | 90 | 95 | 99 | 99.5 |
| -0.11 |
-0.10 |
-0.05 |
-0.03 |
-0.01 |
0.00 |
0.02 |
0.05 |
0.10 |
0.13 |
0.85 |
Daily log-return distribution fitting results
| Distribution | Location, a | Scale, b |
| Logistic |
0.042 |
0.112 |
Linear regression results [Model: y=log(percentile of log-return), x=|log-return|]
| Variable | Coef(b) | s.e.(b) | t-value | P-value |
| Constant |
-0.865 |
0.056 |
-15.537 |
0.0000 |
|log-return| |
-38.325 |
1.625 |
-23.582 |
0.0000 |
I(right-tail) |
0.114 |
0.077 |
1.487 |
0.1374 |
|log-return|*I(right-tail) |
-2.121 |
2.304 |
-0.921 |
0.3574 |
Hurst exponent (of daily return price)
| 12-day | 24-day | 48-day | 96-day |
| 0.155 |
0.299 |
0.774 |
0.758 |
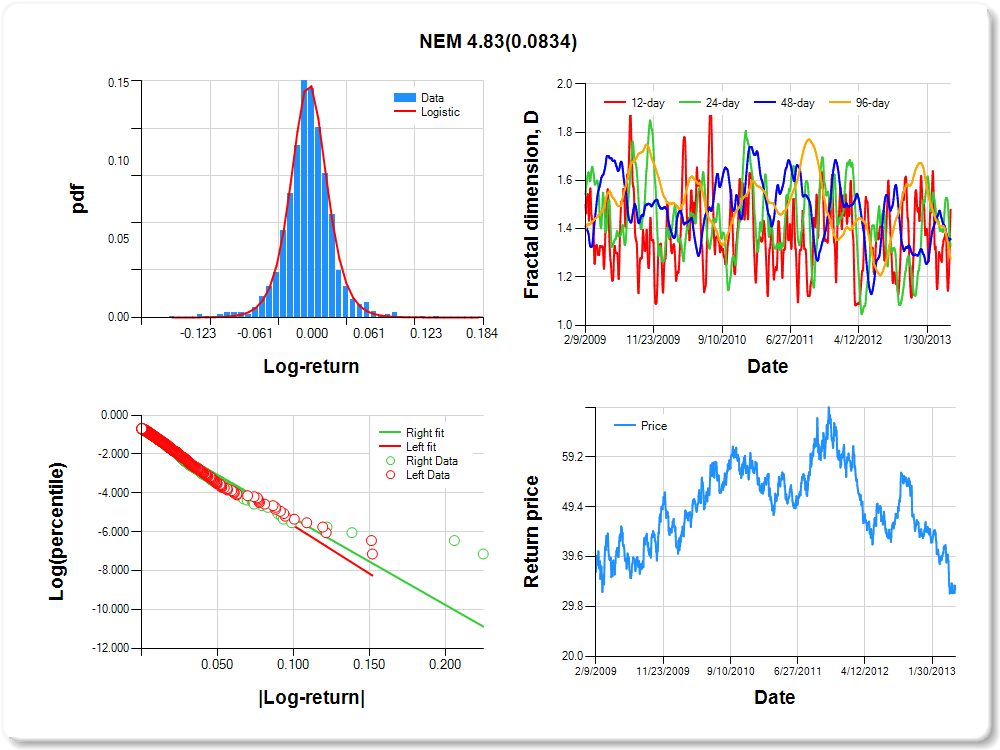
NEM
Percentile values of daily loss(gain) in per cent
| 0.5 | 1 | 5 | 10 | 25 | 50 | 75 | 90 | 95 | 99 | 99.5 |
| -0.10 |
-0.08 |
-0.04 |
-0.03 |
-0.01 |
0.00 |
0.01 |
0.04 |
0.08 |
0.10 |
0.32 |
Daily log-return distribution fitting results
| Distribution | Location, a | Scale, b |
| Logistic |
-0.334 |
0.114 |
Linear regression results [Model: y=log(percentile of log-return), x=|log-return|]
| Variable | Coef(b) | s.e.(b) | t-value | P-value |
| Constant |
-0.736 |
0.055 |
-13.278 |
0.0000 |
|log-return| |
-49.472 |
2.028 |
-24.392 |
0.0000 |
I(right-tail) |
-0.106 |
0.078 |
-1.357 |
0.1750 |
|log-return|*I(right-tail) |
4.830 |
2.787 |
1.733 |
0.0834 |
Hurst exponent (of daily return price)
| 12-day | 24-day | 48-day | 96-day |
| 0.521 |
0.671 |
0.644 |
0.725 |
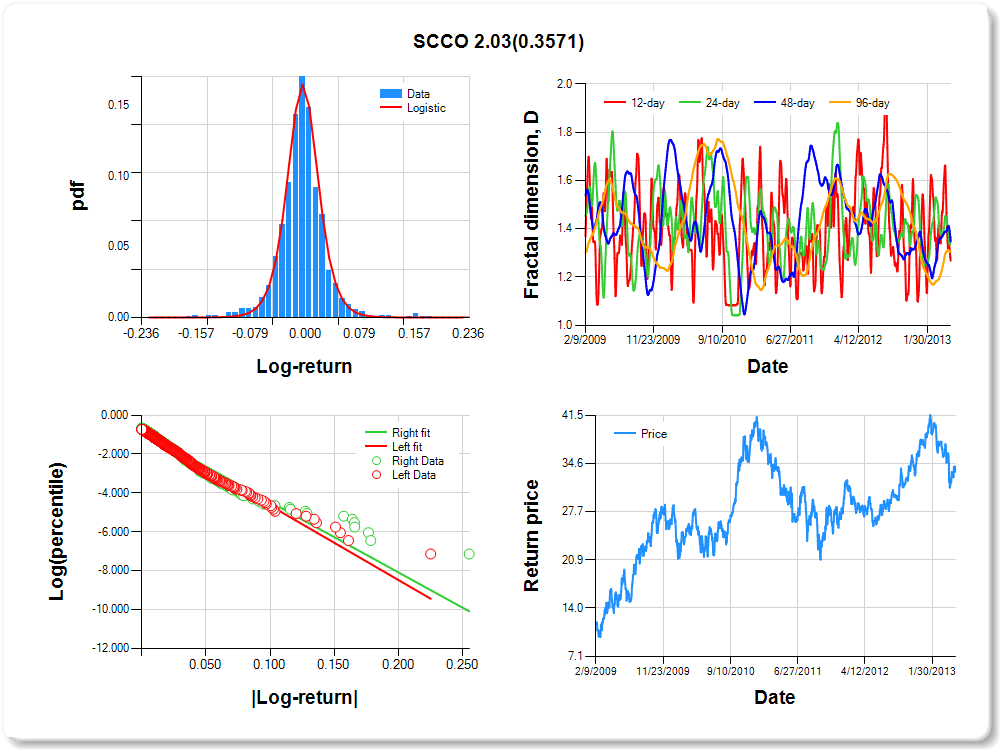
SCCO
Percentile values of daily loss(gain) in per cent
| 0.5 | 1 | 5 | 10 | 25 | 50 | 75 | 90 | 95 | 99 | 99.5 |
| -0.13 |
-0.09 |
-0.05 |
-0.04 |
-0.02 |
0.00 |
0.02 |
0.05 |
0.10 |
0.17 |
0.31 |
Daily log-return distribution fitting results
| Distribution | Location, a | Scale, b |
| Logistic |
-0.101 |
0.104 |
Linear regression results [Model: y=log(percentile of log-return), x=|log-return|]
| Variable | Coef(b) | s.e.(b) | t-value | P-value |
| Constant |
-0.810 |
0.056 |
-14.554 |
0.0000 |
|log-return| |
-38.284 |
1.605 |
-23.849 |
0.0000 |
I(right-tail) |
-0.014 |
0.077 |
-0.181 |
0.8561 |
|log-return|*I(right-tail) |
2.026 |
2.199 |
0.921 |
0.3571 |
Hurst exponent (of daily return price)
| 12-day | 24-day | 48-day | 96-day |
| 0.732 |
0.635 |
0.652 |
0.695 |
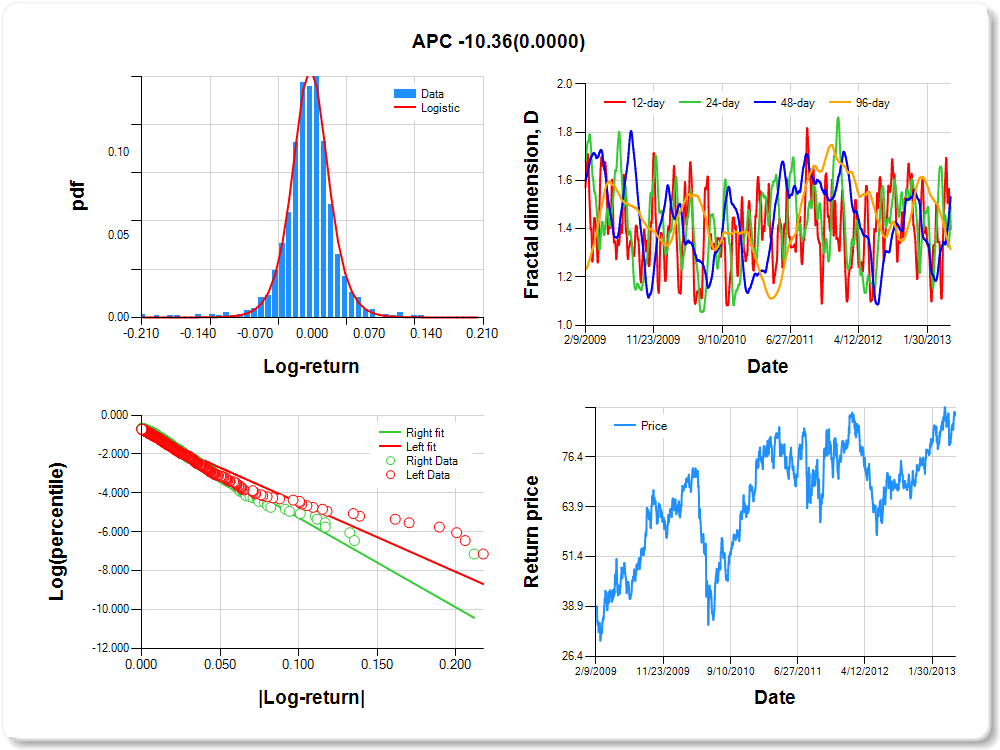
APC
Percentile values of daily loss(gain) in per cent
| 0.5 | 1 | 5 | 10 | 25 | 50 | 75 | 90 | 95 | 99 | 99.5 |
| -0.15 |
-0.10 |
-0.04 |
-0.03 |
-0.01 |
0.00 |
0.02 |
0.05 |
0.08 |
0.12 |
0.12 |
Daily log-return distribution fitting results
| Distribution | Location, a | Scale, b |
| Logistic |
0.036 |
0.113 |
Linear regression results [Model: y=log(percentile of log-return), x=|log-return|]
| Variable | Coef(b) | s.e.(b) | t-value | P-value |
| Constant |
-0.919 |
0.053 |
-17.375 |
0.0000 |
|log-return| |
-35.686 |
1.531 |
-23.303 |
0.0000 |
I(right-tail) |
0.247 |
0.077 |
3.186 |
0.0015 |
|log-return|*I(right-tail) |
-10.359 |
2.425 |
-4.271 |
0.0000 |
Hurst exponent (of daily return price)
| 12-day | 24-day | 48-day | 96-day |
| 0.602 |
0.509 |
0.468 |
0.685 |
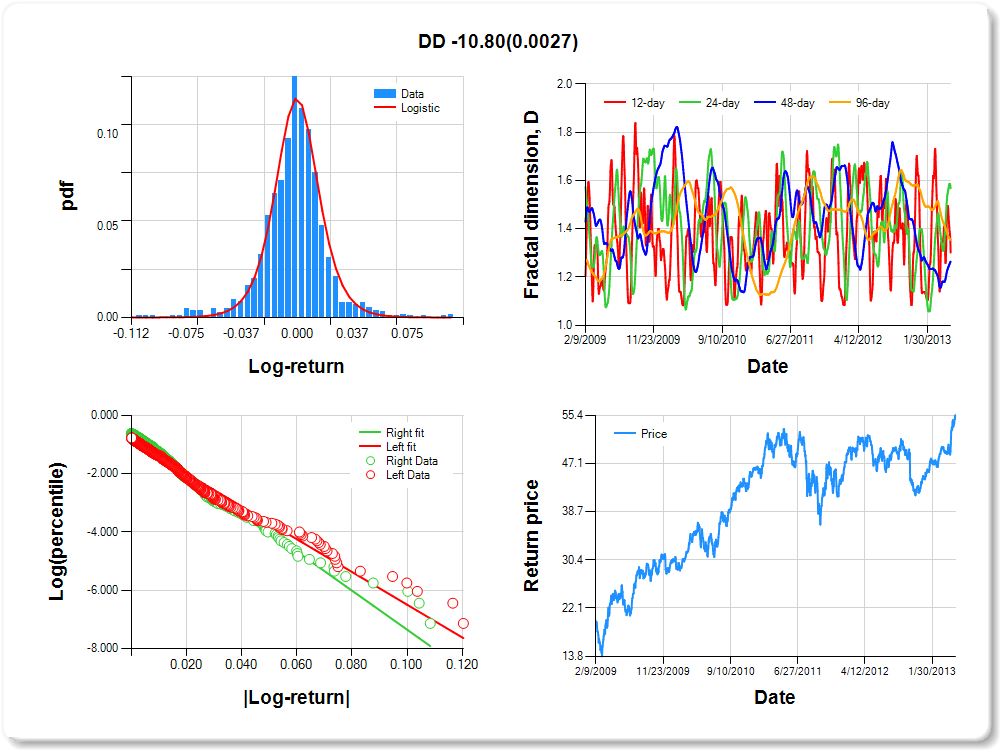
DD
Percentile values of daily loss(gain) in per cent
| 0.5 | 1 | 5 | 10 | 25 | 50 | 75 | 90 | 95 | 99 | 99.5 |
| -0.08 |
-0.07 |
-0.03 |
-0.02 |
-0.01 |
0.00 |
0.01 |
0.03 |
0.06 |
0.08 |
0.58 |
Daily log-return distribution fitting results
| Distribution | Location, a | Scale, b |
| Logistic |
0.119 |
0.143 |
Linear regression results [Model: y=log(percentile of log-return), x=|log-return|]
| Variable | Coef(b) | s.e.(b) | t-value | P-value |
| Constant |
-0.871 |
0.057 |
-15.328 |
0.0000 |
|log-return| |
-56.166 |
2.414 |
-23.265 |
0.0000 |
I(right-tail) |
0.226 |
0.079 |
2.867 |
0.0042 |
|log-return|*I(right-tail) |
-10.798 |
3.588 |
-3.009 |
0.0027 |
Hurst exponent (of daily return price)
| 12-day | 24-day | 48-day | 96-day |
| 0.698 |
0.432 |
0.736 |
0.646 |
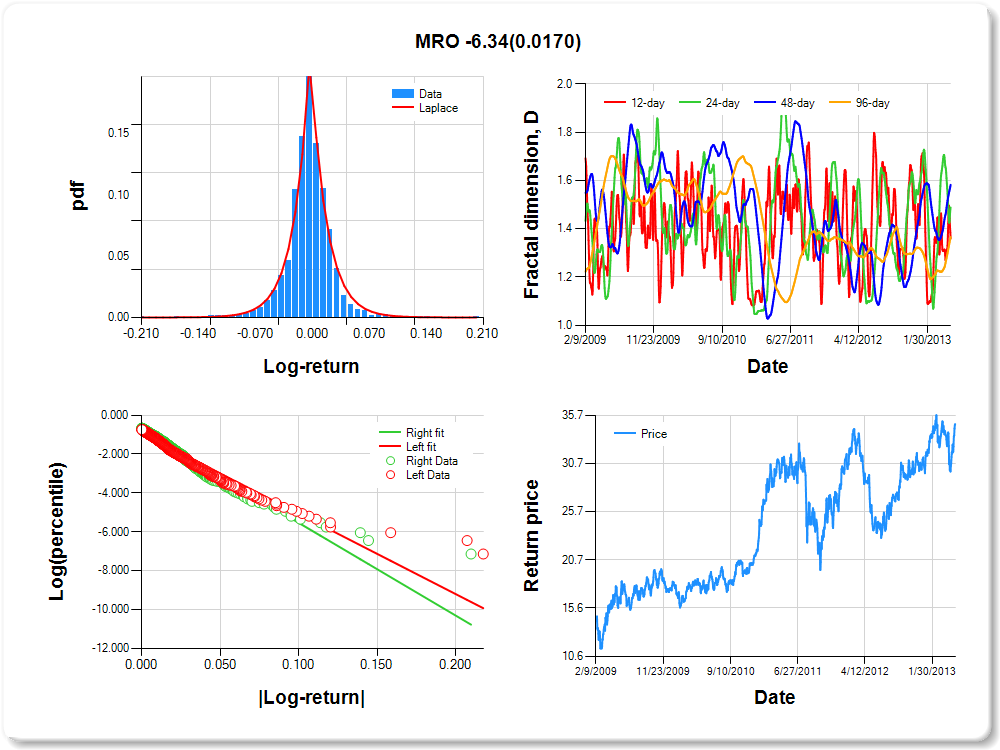
MRO
Percentile values of daily loss(gain) in per cent
| 0.5 | 1 | 5 | 10 | 25 | 50 | 75 | 90 | 95 | 99 | 99.5 |
| -0.11 |
-0.08 |
-0.04 |
-0.03 |
-0.01 |
0.00 |
0.01 |
0.04 |
0.08 |
0.10 |
0.89 |
Daily log-return distribution fitting results
| Distribution | Location, a | Scale, b |
| Laplace |
0.042 |
0.158 |
Linear regression results [Model: y=log(percentile of log-return), x=|log-return|]
| Variable | Coef(b) | s.e.(b) | t-value | P-value |
| Constant |
-0.920 |
0.054 |
-17.075 |
0.0000 |
|log-return| |
-41.338 |
1.782 |
-23.198 |
0.0000 |
I(right-tail) |
0.163 |
0.076 |
2.130 |
0.0334 |
|log-return|*I(right-tail) |
-6.336 |
2.652 |
-2.389 |
0.0170 |
Hurst exponent (of daily return price)
| 12-day | 24-day | 48-day | 96-day |
| 0.640 |
0.511 |
0.417 |
0.634 |
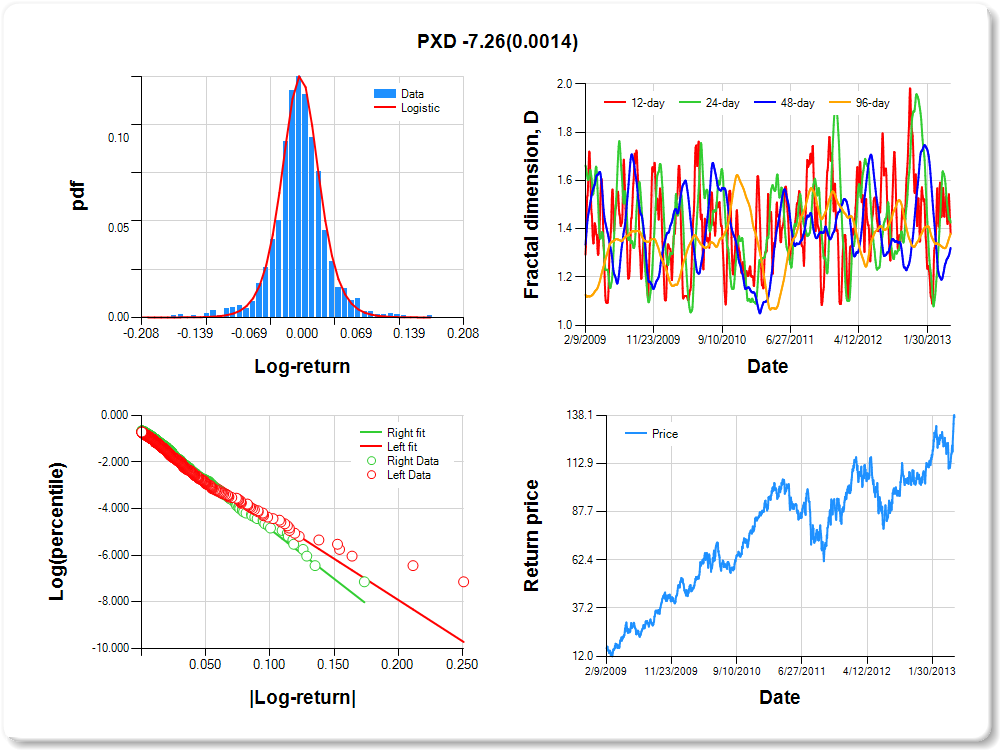
PXD
Percentile values of daily loss(gain) in per cent
| 0.5 | 1 | 5 | 10 | 25 | 50 | 75 | 90 | 95 | 99 | 99.5 |
| -0.13 |
-0.10 |
-0.05 |
-0.03 |
-0.02 |
0.00 |
0.02 |
0.06 |
0.10 |
0.12 |
1.72 |
Daily log-return distribution fitting results
| Distribution | Location, a | Scale, b |
| Logistic |
0.321 |
0.127 |
Linear regression results [Model: y=log(percentile of log-return), x=|log-return|]
| Variable | Coef(b) | s.e.(b) | t-value | P-value |
| Constant |
-0.854 |
0.054 |
-15.740 |
0.0000 |
|log-return| |
-35.305 |
1.487 |
-23.745 |
0.0000 |
I(right-tail) |
0.229 |
0.079 |
2.894 |
0.0039 |
|log-return|*I(right-tail) |
-7.261 |
2.272 |
-3.195 |
0.0014 |
Hurst exponent (of daily return price)
| 12-day | 24-day | 48-day | 96-day |
| 0.621 |
0.574 |
0.679 |
0.620 |
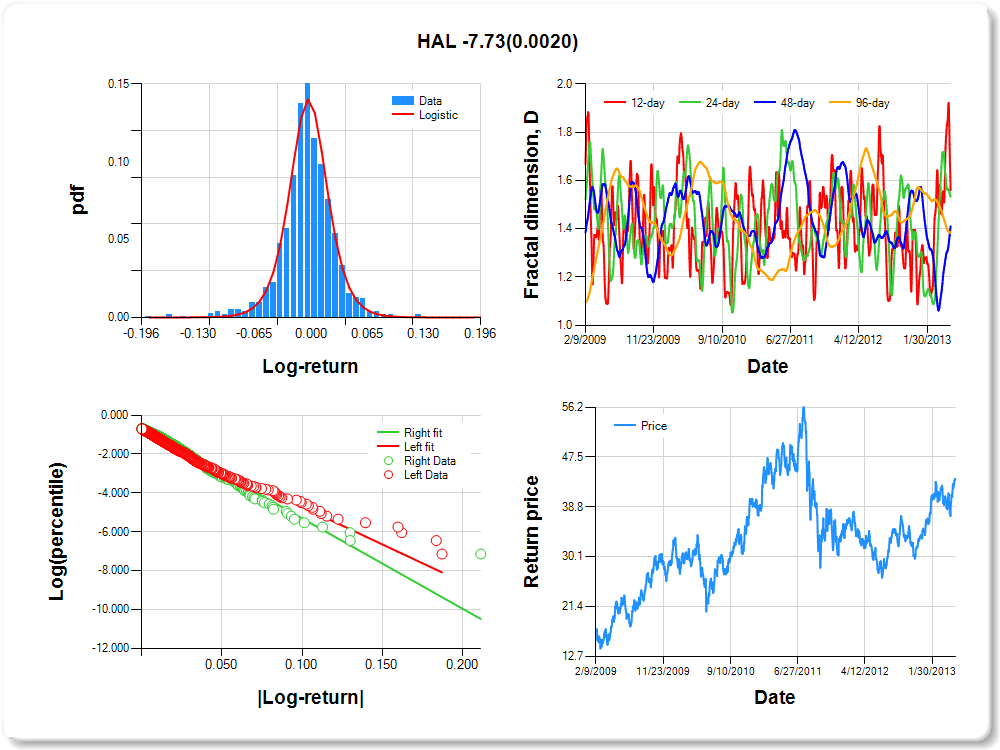
HAL
Percentile values of daily loss(gain) in per cent
| 0.5 | 1 | 5 | 10 | 25 | 50 | 75 | 90 | 95 | 99 | 99.5 |
| -0.12 |
-0.10 |
-0.05 |
-0.03 |
-0.01 |
0.00 |
0.02 |
0.05 |
0.08 |
0.10 |
0.88 |
Daily log-return distribution fitting results
| Distribution | Location, a | Scale, b |
| Logistic |
-0.097 |
0.122 |
Linear regression results [Model: y=log(percentile of log-return), x=|log-return|]
| Variable | Coef(b) | s.e.(b) | t-value | P-value |
| Constant |
-0.833 |
0.054 |
-15.449 |
0.0000 |
|log-return| |
-38.682 |
1.606 |
-24.087 |
0.0000 |
I(right-tail) |
0.177 |
0.079 |
2.232 |
0.0258 |
|log-return|*I(right-tail) |
-7.734 |
2.497 |
-3.097 |
0.0020 |
Hurst exponent (of daily return price)
| 12-day | 24-day | 48-day | 96-day |
| 0.440 |
0.467 |
0.589 |
0.613 |
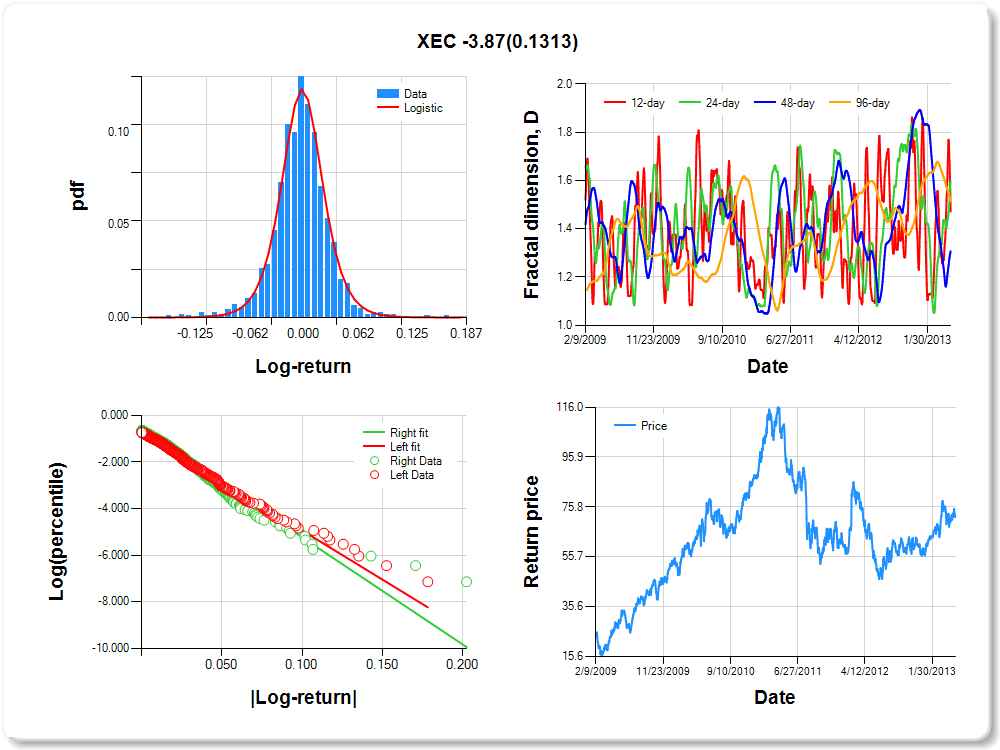
XEC
Percentile values of daily loss(gain) in per cent
| 0.5 | 1 | 5 | 10 | 25 | 50 | 75 | 90 | 95 | 99 | 99.5 |
| -0.11 |
-0.09 |
-0.05 |
-0.03 |
-0.02 |
0.00 |
0.02 |
0.05 |
0.08 |
0.11 |
1.71 |
Daily log-return distribution fitting results
| Distribution | Location, a | Scale, b |
| Logistic |
-0.096 |
0.139 |
Linear regression results [Model: y=log(percentile of log-return), x=|log-return|]
| Variable | Coef(b) | s.e.(b) | t-value | P-value |
| Constant |
-0.737 |
0.058 |
-12.612 |
0.0000 |
|log-return| |
-42.006 |
1.761 |
-23.857 |
0.0000 |
I(right-tail) |
0.097 |
0.081 |
1.189 |
0.2347 |
|log-return|*I(right-tail) |
-3.874 |
2.565 |
-1.510 |
0.1313 |
Hurst exponent (of daily return price)
| 12-day | 24-day | 48-day | 96-day |
| 0.528 |
0.401 |
0.693 |
0.487 |
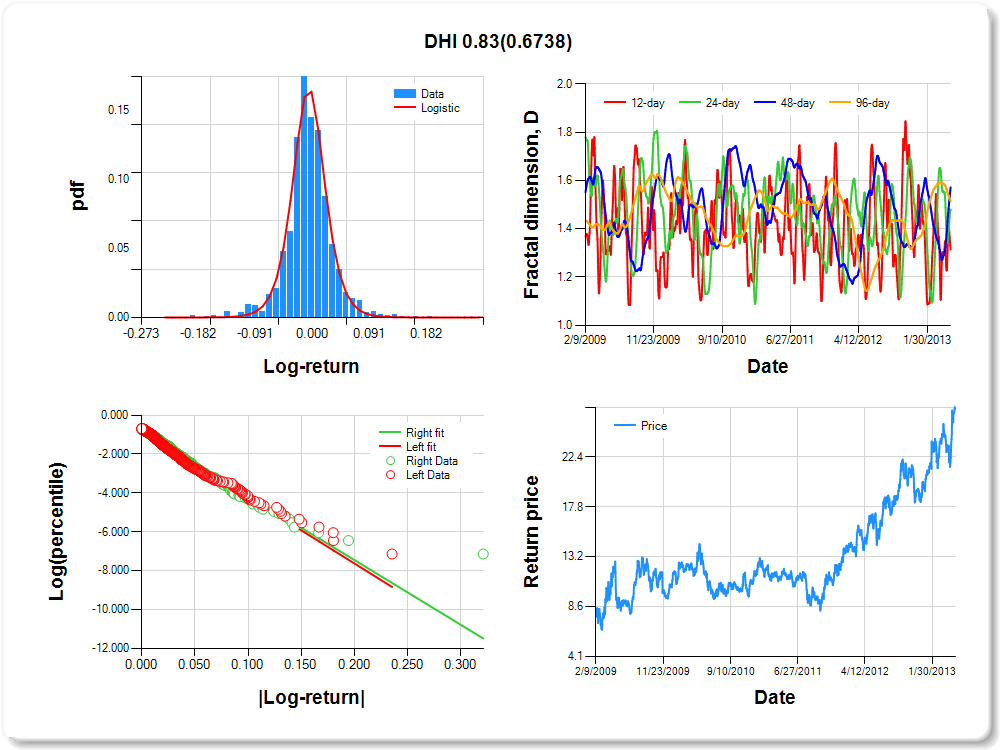
DHI
Percentile values of daily loss(gain) in per cent
| 0.5 | 1 | 5 | 10 | 25 | 50 | 75 | 90 | 95 | 99 | 99.5 |
| -0.14 |
-0.11 |
-0.06 |
-0.04 |
-0.02 |
0.00 |
0.02 |
0.06 |
0.11 |
0.15 |
1.12 |
Daily log-return distribution fitting results
| Distribution | Location, a | Scale, b |
| Logistic |
-0.267 |
0.103 |
Linear regression results [Model: y=log(percentile of log-return), x=|log-return|]
| Variable | Coef(b) | s.e.(b) | t-value | P-value |
| Constant |
-0.789 |
0.054 |
-14.543 |
0.0000 |
|log-return| |
-34.100 |
1.403 |
-24.300 |
0.0000 |
I(right-tail) |
0.009 |
0.078 |
0.117 |
0.9065 |
|log-return|*I(right-tail) |
0.835 |
1.983 |
0.421 |
0.6738 |
Hurst exponent (of daily return price)
| 12-day | 24-day | 48-day | 96-day |
| 0.686 |
0.523 |
0.428 |
0.486 |
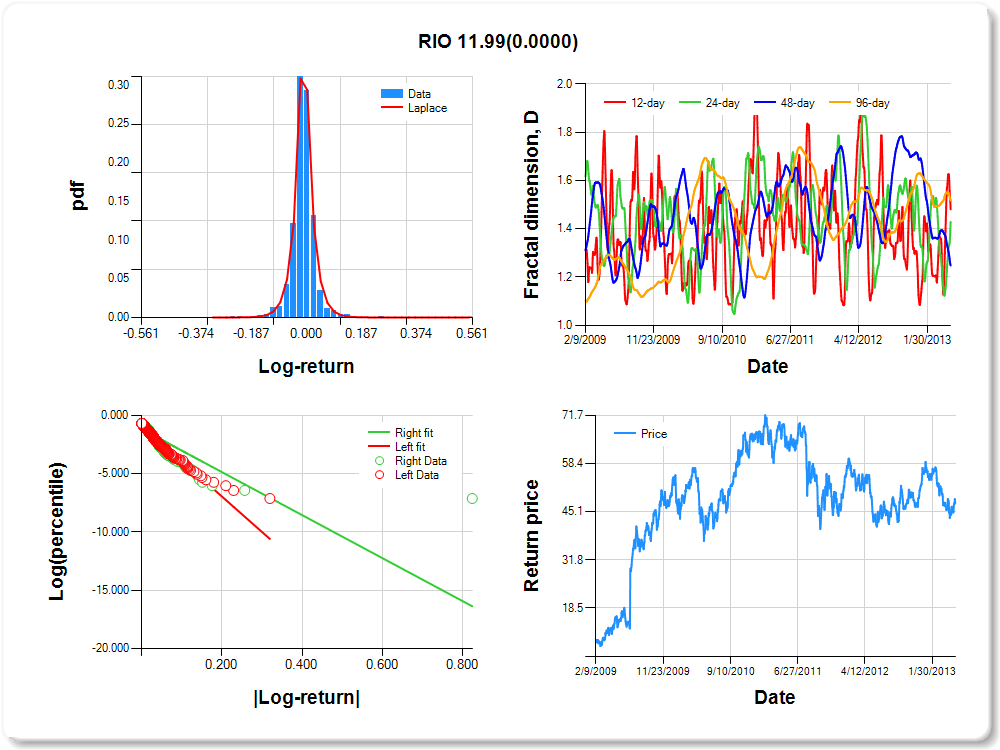
RIO
Percentile values of daily loss(gain) in per cent
| 0.5 | 1 | 5 | 10 | 25 | 50 | 75 | 90 | 95 | 99 | 99.5 |
| -0.14 |
-0.11 |
-0.06 |
-0.04 |
-0.02 |
0.00 |
0.02 |
0.06 |
0.12 |
0.15 |
1.18 |
Daily log-return distribution fitting results
| Distribution | Location, a | Scale, b |
| Laplace |
-0.756 |
0.075 |
Linear regression results [Model: y=log(percentile of log-return), x=|log-return|]
| Variable | Coef(b) | s.e.(b) | t-value | P-value |
| Constant |
-0.888 |
0.053 |
-16.917 |
0.0000 |
|log-return| |
-30.418 |
1.278 |
-23.803 |
0.0000 |
I(right-tail) |
-0.306 |
0.071 |
-4.321 |
0.0000 |
|log-return|*I(right-tail) |
11.994 |
1.595 |
7.521 |
0.0000 |
Hurst exponent (of daily return price)
| 12-day | 24-day | 48-day | 96-day |
| 0.519 |
0.571 |
0.752 |
0.483 |
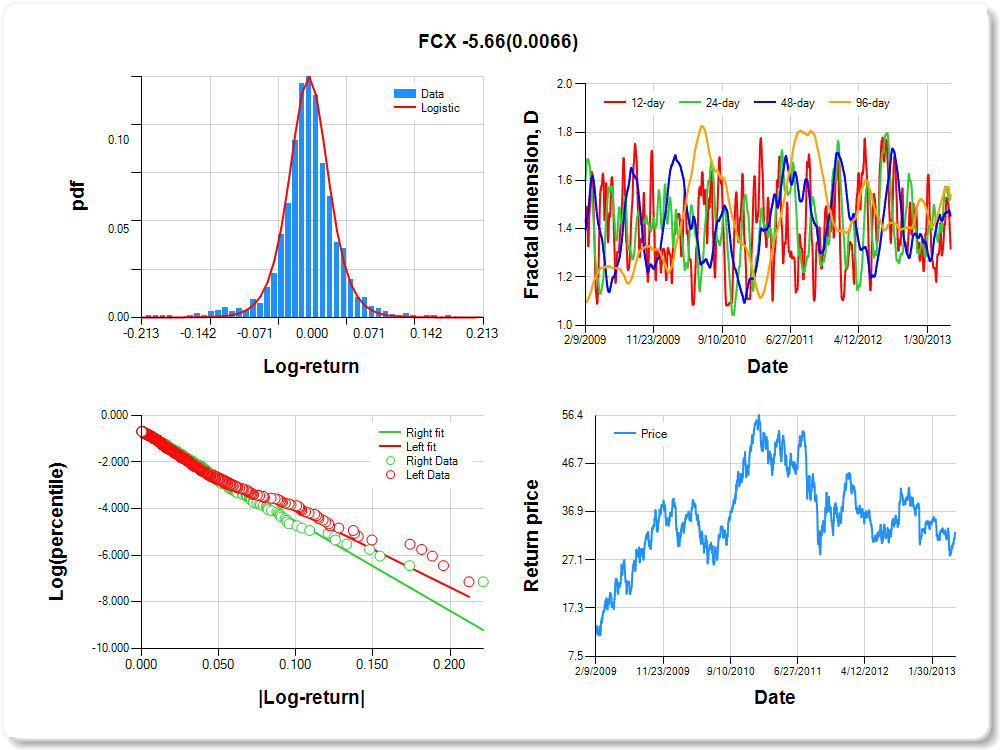
FCX
Percentile values of daily loss(gain) in per cent
| 0.5 | 1 | 5 | 10 | 25 | 50 | 75 | 90 | 95 | 99 | 99.5 |
| -0.14 |
-0.11 |
-0.06 |
-0.04 |
-0.02 |
0.00 |
0.02 |
0.06 |
0.10 |
0.13 |
0.69 |
Daily log-return distribution fitting results
| Distribution | Location, a | Scale, b |
| Logistic |
-0.038 |
0.126 |
Linear regression results [Model: y=log(percentile of log-return), x=|log-return|]
| Variable | Coef(b) | s.e.(b) | t-value | P-value |
| Constant |
-0.841 |
0.054 |
-15.717 |
0.0000 |
|log-return| |
-32.671 |
1.357 |
-24.083 |
0.0000 |
I(right-tail) |
0.126 |
0.078 |
1.624 |
0.1047 |
|log-return|*I(right-tail) |
-5.655 |
2.078 |
-2.722 |
0.0066 |
Hurst exponent (of daily return price)
| 12-day | 24-day | 48-day | 96-day |
| 0.682 |
0.460 |
0.546 |
0.475 |
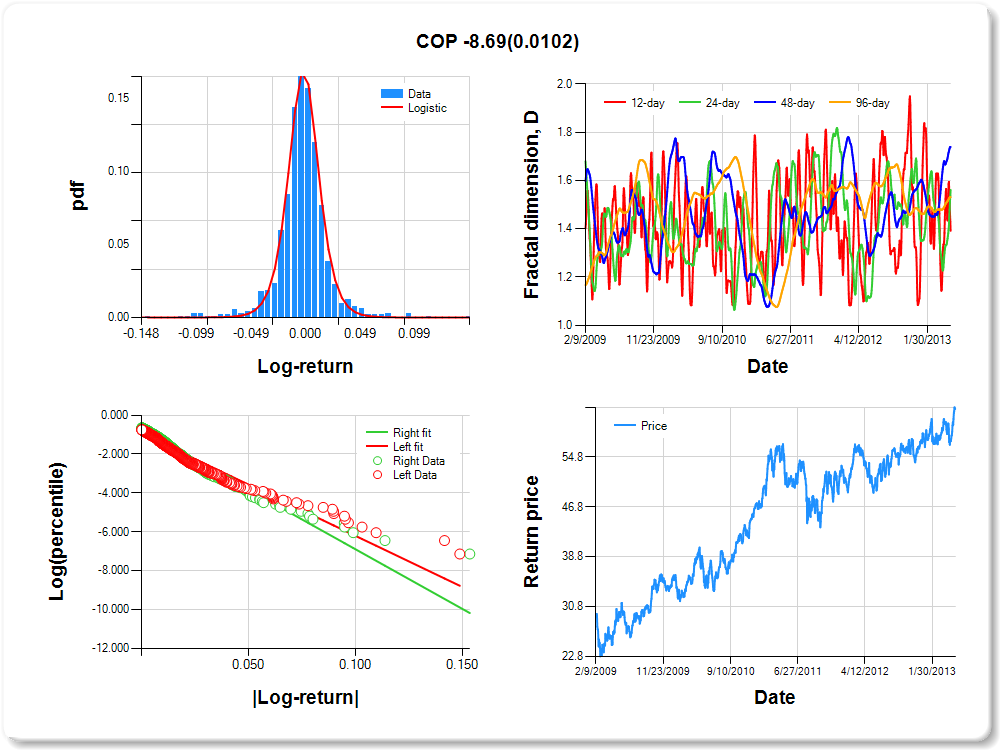
COP
Percentile values of daily loss(gain) in per cent
| 0.5 | 1 | 5 | 10 | 25 | 50 | 75 | 90 | 95 | 99 | 99.5 |
| -0.09 |
-0.07 |
-0.03 |
-0.02 |
-0.01 |
0.00 |
0.01 |
0.03 |
0.06 |
0.08 |
0.00 |
Daily log-return distribution fitting results
| Distribution | Location, a | Scale, b |
| Logistic |
-0.015 |
0.101 |
Linear regression results [Model: y=log(percentile of log-return), x=|log-return|]
| Variable | Coef(b) | s.e.(b) | t-value | P-value |
| Constant |
-0.937 |
0.054 |
-17.423 |
0.0000 |
|log-return| |
-52.632 |
2.267 |
-23.214 |
0.0000 |
I(right-tail) |
0.180 |
0.076 |
2.374 |
0.0177 |
|log-return|*I(right-tail) |
-8.687 |
3.376 |
-2.574 |
0.0102 |
Hurst exponent (of daily return price)
| 12-day | 24-day | 48-day | 96-day |
| 0.608 |
0.439 |
0.261 |
0.469 |
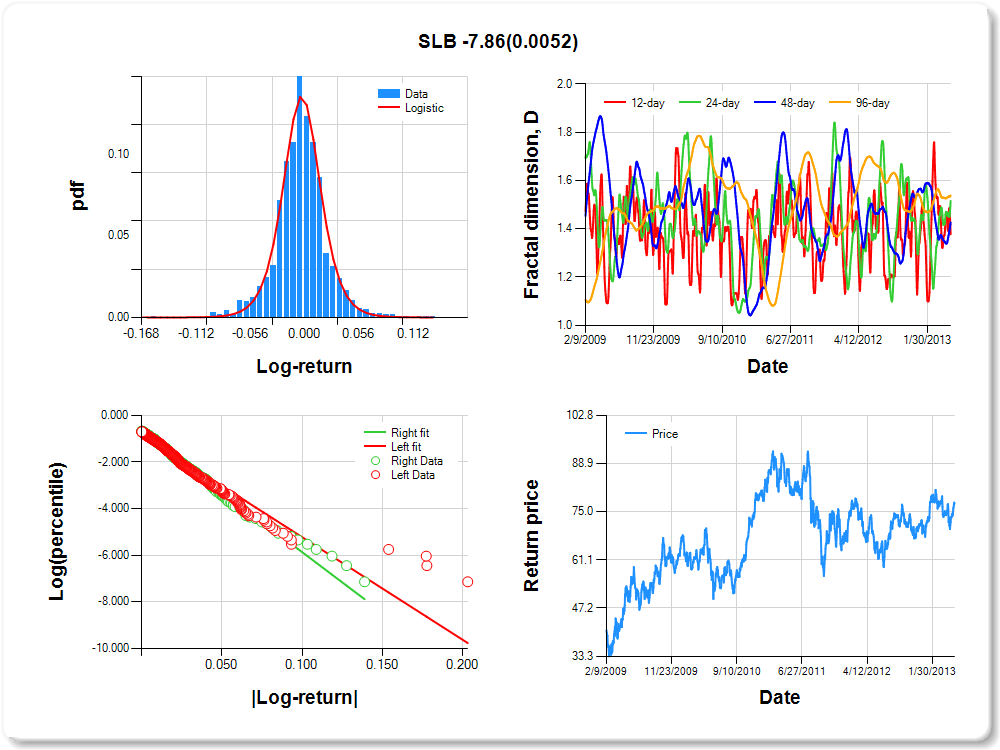
SLB
Percentile values of daily loss(gain) in per cent
| 0.5 | 1 | 5 | 10 | 25 | 50 | 75 | 90 | 95 | 99 | 99.5 |
| -0.09 |
-0.08 |
-0.04 |
-0.03 |
-0.01 |
0.00 |
0.01 |
0.04 |
0.08 |
0.10 |
0.73 |
Daily log-return distribution fitting results
| Distribution | Location, a | Scale, b |
| Logistic |
0.325 |
0.127 |
Linear regression results [Model: y=log(percentile of log-return), x=|log-return|]
| Variable | Coef(b) | s.e.(b) | t-value | P-value |
| Constant |
-0.829 |
0.055 |
-15.173 |
0.0000 |
|log-return| |
-43.939 |
1.860 |
-23.628 |
0.0000 |
I(right-tail) |
0.144 |
0.079 |
1.829 |
0.0676 |
|log-return|*I(right-tail) |
-7.856 |
2.809 |
-2.797 |
0.0052 |
Hurst exponent (of daily return price)
| 12-day | 24-day | 48-day | 96-day |
| 0.622 |
0.484 |
0.574 |
0.462 |
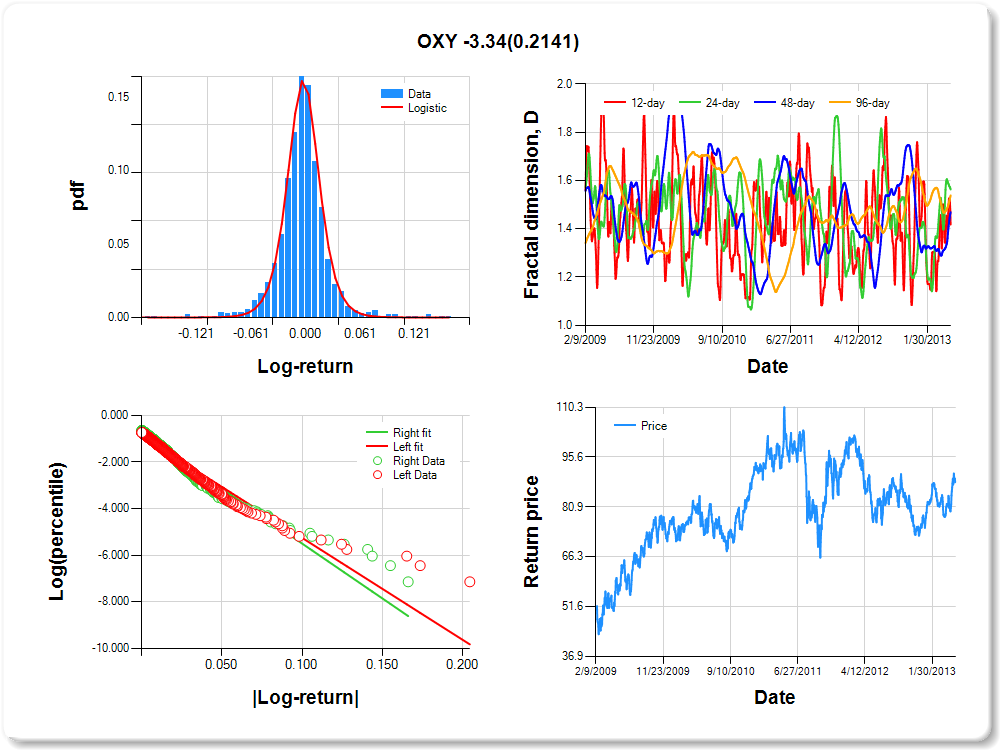
OXY
Percentile values of daily loss(gain) in per cent
| 0.5 | 1 | 5 | 10 | 25 | 50 | 75 | 90 | 95 | 99 | 99.5 |
| -0.11 |
-0.08 |
-0.04 |
-0.03 |
-0.01 |
0.00 |
0.01 |
0.04 |
0.08 |
0.11 |
0.00 |
Daily log-return distribution fitting results
| Distribution | Location, a | Scale, b |
| Logistic |
0.187 |
0.106 |
Linear regression results [Model: y=log(percentile of log-return), x=|log-return|]
| Variable | Coef(b) | s.e.(b) | t-value | P-value |
| Constant |
-0.891 |
0.054 |
-16.355 |
0.0000 |
|log-return| |
-43.651 |
1.871 |
-23.328 |
0.0000 |
I(right-tail) |
0.090 |
0.076 |
1.198 |
0.2313 |
|log-return|*I(right-tail) |
-3.338 |
2.685 |
-1.243 |
0.2141 |
Hurst exponent (of daily return price)
| 12-day | 24-day | 48-day | 96-day |
| 0.582 |
0.437 |
0.531 |
0.461 |
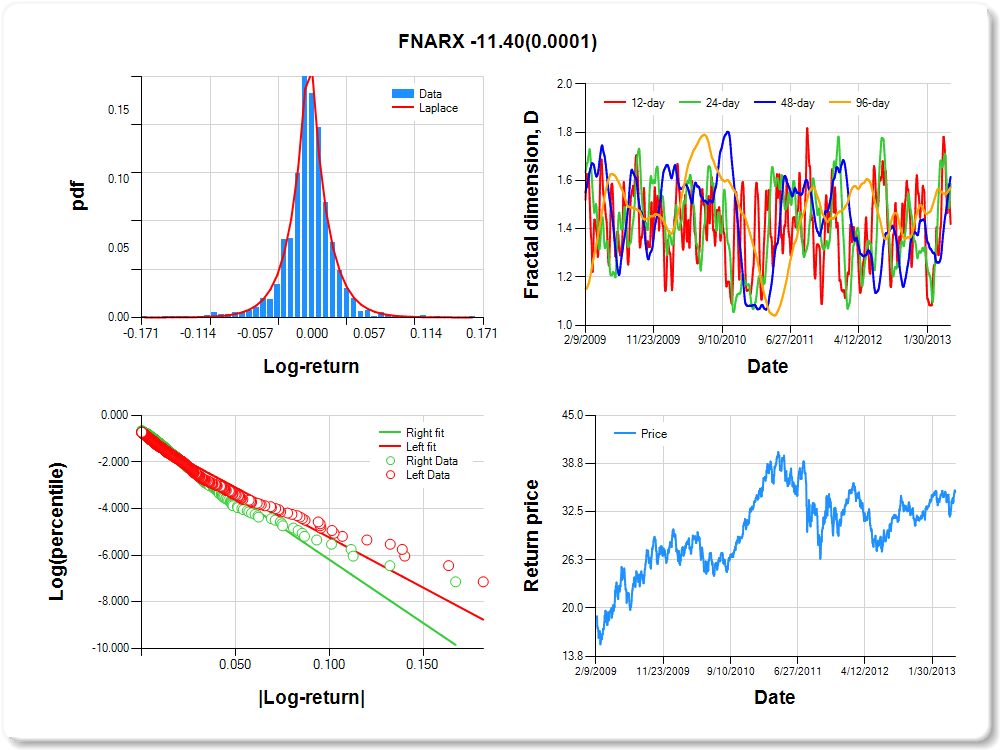
FNARX
Percentile values of daily loss(gain) in per cent
| 0.5 | 1 | 5 | 10 | 25 | 50 | 75 | 90 | 95 | 99 | 99.5 |
| -0.11 |
-0.09 |
-0.04 |
-0.03 |
-0.01 |
0.00 |
0.01 |
0.04 |
0.07 |
0.09 |
0.88 |
Daily log-return distribution fitting results
| Distribution | Location, a | Scale, b |
| Laplace |
0.075 |
0.163 |
Linear regression results [Model: y=log(percentile of log-return), x=|log-return|]
| Variable | Coef(b) | s.e.(b) | t-value | P-value |
| Constant |
-0.945 |
0.052 |
-18.045 |
0.0000 |
|log-return| |
-42.877 |
1.823 |
-23.520 |
0.0000 |
I(right-tail) |
0.196 |
0.076 |
2.584 |
0.0099 |
|log-return|*I(right-tail) |
-11.396 |
2.881 |
-3.955 |
0.0001 |
Hurst exponent (of daily return price)
| 12-day | 24-day | 48-day | 96-day |
| 0.580 |
0.414 |
0.384 |
0.429 |
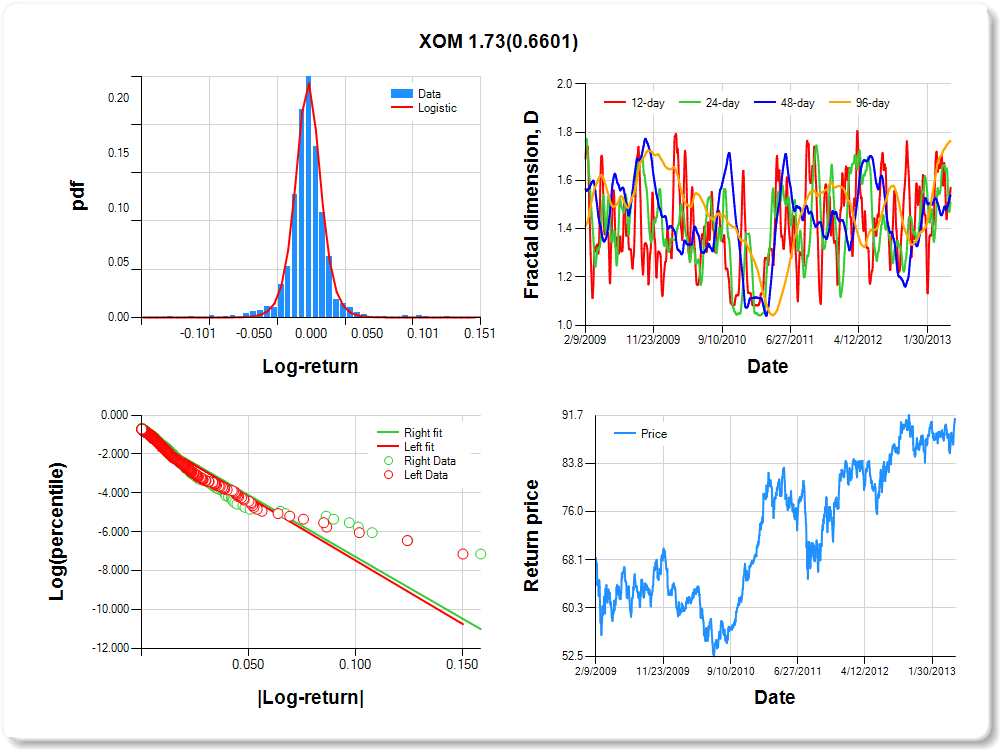
XOM
Percentile values of daily loss(gain) in per cent
| 0.5 | 1 | 5 | 10 | 25 | 50 | 75 | 90 | 95 | 99 | 99.5 |
| -0.07 |
-0.05 |
-0.02 |
-0.02 |
-0.01 |
0.00 |
0.01 |
0.02 |
0.04 |
0.09 |
1.40 |
Daily log-return distribution fitting results
| Distribution | Location, a | Scale, b |
| Logistic |
-0.043 |
0.080 |
Linear regression results [Model: y=log(percentile of log-return), x=|log-return|]
| Variable | Coef(b) | s.e.(b) | t-value | P-value |
| Constant |
-0.946 |
0.052 |
-18.208 |
0.0000 |
|log-return| |
-65.188 |
2.811 |
-23.188 |
0.0000 |
I(right-tail) |
0.014 |
0.073 |
0.190 |
0.8491 |
|log-return|*I(right-tail) |
1.731 |
3.934 |
0.440 |
0.6601 |
Hurst exponent (of daily return price)
| 12-day | 24-day | 48-day | 96-day |
| 0.429 |
0.491 |
0.462 |
0.236 |