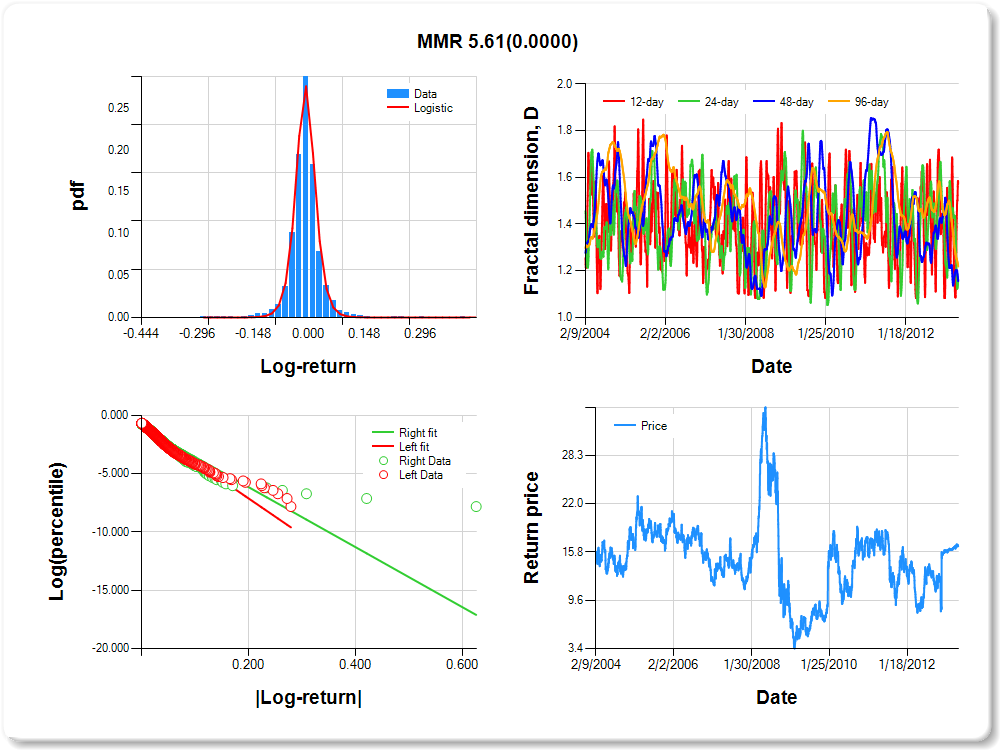
MMR
Percentile values of daily loss(gain) in per cent
| 0.5 | 1 | 5 | 10 | 25 | 50 | 75 | 90 | 95 | 99 | 99.5 |
| -0.13 |
-0.11 |
-0.06 |
-0.04 |
-0.02 |
0.00 |
0.02 |
0.06 |
0.12 |
0.13 |
0.47 |
Daily log-return distribution fitting results
| Distribution | Location, a | Scale, b |
| Logistic |
-0.658 |
0.062 |
Linear regression results [Model: y=log(percentile of log-return), x=|log-return|]
| Variable | Coef(b) | s.e.(b) | t-value | P-value |
| Constant |
-0.865 |
0.037 |
-23.359 |
0.0000 |
|log-return| |
-31.335 |
0.918 |
-34.118 |
0.0000 |
I(right-tail) |
-0.153 |
0.052 |
-2.931 |
0.0034 |
|log-return|*I(right-tail) |
5.611 |
1.236 |
4.539 |
0.0000 |
Hurst exponent (of daily return price)
| 12-day | 24-day | 48-day | 96-day |
| 0.428 |
0.836 |
0.844 |
0.782 |
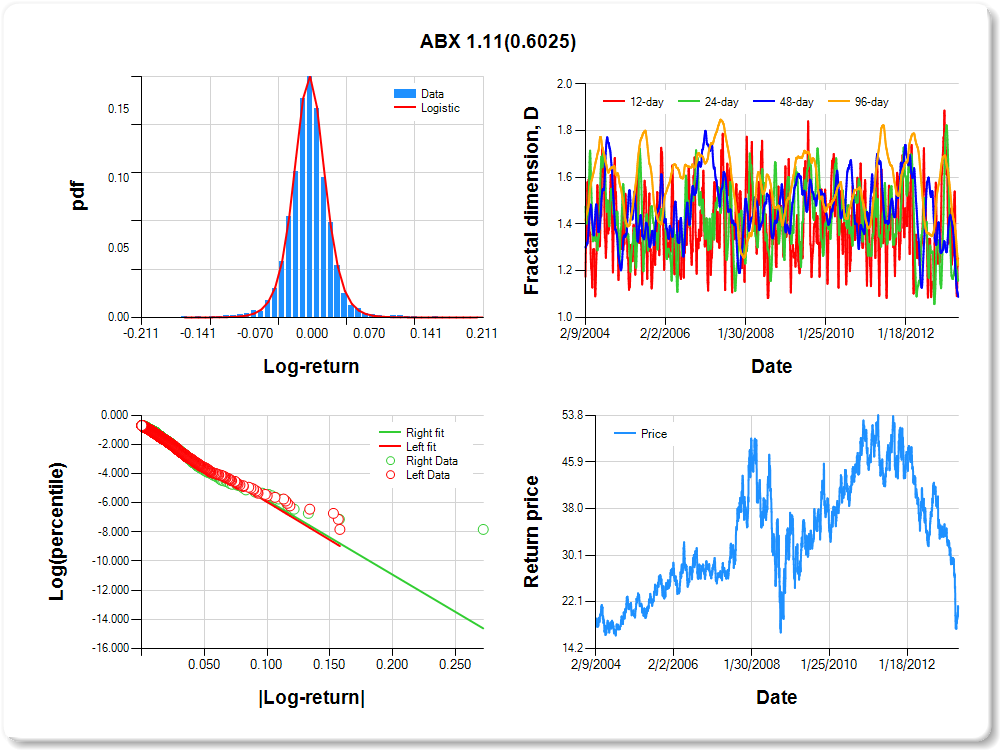
ABX
Percentile values of daily loss(gain) in per cent
| 0.5 | 1 | 5 | 10 | 25 | 50 | 75 | 90 | 95 | 99 | 99.5 |
| -0.09 |
-0.07 |
-0.04 |
-0.03 |
-0.01 |
0.00 |
0.01 |
0.04 |
0.07 |
0.09 |
0.75 |
Daily log-return distribution fitting results
| Distribution | Location, a | Scale, b |
| Logistic |
-0.452 |
0.099 |
Linear regression results [Model: y=log(percentile of log-return), x=|log-return|]
| Variable | Coef(b) | s.e.(b) | t-value | P-value |
| Constant |
-0.739 |
0.040 |
-18.513 |
0.0000 |
|log-return| |
-52.061 |
1.514 |
-34.394 |
0.0000 |
I(right-tail) |
0.002 |
0.056 |
0.034 |
0.9730 |
|log-return|*I(right-tail) |
1.112 |
2.136 |
0.521 |
0.6025 |
Hurst exponent (of daily return price)
| 12-day | 24-day | 48-day | 96-day |
| 0.748 |
0.841 |
0.912 |
0.777 |
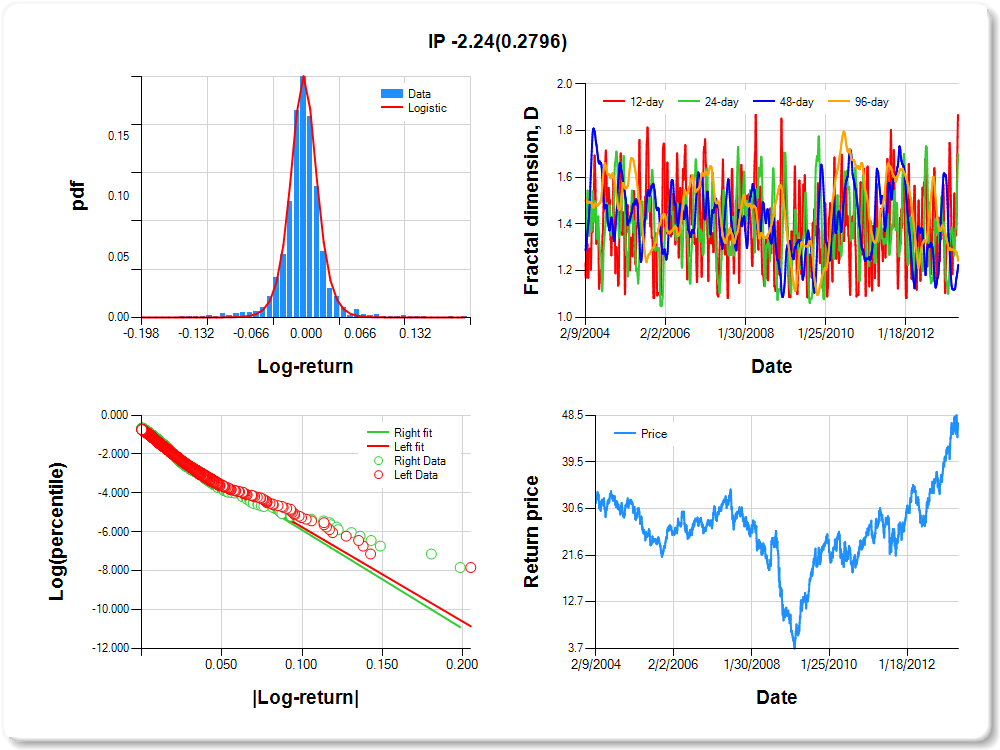
IP
Percentile values of daily loss(gain) in per cent
| 0.5 | 1 | 5 | 10 | 25 | 50 | 75 | 90 | 95 | 99 | 99.5 |
| -0.10 |
-0.08 |
-0.04 |
-0.02 |
-0.01 |
0.00 |
0.01 |
0.04 |
0.08 |
0.10 |
0.87 |
Daily log-return distribution fitting results
| Distribution | Location, a | Scale, b |
| Logistic |
0.036 |
0.086 |
Linear regression results [Model: y=log(percentile of log-return), x=|log-return|]
| Variable | Coef(b) | s.e.(b) | t-value | P-value |
| Constant |
-0.905 |
0.038 |
-23.725 |
0.0000 |
|log-return| |
-48.466 |
1.450 |
-33.428 |
0.0000 |
I(right-tail) |
0.078 |
0.053 |
1.466 |
0.1428 |
|log-return|*I(right-tail) |
-2.237 |
2.068 |
-1.081 |
0.2796 |
Hurst exponent (of daily return price)
| 12-day | 24-day | 48-day | 96-day |
| 0.155 |
0.299 |
0.774 |
0.758 |
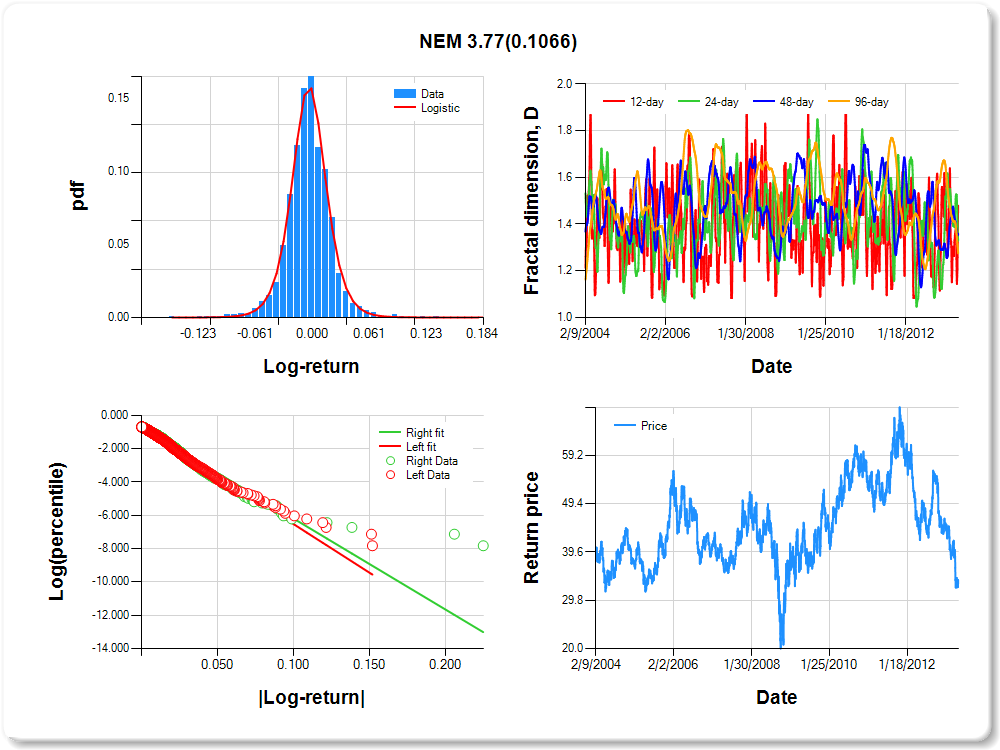
NEM
Percentile values of daily loss(gain) in per cent
| 0.5 | 1 | 5 | 10 | 25 | 50 | 75 | 90 | 95 | 99 | 99.5 |
| -0.08 |
-0.06 |
-0.04 |
-0.03 |
-0.01 |
0.00 |
0.01 |
0.04 |
0.07 |
0.08 |
0.26 |
Daily log-return distribution fitting results
| Distribution | Location, a | Scale, b |
| Logistic |
-0.333 |
0.108 |
Linear regression results [Model: y=log(percentile of log-return), x=|log-return|]
| Variable | Coef(b) | s.e.(b) | t-value | P-value |
| Constant |
-0.699 |
0.040 |
-17.321 |
0.0000 |
|log-return| |
-58.402 |
1.688 |
-34.599 |
0.0000 |
I(right-tail) |
-0.046 |
0.057 |
-0.809 |
0.4183 |
|log-return|*I(right-tail) |
3.773 |
2.337 |
1.614 |
0.1066 |
Hurst exponent (of daily return price)
| 12-day | 24-day | 48-day | 96-day |
| 0.521 |
0.671 |
0.644 |
0.725 |
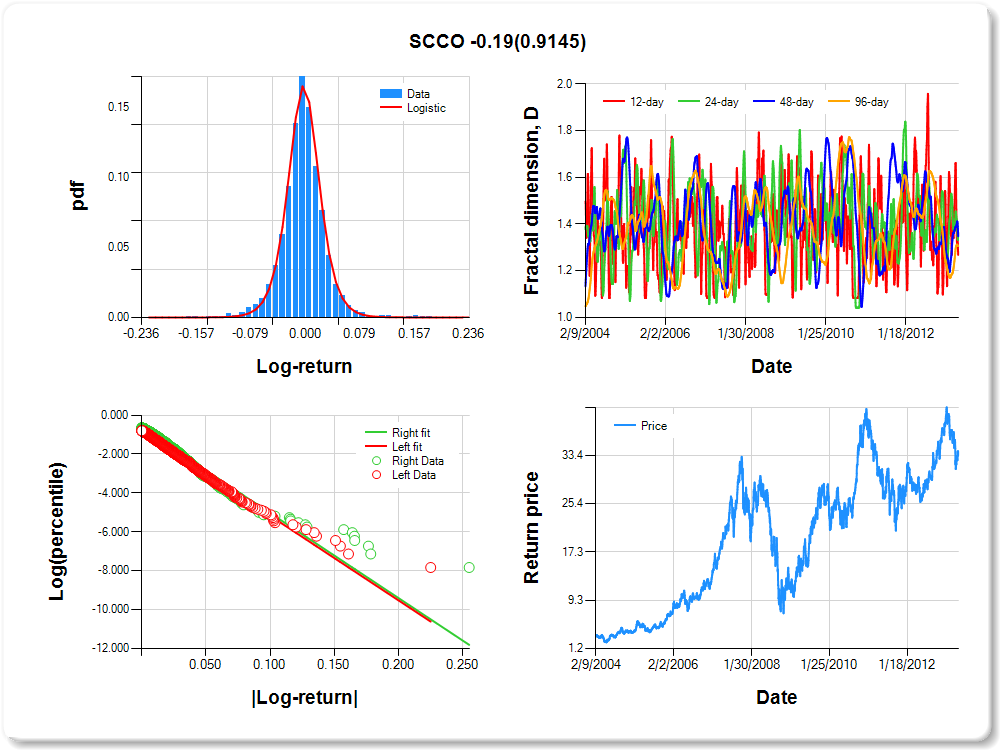
SCCO
Percentile values of daily loss(gain) in per cent
| 0.5 | 1 | 5 | 10 | 25 | 50 | 75 | 90 | 95 | 99 | 99.5 |
| -0.10 |
-0.08 |
-0.05 |
-0.03 |
-0.01 |
0.00 |
0.02 |
0.05 |
0.08 |
0.11 |
0.27 |
Daily log-return distribution fitting results
| Distribution | Location, a | Scale, b |
| Logistic |
-0.091 |
0.104 |
Linear regression results [Model: y=log(percentile of log-return), x=|log-return|]
| Variable | Coef(b) | s.e.(b) | t-value | P-value |
| Constant |
-0.811 |
0.042 |
-19.256 |
0.0000 |
|log-return| |
-43.486 |
1.319 |
-32.977 |
0.0000 |
I(right-tail) |
0.156 |
0.058 |
2.707 |
0.0068 |
|log-return|*I(right-tail) |
-0.195 |
1.814 |
-0.107 |
0.9145 |
Hurst exponent (of daily return price)
| 12-day | 24-day | 48-day | 96-day |
| 0.732 |
0.635 |
0.652 |
0.695 |
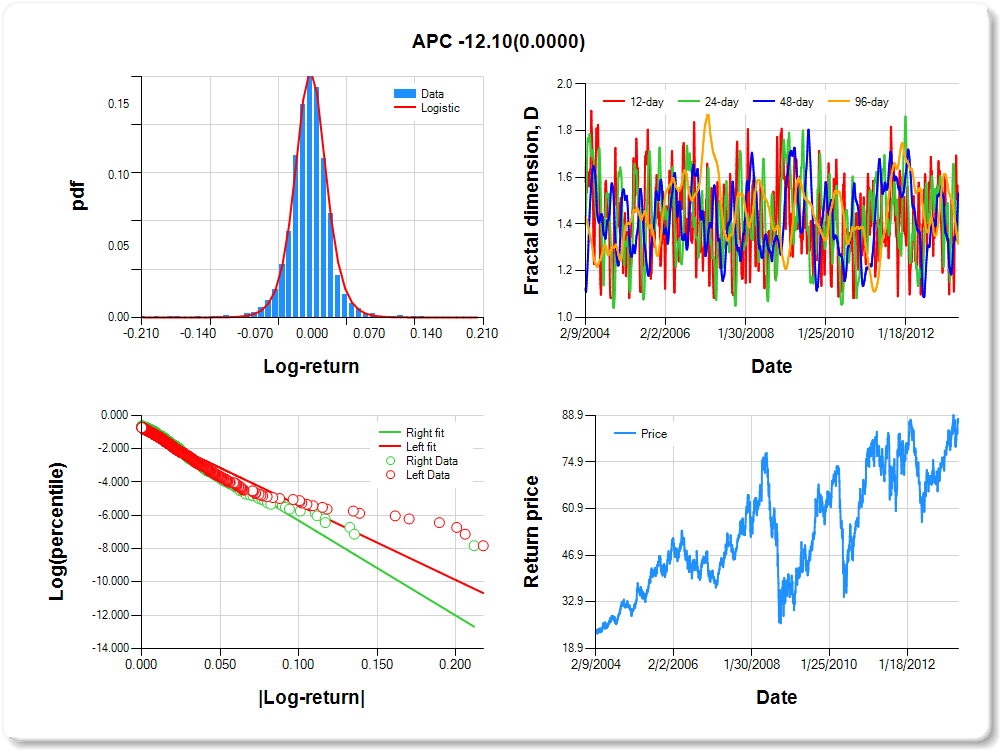
APC
Percentile values of daily loss(gain) in per cent
| 0.5 | 1 | 5 | 10 | 25 | 50 | 75 | 90 | 95 | 99 | 99.5 |
| -0.10 |
-0.07 |
-0.04 |
-0.03 |
-0.01 |
0.00 |
0.01 |
0.04 |
0.07 |
0.08 |
0.08 |
Daily log-return distribution fitting results
| Distribution | Location, a | Scale, b |
| Logistic |
0.038 |
0.098 |
Linear regression results [Model: y=log(percentile of log-return), x=|log-return|]
| Variable | Coef(b) | s.e.(b) | t-value | P-value |
| Constant |
-0.918 |
0.038 |
-23.886 |
0.0000 |
|log-return| |
-44.849 |
1.377 |
-32.573 |
0.0000 |
I(right-tail) |
0.288 |
0.055 |
5.188 |
0.0000 |
|log-return|*I(right-tail) |
-12.097 |
2.127 |
-5.688 |
0.0000 |
Hurst exponent (of daily return price)
| 12-day | 24-day | 48-day | 96-day |
| 0.602 |
0.509 |
0.468 |
0.685 |
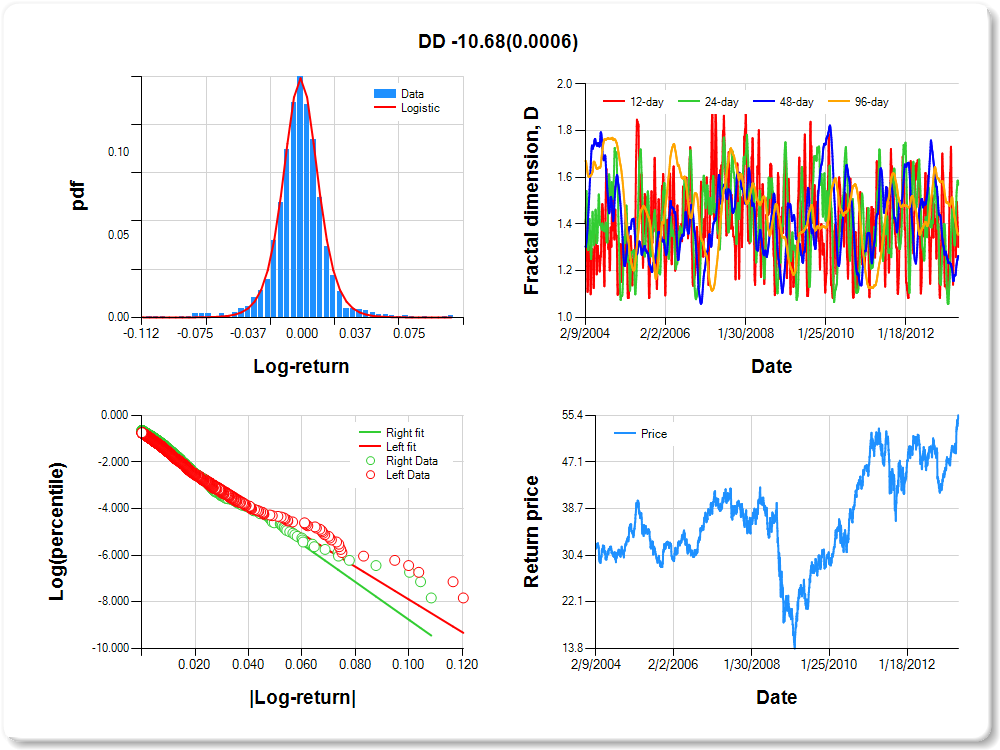
DD
Percentile values of daily loss(gain) in per cent
| 0.5 | 1 | 5 | 10 | 25 | 50 | 75 | 90 | 95 | 99 | 99.5 |
| -0.07 |
-0.06 |
-0.03 |
-0.02 |
-0.01 |
0.00 |
0.01 |
0.03 |
0.05 |
0.06 |
0.58 |
Daily log-return distribution fitting results
| Distribution | Location, a | Scale, b |
| Logistic |
0.103 |
0.118 |
Linear regression results [Model: y=log(percentile of log-return), x=|log-return|]
| Variable | Coef(b) | s.e.(b) | t-value | P-value |
| Constant |
-0.873 |
0.039 |
-22.368 |
0.0000 |
|log-return| |
-70.126 |
2.101 |
-33.385 |
0.0000 |
I(right-tail) |
0.202 |
0.055 |
3.648 |
0.0003 |
|log-return|*I(right-tail) |
-10.677 |
3.107 |
-3.437 |
0.0006 |
Hurst exponent (of daily return price)
| 12-day | 24-day | 48-day | 96-day |
| 0.698 |
0.432 |
0.736 |
0.646 |
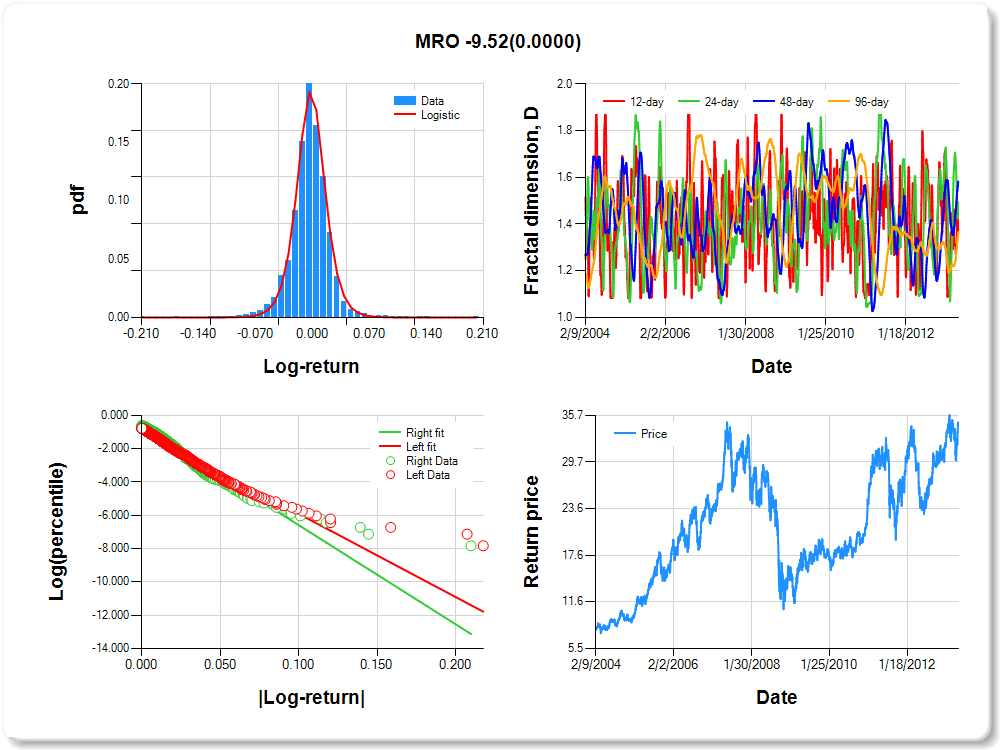
MRO
Percentile values of daily loss(gain) in per cent
| 0.5 | 1 | 5 | 10 | 25 | 50 | 75 | 90 | 95 | 99 | 99.5 |
| -0.08 |
-0.07 |
-0.04 |
-0.03 |
-0.01 |
0.00 |
0.01 |
0.03 |
0.06 |
0.08 |
0.63 |
Daily log-return distribution fitting results
| Distribution | Location, a | Scale, b |
| Logistic |
0.049 |
0.088 |
Linear regression results [Model: y=log(percentile of log-return), x=|log-return|]
| Variable | Coef(b) | s.e.(b) | t-value | P-value |
| Constant |
-0.908 |
0.040 |
-22.637 |
0.0000 |
|log-return| |
-49.952 |
1.540 |
-32.436 |
0.0000 |
I(right-tail) |
0.274 |
0.056 |
4.870 |
0.0000 |
|log-return|*I(right-tail) |
-9.523 |
2.289 |
-4.161 |
0.0000 |
Hurst exponent (of daily return price)
| 12-day | 24-day | 48-day | 96-day |
| 0.640 |
0.511 |
0.417 |
0.634 |
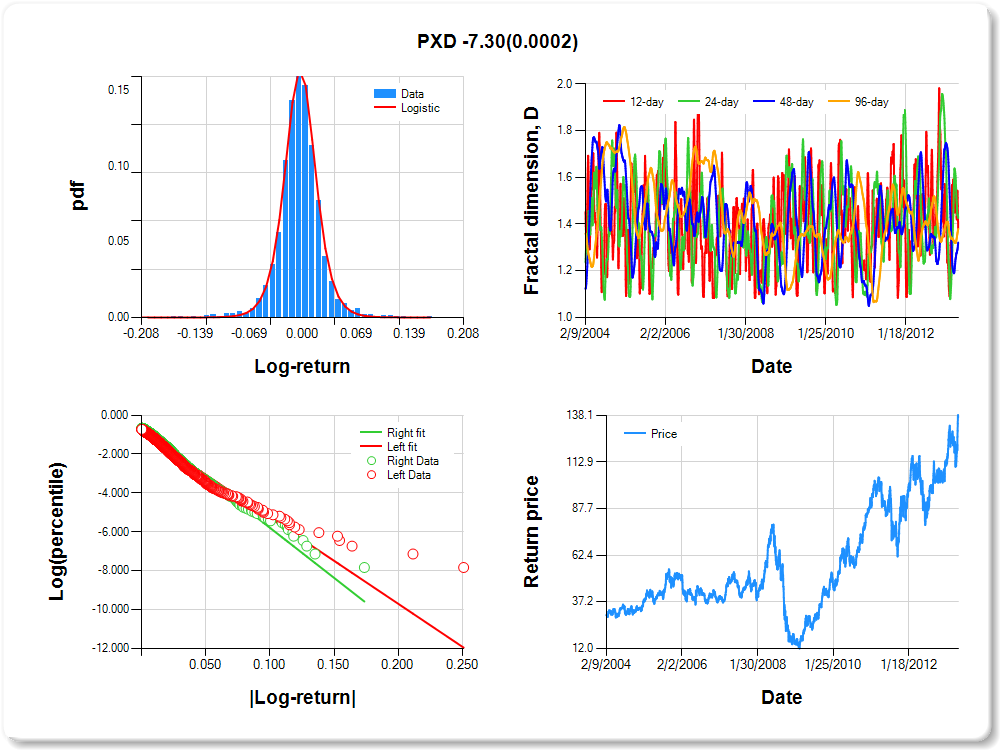
PXD
Percentile values of daily loss(gain) in per cent
| 0.5 | 1 | 5 | 10 | 25 | 50 | 75 | 90 | 95 | 99 | 99.5 |
| -0.10 |
-0.08 |
-0.04 |
-0.03 |
-0.01 |
0.00 |
0.02 |
0.04 |
0.08 |
0.10 |
1.55 |
Daily log-return distribution fitting results
| Distribution | Location, a | Scale, b |
| Logistic |
0.321 |
0.104 |
Linear regression results [Model: y=log(percentile of log-return), x=|log-return|]
| Variable | Coef(b) | s.e.(b) | t-value | P-value |
| Constant |
-0.860 |
0.039 |
-22.269 |
0.0000 |
|log-return| |
-44.180 |
1.321 |
-33.439 |
0.0000 |
I(right-tail) |
0.217 |
0.056 |
3.890 |
0.0001 |
|log-return|*I(right-tail) |
-7.298 |
1.969 |
-3.706 |
0.0002 |
Hurst exponent (of daily return price)
| 12-day | 24-day | 48-day | 96-day |
| 0.621 |
0.574 |
0.679 |
0.620 |
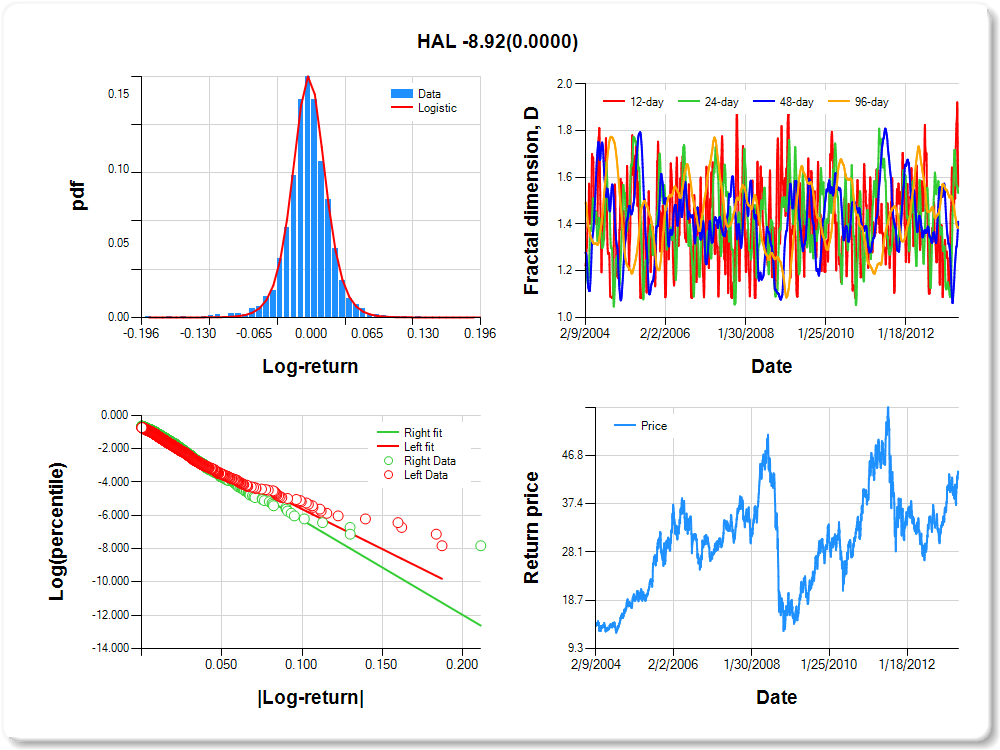
HAL
Percentile values of daily loss(gain) in per cent
| 0.5 | 1 | 5 | 10 | 25 | 50 | 75 | 90 | 95 | 99 | 99.5 |
| -0.10 |
-0.08 |
-0.04 |
-0.03 |
-0.01 |
0.00 |
0.01 |
0.04 |
0.07 |
0.08 |
0.75 |
Daily log-return distribution fitting results
| Distribution | Location, a | Scale, b |
| Logistic |
-0.094 |
0.105 |
Linear regression results [Model: y=log(percentile of log-return), x=|log-return|]
| Variable | Coef(b) | s.e.(b) | t-value | P-value |
| Constant |
-0.838 |
0.040 |
-21.176 |
0.0000 |
|log-return| |
-47.878 |
1.431 |
-33.447 |
0.0000 |
I(right-tail) |
0.235 |
0.057 |
4.149 |
0.0000 |
|log-return|*I(right-tail) |
-8.917 |
2.156 |
-4.136 |
0.0000 |
Hurst exponent (of daily return price)
| 12-day | 24-day | 48-day | 96-day |
| 0.440 |
0.467 |
0.589 |
0.613 |
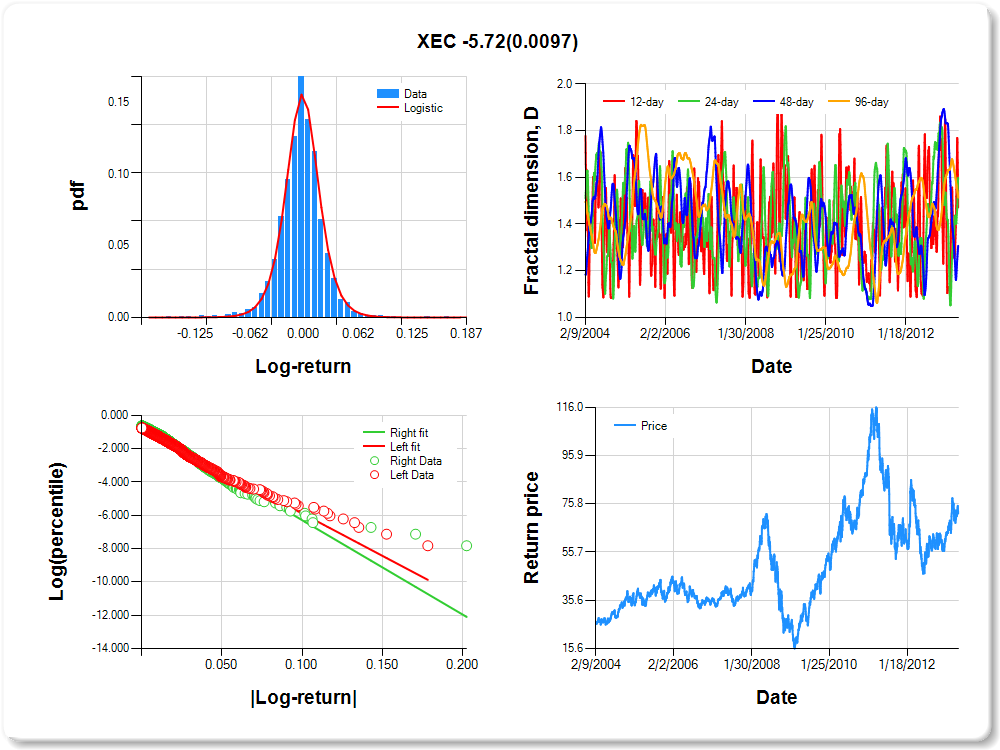
XEC
Percentile values of daily loss(gain) in per cent
| 0.5 | 1 | 5 | 10 | 25 | 50 | 75 | 90 | 95 | 99 | 99.5 |
| -0.09 |
-0.07 |
-0.04 |
-0.03 |
-0.01 |
0.00 |
0.01 |
0.04 |
0.06 |
0.08 |
1.39 |
Daily log-return distribution fitting results
| Distribution | Location, a | Scale, b |
| Logistic |
-0.094 |
0.110 |
Linear regression results [Model: y=log(percentile of log-return), x=|log-return|]
| Variable | Coef(b) | s.e.(b) | t-value | P-value |
| Constant |
-0.802 |
0.041 |
-19.568 |
0.0000 |
|log-return| |
-50.853 |
1.522 |
-33.410 |
0.0000 |
I(right-tail) |
0.167 |
0.057 |
2.933 |
0.0034 |
|log-return|*I(right-tail) |
-5.722 |
2.210 |
-2.589 |
0.0097 |
Hurst exponent (of daily return price)
| 12-day | 24-day | 48-day | 96-day |
| 0.528 |
0.401 |
0.693 |
0.487 |
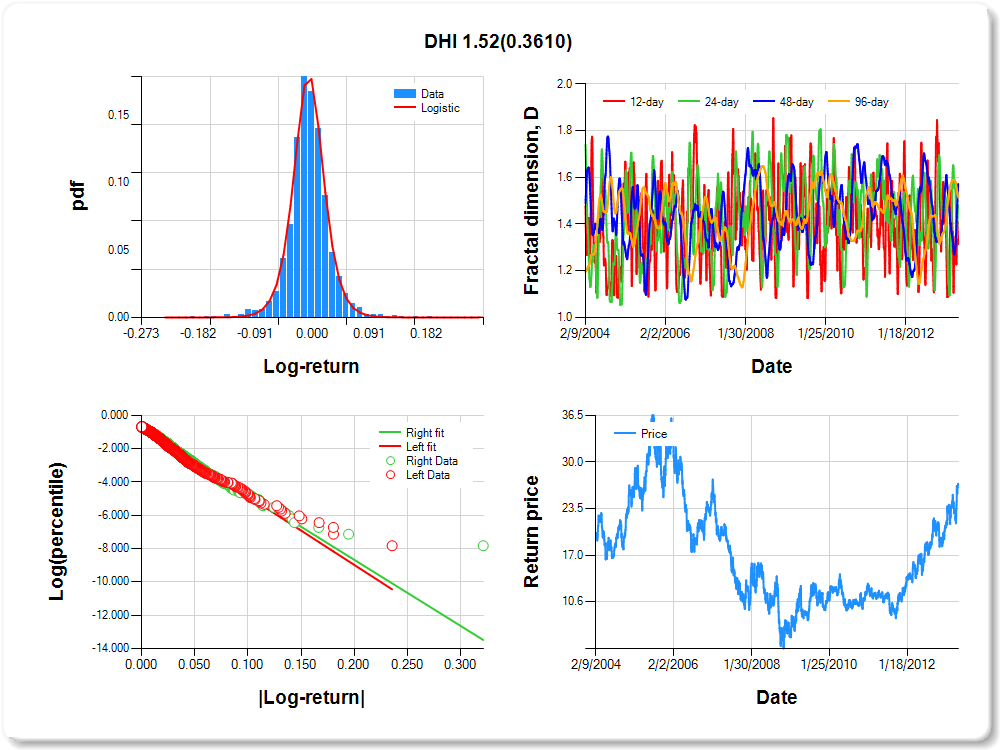
DHI
Percentile values of daily loss(gain) in per cent
| 0.5 | 1 | 5 | 10 | 25 | 50 | 75 | 90 | 95 | 99 | 99.5 |
| -0.11 |
-0.09 |
-0.05 |
-0.03 |
-0.02 |
0.00 |
0.02 |
0.05 |
0.10 |
0.12 |
1.05 |
Daily log-return distribution fitting results
| Distribution | Location, a | Scale, b |
| Logistic |
-0.267 |
0.095 |
Linear regression results [Model: y=log(percentile of log-return), x=|log-return|]
| Variable | Coef(b) | s.e.(b) | t-value | P-value |
| Constant |
-0.741 |
0.039 |
-18.887 |
0.0000 |
|log-return| |
-41.141 |
1.187 |
-34.652 |
0.0000 |
I(right-tail) |
0.001 |
0.056 |
0.021 |
0.9836 |
|log-return|*I(right-tail) |
1.520 |
1.664 |
0.914 |
0.3610 |
Hurst exponent (of daily return price)
| 12-day | 24-day | 48-day | 96-day |
| 0.686 |
0.523 |
0.428 |
0.486 |
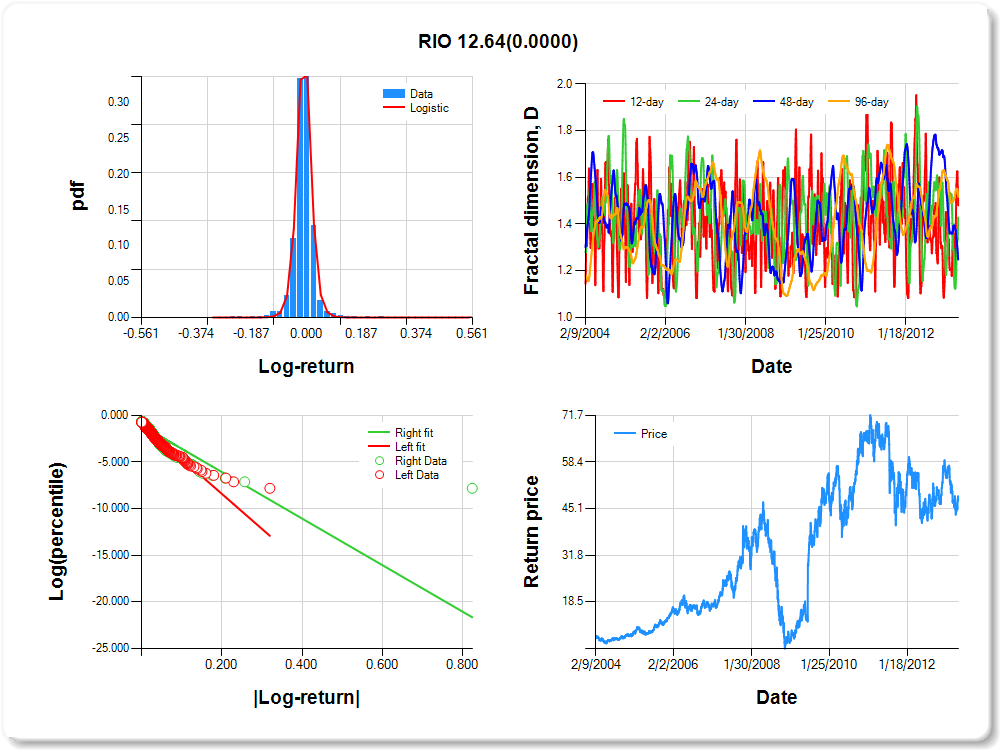
RIO
Percentile values of daily loss(gain) in per cent
| 0.5 | 1 | 5 | 10 | 25 | 50 | 75 | 90 | 95 | 99 | 99.5 |
| -0.11 |
-0.10 |
-0.04 |
-0.03 |
-0.01 |
0.00 |
0.02 |
0.04 |
0.10 |
0.12 |
0.67 |
Daily log-return distribution fitting results
| Distribution | Location, a | Scale, b |
| Logistic |
-0.754 |
0.044 |
Linear regression results [Model: y=log(percentile of log-return), x=|log-return|]
| Variable | Coef(b) | s.e.(b) | t-value | P-value |
| Constant |
-0.926 |
0.038 |
-24.222 |
0.0000 |
|log-return| |
-37.566 |
1.141 |
-32.919 |
0.0000 |
I(right-tail) |
-0.184 |
0.051 |
-3.599 |
0.0003 |
|log-return|*I(right-tail) |
12.642 |
1.440 |
8.777 |
0.0000 |
Hurst exponent (of daily return price)
| 12-day | 24-day | 48-day | 96-day |
| 0.519 |
0.571 |
0.752 |
0.483 |
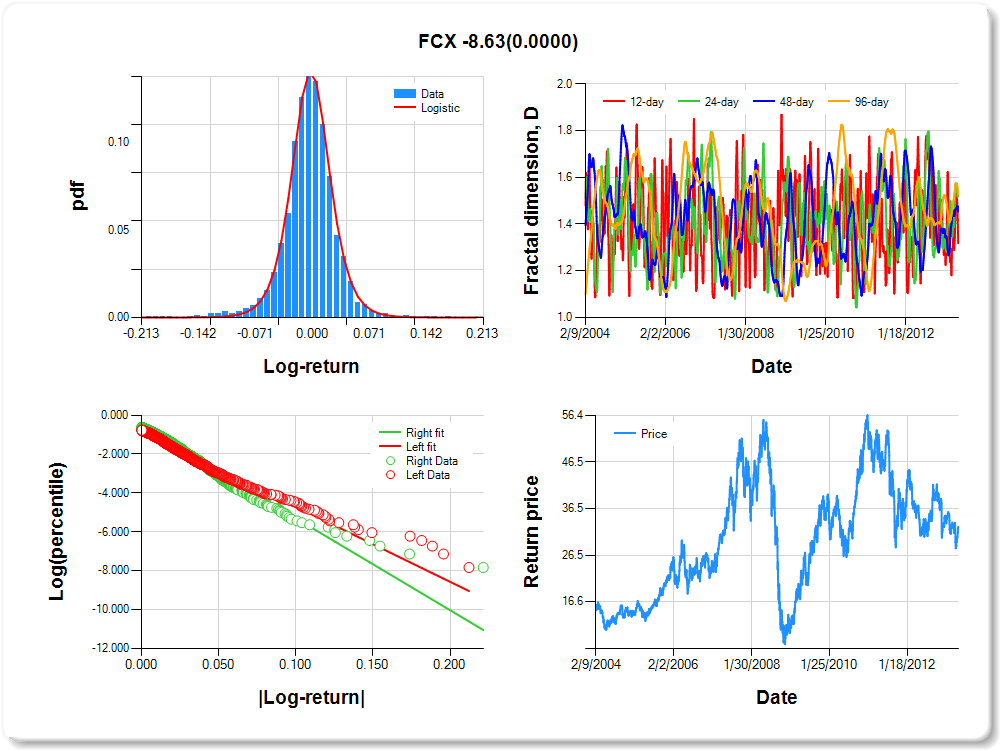
FCX
Percentile values of daily loss(gain) in per cent
| 0.5 | 1 | 5 | 10 | 25 | 50 | 75 | 90 | 95 | 99 | 99.5 |
| -0.11 |
-0.10 |
-0.05 |
-0.03 |
-0.01 |
0.00 |
0.02 |
0.05 |
0.08 |
0.10 |
0.72 |
Daily log-return distribution fitting results
| Distribution | Location, a | Scale, b |
| Logistic |
-0.020 |
0.121 |
Linear regression results [Model: y=log(percentile of log-return), x=|log-return|]
| Variable | Coef(b) | s.e.(b) | t-value | P-value |
| Constant |
-0.837 |
0.041 |
-20.632 |
0.0000 |
|log-return| |
-38.630 |
1.161 |
-33.274 |
0.0000 |
I(right-tail) |
0.266 |
0.057 |
4.661 |
0.0000 |
|log-return|*I(right-tail) |
-8.631 |
1.758 |
-4.908 |
0.0000 |
Hurst exponent (of daily return price)
| 12-day | 24-day | 48-day | 96-day |
| 0.682 |
0.460 |
0.546 |
0.475 |
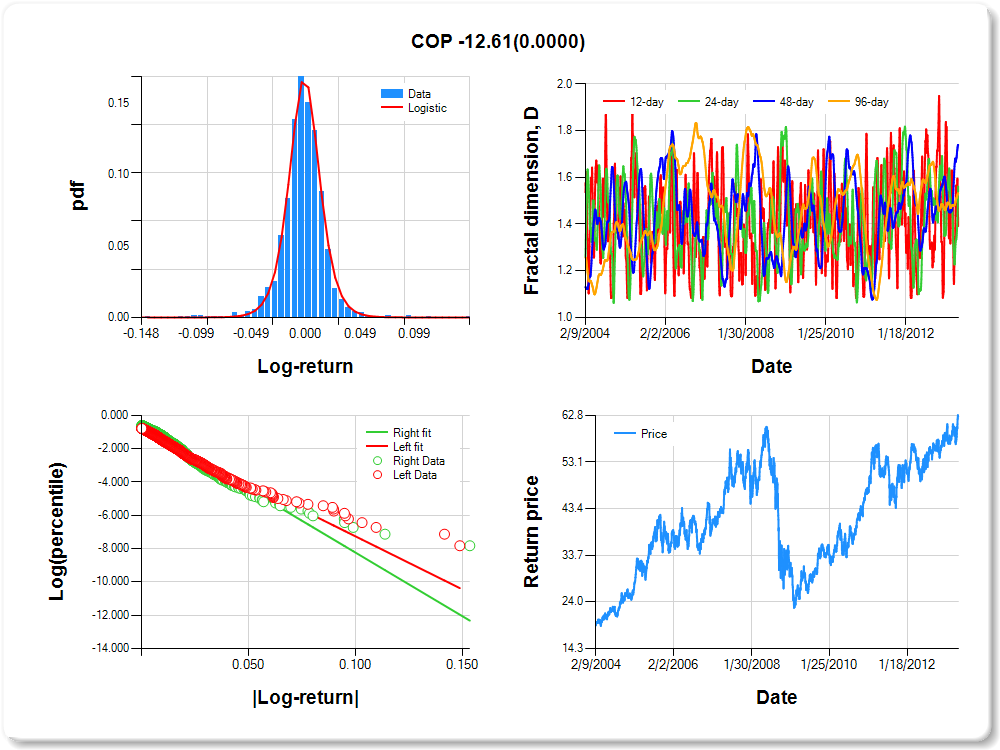
COP
Percentile values of daily loss(gain) in per cent
| 0.5 | 1 | 5 | 10 | 25 | 50 | 75 | 90 | 95 | 99 | 99.5 |
| -0.07 |
-0.06 |
-0.03 |
-0.02 |
-0.01 |
0.00 |
0.01 |
0.03 |
0.05 |
0.06 |
0.00 |
Daily log-return distribution fitting results
| Distribution | Location, a | Scale, b |
| Logistic |
-0.007 |
0.102 |
Linear regression results [Model: y=log(percentile of log-return), x=|log-return|]
| Variable | Coef(b) | s.e.(b) | t-value | P-value |
| Constant |
-0.891 |
0.040 |
-22.059 |
0.0000 |
|log-return| |
-63.712 |
1.951 |
-32.651 |
0.0000 |
I(right-tail) |
0.288 |
0.056 |
5.094 |
0.0000 |
|log-return|*I(right-tail) |
-12.608 |
2.903 |
-4.343 |
0.0000 |
Hurst exponent (of daily return price)
| 12-day | 24-day | 48-day | 96-day |
| 0.608 |
0.439 |
0.261 |
0.469 |
SLB
Percentile values of daily loss(gain) in per cent
| 0.5 | 1 | 5 | 10 | 25 | 50 | 75 | 90 | 95 | 99 | 99.5 |
| -0.08 |
-0.06 |
-0.04 |
-0.02 |
-0.01 |
0.00 |
0.01 |
0.04 |
0.06 |
0.08 |
0.59 |
Daily log-return distribution fitting results
| Distribution | Location, a | Scale, b |
| Logistic |
0.331 |
0.114 |
Linear regression results [Model: y=log(percentile of log-return), x=|log-return|]
| Variable | Coef(b) | s.e.(b) | t-value | P-value |
| Constant |
-0.826 |
0.040 |
-20.598 |
0.0000 |
|log-return| |
-53.135 |
1.605 |
-33.101 |
0.0000 |
I(right-tail) |
0.222 |
0.057 |
3.897 |
0.0001 |
|log-return|*I(right-tail) |
-8.872 |
2.370 |
-3.743 |
0.0002 |
Hurst exponent (of daily return price)
| 12-day | 24-day | 48-day | 96-day |
| 0.622 |
0.484 |
0.574 |
0.462 |

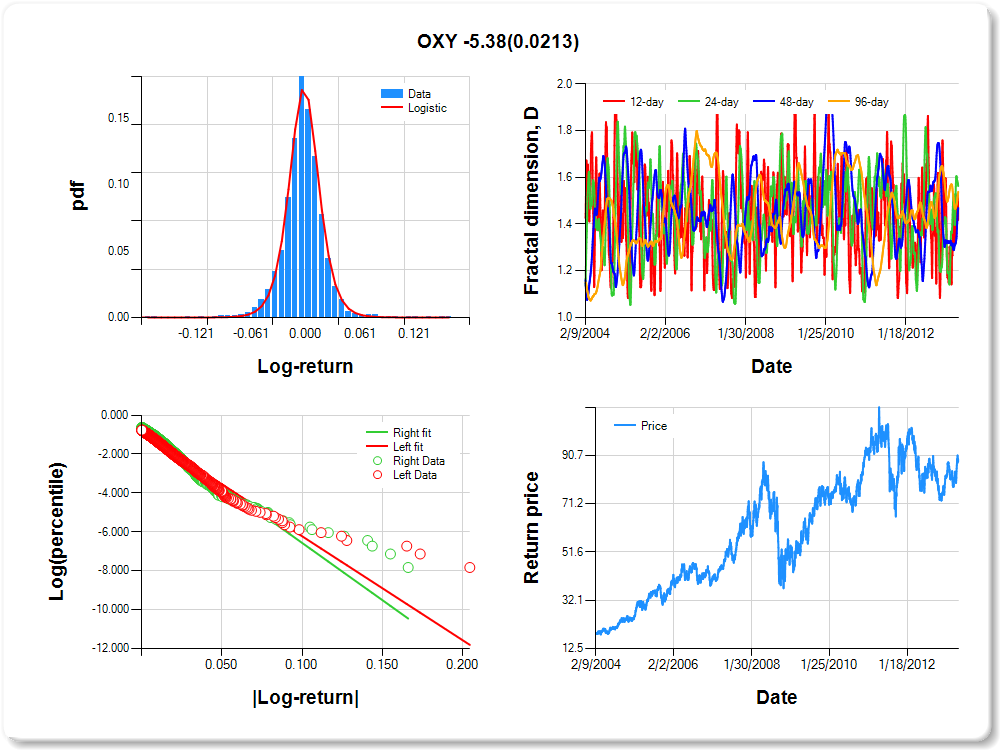
OXY
Percentile values of daily loss(gain) in per cent
| 0.5 | 1 | 5 | 10 | 25 | 50 | 75 | 90 | 95 | 99 | 99.5 |
| -0.08 |
-0.06 |
-0.03 |
-0.02 |
-0.01 |
0.00 |
0.01 |
0.03 |
0.07 |
0.08 |
-0.41 |
Daily log-return distribution fitting results
| Distribution | Location, a | Scale, b |
| Logistic |
0.193 |
0.099 |
Linear regression results [Model: y=log(percentile of log-return), x=|log-return|]
| Variable | Coef(b) | s.e.(b) | t-value | P-value |
| Constant |
-0.880 |
0.040 |
-22.162 |
0.0000 |
|log-return| |
-53.426 |
1.626 |
-32.852 |
0.0000 |
I(right-tail) |
0.196 |
0.055 |
3.543 |
0.0004 |
|log-return|*I(right-tail) |
-5.384 |
2.338 |
-2.303 |
0.0213 |
Hurst exponent (of daily return price)
| 12-day | 24-day | 48-day | 96-day |
| 0.582 |
0.437 |
0.531 |
0.461 |
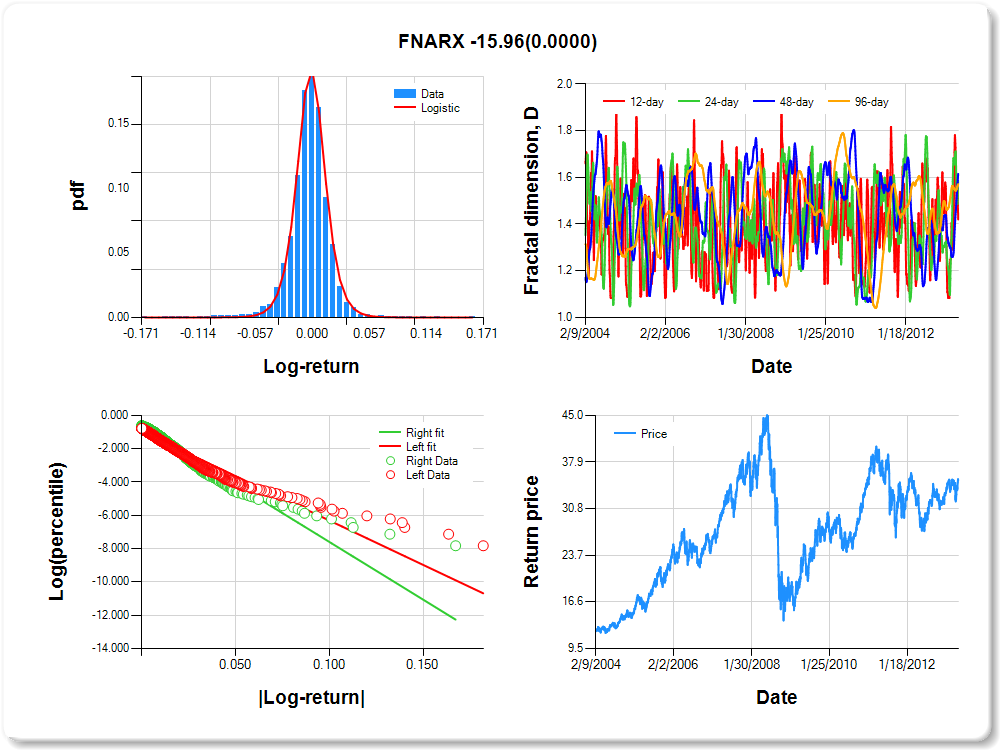
FNARX
Percentile values of daily loss(gain) in per cent
| 0.5 | 1 | 5 | 10 | 25 | 50 | 75 | 90 | 95 | 99 | 99.5 |
| -0.09 |
-0.07 |
-0.03 |
-0.02 |
-0.01 |
0.00 |
0.01 |
0.03 |
0.05 |
0.07 |
0.64 |
Daily log-return distribution fitting results
| Distribution | Location, a | Scale, b |
| Logistic |
0.092 |
0.089 |
Linear regression results [Model: y=log(percentile of log-return), x=|log-return|]
| Variable | Coef(b) | s.e.(b) | t-value | P-value |
| Constant |
-0.979 |
0.039 |
-25.258 |
0.0000 |
|log-return| |
-53.270 |
1.650 |
-32.290 |
0.0000 |
I(right-tail) |
0.314 |
0.055 |
5.724 |
0.0000 |
|log-return|*I(right-tail) |
-15.958 |
2.574 |
-6.201 |
0.0000 |
Hurst exponent (of daily return price)
| 12-day | 24-day | 48-day | 96-day |
| 0.580 |
0.414 |
0.384 |
0.429 |
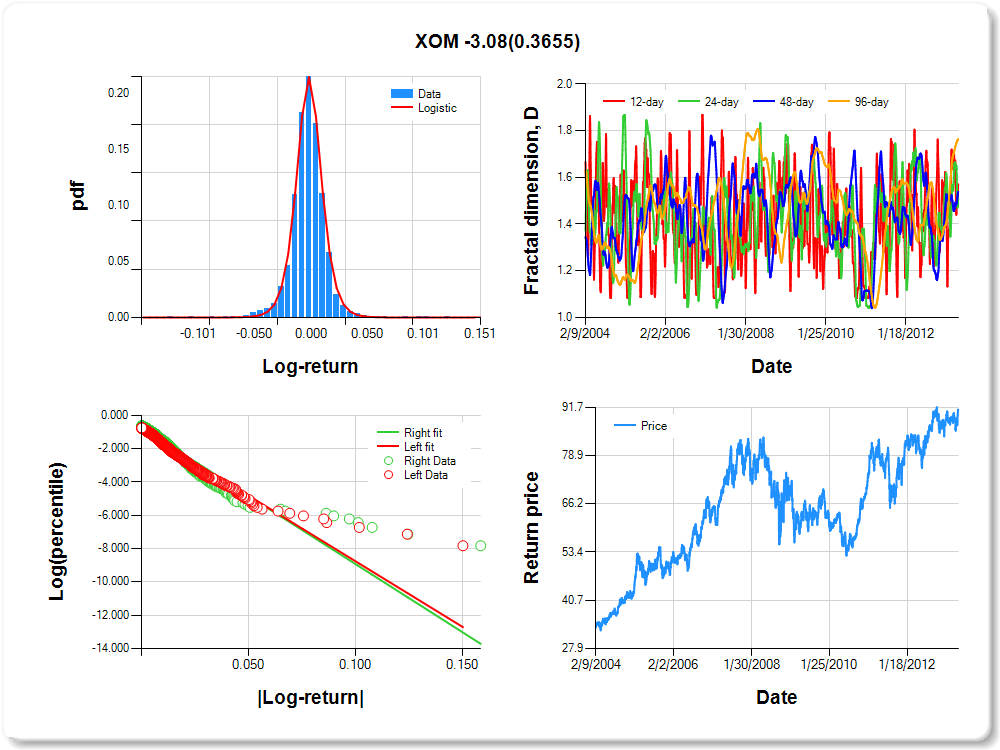
XOM
Percentile values of daily loss(gain) in per cent
| 0.5 | 1 | 5 | 10 | 25 | 50 | 75 | 90 | 95 | 99 | 99.5 |
| -0.05 |
-0.04 |
-0.02 |
-0.02 |
-0.01 |
0.00 |
0.01 |
0.02 |
0.04 |
0.05 |
1.07 |
Daily log-return distribution fitting results
| Distribution | Location, a | Scale, b |
| Logistic |
-0.034 |
0.080 |
Linear regression results [Model: y=log(percentile of log-return), x=|log-return|]
| Variable | Coef(b) | s.e.(b) | t-value | P-value |
| Constant |
-0.896 |
0.039 |
-22.722 |
0.0000 |
|log-return| |
-78.607 |
2.408 |
-32.646 |
0.0000 |
I(right-tail) |
0.141 |
0.055 |
2.580 |
0.0099 |
|log-return|*I(right-tail) |
-3.084 |
3.407 |
-0.905 |
0.3655 |
Hurst exponent (of daily return price)
| 12-day | 24-day | 48-day | 96-day |
| 0.429 |
0.491 |
0.462 |
0.236 |