Some transformations require specification of parameters/options, whereas some don't.
Normalization[0,1] Normalization re-scales the values of a continuous feature to be in the range [0,1] using the relationship
where x_i is the ith value of a feature, x_min is the minimum value of the feature, and x_max is the maximum.
Explorer adds ``n_'' to the leading edge of the original variable's name.
Mean-Zero Standardization (Z) Normal distributions can vary by central location and dispersion based on the mean and variance. A frequency histogram for a group of patients having a mean weight of 130 pounds and standard deviation 12, will be centrally located 70 units (pounds) to the left of a histogram for patients with mean weight 200 pounds and standard deviation 12, when plotted on the same graph. Distributions with varying means and standard deviations are called scale and range dependent, since their location and spread on the same histogram will be different. A powerful transformation which can be applied to any normal distribution to remove the effects of scale and range is called the Z-transformation.
Let bar{x} and sigma_x be the mean and standard deviation of a normal distribution of sample size n=1,000. The Z-score for each of the n normal variates is given as
where x_i represents a normal variate, and Z_i is a newly derived standard normal variate. The process of subtracting the mean from each normal variate and dividing by the standard deviation is called standardization, which results in a standard normal distribution.
Z-transformations do not remove skewness from an input distribution. If the feature(s) being transformed is skewed, the resulting Z-scores will also result in the same degree of skewness.
Explorer adds "z_" to the leading edge of features names after undergoing the Z-transform.
Logarithmic Transforms (LN) The logarithmic transform is one of the better transforms for rescaling a skewed dataset with a right tail so that it becomes more normally-distributed. As an example, in the Retinol dataset, the distribution of RETDIET is as follows:
and it can be seen that the transformed version of RETDIET is more normally-distributed since large outlier values of RETDIET in the right tail of the untransformed RETDIET are essentially removed after taking the log_e transform:
Explorer adds "loge_'' to the leading edge of the original variable's name. For base 10, "log10_"' is added to the leading edge of the original variable's name. For use of a custom base, for example, 2, the custom base is added to the leading edge in the form "log2_''.
Quantile (Q) The quantile transform will first determine the percentile value for each observation based on each value's rank divided by (n+1), and then generate a new variable whose codes represent the various quantile category the percentile falls into. For example, if 4 quartiles (default) are specified, then any original percentile values less than or equal to 25% will be assigned a 1, percentiles greater than 25% and less than or equal to 50% will be coded as a 2, greater than 50% and less than or equal to 75% will be coded as a 3, and the remaining percentiles greater than 75% will be coded as a 4.
Explorer adds "q_'' to the leading edge of the original variable's name.
Rank (R(x)) The rank transform will arrange the values for a variable in ascending order (smallest first) and then assign the record number corresponding to the sort position. For example, if there are 100 values for a variable, then the ranks for these original variable values will take on ranks 1,2,...,100. A common approach for displaying values of x that are sorted in ascending order is to use the notation x_(1), x_(2), ..., x_(n), where the subscript () denotes ranking. Another common notation to reflect ranked variate values is x_1<x_2< ... < x_n.
The table below lists the ranks for 10 x-values sorted in ascending order.
Explorer adds "r_'' to the leading edge of the original variable's name.
Percentile (%) The percentile value for each observation is equal to the value's rank divided by (n+1). Percentiles reveal the location of each value on a scale of 0 to 1. Therefore, the p5 is the 5th percentile, p10 is the 10th percentile, p25 is the 25th percentile, p50 is the median or 50th percentile, p75 the 75th percentile, p90 the 90th percentile, and p95 the 95th percentile.
The table below lists the percentiles for 10 x-values sorted in ascending order.
Explorer adds "pct_'' to the leading edge of the original variable's name.
van der Waerden Scores (VDW) van der Waerden (vdw) scores transform a variable's values into skew-zero standard normal variates for which the mean is zero and standard deviation is unity (one). Recall that the normal cdf function INV(Z) converts an input Z-score into a tail probability using the normal cdf, whereas the inverse cdf function maps the probability back to the Z-score, as listed in the following table:
The steps involved for calculating the vdw score for each value of a variable are:
Sort values in ascending order
Assign ranks corresponding the sort order, starting with a 1 for the smallest value and n for the largest value
Divide each rank by n+1 to obtain the value's percentile, that is, pct_i=R(x_i)/(n+1).
Input each pct value into the inverse CDF function, INV^{-1}(pct), to obtain the Z-score for the given cdf probability
The table below lists the VDW scores for 10 x-values sorted in ascending order.
The VDW transform is a skew-zero transform, since it always removes skewness that may exist in the input distribution.
Explorer adds "vdw_'' to the leading edge of the original variable's name.
Nominal-to-Binary The nominal-to-binary transform creates a new binary yes/no variable for each level of a category of a nominally-scaled categorical variable. For example, if there are 3 levels of a category, 3 new variables will be generated, and for each record, only one of the three new variable will be set to 1 (0 otherwise) corresponding to the category of the particular record. The table below lists the nominal to binary coding results for a fictitious 3-level categorical variable called "catvar.''
NXG Explorer adds a "b_'' to the leading edge of the categorical variable's name, and adds a trailing 1,2,...,k to the end of the original variable name to denote which category the binary variable represents.
Fuzzification Fuzzy logic provides a mixture of methods for flexible information processing of ambiguous data. Fuzzy transformations were are used to map the original values of an input feature into 3 fuzzy sets representing linguistic membership functions, in order to facilitate the semantic interpretation of each fuzzy set. The fuzzy sets low, medium, and high exploit uncertainty among the original feature values, reducing the information in order to obtain a robust, less-expensive, and tractable solution.
To fuzzify a continuous feature, first determine x_min and x_max as the minimum and maximum values of x_ij for feature j over all input samples and q_1 and q_2 as the quantile values of x_{ij} at the 33rd and 66th percentile. Then, calculate the averages Avg_1=(x_min+q_1)/2, Avg_2=(q_1+q_2)/2, and Avg_3=(q_2+x_max)/2. Next, translate each value of x_ij for feature j into 3 fuzzy membership values in the range [0,1] as mu_{low,i,j}, mu_{mid,i,j}, and mu_{high,i,j} using the relationships
The above computations result in 3 fuzzy sets (vectors) mu_{low,j}, mu_{med,j} and mu}_{high,j} of length n which replace the original input feature. The figure below illustrates the values of the membership functions as a function of x_ij. When features are fuzzified using the methods described above and then input into class prediction analysis the classification analysis is called ``fuzzy,'' whereas without feature fuzzification, the classification analysis is called ``crisp.''
NXG Explorer adds an "f_'' to the leading edge of the categorical variable's name, and adds a trailing _1, _2, or _3 to the end of the original variable name to denote the lower, middle, and upper fuzzy transform.
Fast Wavelet Transform (FWT) The fast wavelet transform (FWT) is a mathematical transform which results in a series of orthogonal coefficients of varying resolution. Because of the notation and figures used, readers should refer to the User's Guide, section 4.10 for more detailed information on FWT.
Super-resolution Root MUSIC NXG Logic Explorer performs super-resolution (root) multi-signal classification (MUSIC) on class-specific p x p covariance matrices employed in class prediction analysis. Root MUSIC is a pre-classification reduction technique which reduces the number of dimensions of the features used down to a number of dimensions equal to the number of classes of the objects. The objects employed for root MUSIC analysis must therefore have class membership assignments within the input dataset.
Readers should refer to the User's Guide, section 4.11 for more detailed information on root MUSIC.
Continuous to Categorical This option in the feature transformation module allows one to convert continuously-scaled features to categorical using cutpoints and lower and upper boundary limits. Below is a snapshot of the popup window that appears when performing the continuous to categorical transformations:
The various options are described below. Cutpoints are lower bounds. For example, if age is the feature, cutpoints 20,30,40 will result in category codes 1 for ≤19, 2 for 20-29, 3 for 30-39, and 4 for 40+.
Cutpoints are upper bounds. For example, if age is the feature, cutpoints 20,30,40 will result in category codes 1 for ≤20, 2 for 21-30, 3 for 31-40 and 4 for 41+. Apply lower limit (30-39, .... This option will enforce a lower bound to the categorization.
Apply upper limit ....51-60) This option will enforce an upper bound to the categorization. Use real-valued cutpoints (integer is default).} This option will replace the standard mathematical notation such as 30≤X<40 with e.g. 30-39, and replace X≥60 with "60+.''
Text to Categorical (converts all text features) This feature transformation option will prompt the user to convert all text features in the input dataset. As an example, import the Fisher_Iris_wo_class.xlsx file, and then select Transformations-->Text-to-Categorical (converts all text features) from the command pull-down menu as shown in the following image:
Since the class feature is a text feature, it's elements will be loaded into a form showing all words found along with their frequencies.
and then click on the Set as Categorical, and the categorical levels of the class text feature will be transformed into class categorical values of 1, 2, and 3. NXG Logic Explorer will also automatically copy the original text value for each category into memory, so that their labels can be output during analyses. As an example, the image below shows results of running ANOVA on the 4 continuous features in the Fisher Iris dataset, with the category labels shown in the column headers.
Text to Categorical (select which text feature)
This transformation will also perform a text-to-categorical transformation for any text feature, however, the user must select the specific feature to be transformed.
Assign Categorical Features w/labels to Class Feature
Any categorical feature can be set to be a class feature (for class prediction analysis) as long as the labels have been input. This can be accomplished by either importing a file with class values and their labels, or by transforming text-to-categorical using the above transformations, or by assigning categorical labels using the Editor. The numeric class feature values will then be used for assigning symbol colors in all class discovery runs.
Transformations During Cross-Validation for Supervised Class Prediction
Explorer will transform features values over objects inside CV folds used for training and separately for objects used for testing, based on parameters obtained from objects within training folds. For example, if 10 folds are used for CV, feature transformation occurs over all objects within partitions (folds) D_2,...,D_10 and then feature values for testing objects in fold D_1 are transformed using parameters from training folds D_2,...,D_10. When normalization is specified, feature values for min(x) and max(x) are based on objects in the training folds and applied to objects in the testing fold. Boundary constraints for the range [0,1] are maintained by setting negative feature values for objects in the testing fold to zero, and values greater than 1 are set to 1. For mean-zero standardization, the feature mean and s.d. are obtained from all objects in the training folds, and then are applied to objects in the testing fold.
Default options for feature transformations during CV for class prediction runs can be set in the general default settings popup window, which are shown in the image below:
When using the workflow (icons) for a pipeline, you can run all the tasks in the current workflow by clicking on the green-colored button shown below:
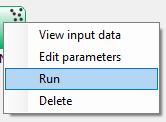
Otherwise, to run a single task in the workflow, then right-click on the specific green run-icon, and select Run: